![]() Dianne M. A. S. Nuven1,
Dianne M. A. S. Nuven1, ![]() Juan Pablo Quimbayo2,
Juan Pablo Quimbayo2, ![]() Ariane A. Rodrigues1,
Ariane A. Rodrigues1, ![]() José Francisco Gonçalves Júnior1 and
José Francisco Gonçalves Júnior1 and ![]() Murilo Sversut Dias1
Murilo Sversut Dias1 ![]()
PDF: Download Here | Supplementary: Sup | Cite this article
Associate Editor: ![]() Lilian Casatti
Lilian Casatti
Section Editor: ![]() Fernando Pelicice
Fernando Pelicice
Editor-in-chief: ![]() José Birindelli
José Birindelli
Abstract
Os seres humanos têm promovido extensas mudanças no uso da terra, representando sérias ameaças aos ecossistemas. Apesar dos avanços recentes, o impacto dessas atividades nas interações ecológicas e métricas de redes tróficas em ecossistemas de água doce permanece pouco compreendido em grandes escalas espaciais. Nossa hipótese é que a intensidade do uso da terra simplifica e homogeniza as redes tróficas, aumentando a aninhamento e diminuindo a modularidade, conectância, especialização trófica e o número de interações, devido à perda de especialistas e à homogeneização dos riachos. Compilamos estudos sobre redes tróficas de peixes de riachos brasileiros (1982–2021) e quantificamos a influência do uso do solo pela porcentagem de cobertura da terra em buffers ao redor das regiões amostradas, para avaliar como impactos antrópicos moldam a estrutura trófica. Quantificamos aninhamento, modularidade, especialização trófica, conectância, número médio de ligações por espécie, densidade de ligações e número de nós. As redes tróficas foram mais aninhadas do que modulares, mas não observamos um efeito geral do uso da terra sobre as métricas. Contudo, ao discriminar entre as duas categorias primárias de cobertura do solo, a porcentagem de pastagem reduziu a modularidade, enquanto a agricultura não apresentou efeito. Em grande escala, diferentes usos da terra geram mudanças sutis na estrutura das redes, mas o aumento de pastagens simplifica habitats aquáticos, favorecendo generalistas e reduzindo especialistas.
Palavras-chave: Aninhamento, Cobertura de pastagem, Cobertura de terras agrícolas, Dieta de peixes, Itens alimentares.
Introduction
Natural communities consist of species interacting in various ways, a structure that can be represented as an ecological network (Hric et al., 2016). In these networks, species or individuals are depicted as nodes, connected by links that symbolize their biological interactions (Boccaletti et al., 2006). This network approach offers an effective method for representing, characterizing, and identifying the structural determinants of natural systems (Cohen, Havlin, 2010). It has been successfully applied to complex systems such as mutualism (Mougi, Kondoh, 2014) and trophic interactions (Baumgartner, Robinson, 2017). However, understanding how these networks change across space and time and their drivers remains challenging (Poisot et al., 2015; CaraDonna et al., 2021; Ceron et al., 2022). Consequently, research into these dynamics provides crucial insights into the ecological and evolutionary processes that structure and organize biotic interactions (Tylianakis, Morris, 2017).
The structure of ecological networks is dynamic, varying significantly across spatial gradients due to shifts in abiotic conditions, resource availability, species composition, and habitat heterogeneity (Tylianakis et al., 2007; Poisot et al., 2012; Winemiller, 1990). Local environmental filters, such as temperature, nutrient concentration, and habitat complexity, can modify species traits, abundances, and encounter rates, thereby reshaping interactions within a community (Woodward et al., 2010; Bartomeus et al., 2016). For instance, structurally complex habitats often support greater resource diversity and stronger niche partitioning, fostering more modular networks, where interactions are compartmentalized into tightly connected subgroups, and more specialized trophic interactions (Thompson et al., 2001). In contrast, simplified or homogeneous environments often lead to more generalized and nested interactions, where the interactions of less-connected species form a subset of those of highly connected species, due to reduced ecological opportunities and greater overlap in resource use (Bascompte et al., 2003; Dalsgaard et al., 2013). Consequently, spatial variation in network structure reflects the interplay between the biotic context and the environmental conditions that ultimately shape species interactions.
A growing body of research is examining the effects of human activities on the structure and dynamics of ecological networks (Effert-Fanta et al., 2023; Neves et al., 2024; Wang et al., 2021). For instance, habitat degradation often leads to more nested, rather than modular, network structures (Bascompte et al., 2003; Olesen et al., 2007; Dormann, Strauss, 2014). This disturbance also affects other network descriptors, such as trophic specialization (a metric indicating the degree of species consumption on exclusive food items), the mean number of links per species, and number of trophic links according to the number of nodes (number of links given consumers and resources) can also be affected by habitat degradation (Staudacher et al., 2018; Felipe-Lucia et al., 2020). Such changes in network architecture, driven by anthropogenic disturbance (Pellissier et al., 2018), provide critical insights into subsequent alterations in ecosystem functioning.
Most impacts on freshwater ecosystems are directly or indirectly linked to land-use change (Vörösmarty et al., 2010; Tabi et al., 2025), which affects fish communities through multiple pathways (Dala-Corte et al., 2016). For instance, converting natural habitats to croplands or pastures increases siltation and nutrient input while homogenizing stream substrates (Neill et al., 2001; Sutherland et al., 2012). Simultaneously, the loss of riparian vegetation reduces allochthonous matter input, increases autochthonous production, and alters the quality and quantity of available food resources (Bambi et al., 2023; Leal et al., 2023). In response to these altered resource bases and degraded environmental conditions, fish species often shift their diets (Prejs, Prejs, 1987; Alonso et al., 2019). This can lead to greater niche overlap, driven by a rise in generalist and opportunistic feeding strategies and a decline in specialist species. Consequently, the structure of trophic networks shifts along land-use intensity gradients (Herbst et al., 2013; Amarillo-Suárez et al., 2024; Botella et al., 2024), with network metrics responding variably to the degree of habitat modification. In essence, riparian forest integrity is critical for supplying food resources to aquatic communities (Zeni, Casatti, 2014; Carvalho et al., 2019; Dolabela et al., 2022; Severo-Neto et al., 2024). To understand these impacts, it is essential to investigate both the trophic relationships within communities and how local drivers, such as land-use intensification, disrupt them (Lobón-Cerviá et al., 2016). Therefore, analyzing the variation in trophic structures across large spatial scales and testing the generality of existing predictions are vital for building a robust understanding of land-use effects on aquatic food webs.
Through a literature review, this study assesses the effects of land use on the trophic network structure of Brazilian stream fish assemblages. We specifically address the following questions: (a) How is the structure of fish trophic networks related to the degree of land-use change? (b) Which major land-use class, pasture or cropland, has a greater effect on trophic network structure? We hypothesize that well-vegetated sites enhance the availability and diversity of food resources (e.g., through allochthonous inputs), promoting greater trophic specialization, higher connectance (i.e., a high proportion of realized links), and resulting in more modular and less nested networks (Fig. 1). Conversely, we expect deforested sites under intensive land use to support less specialized fish assemblages with fewer trophic links, lower connectance, and a more nested network structure.
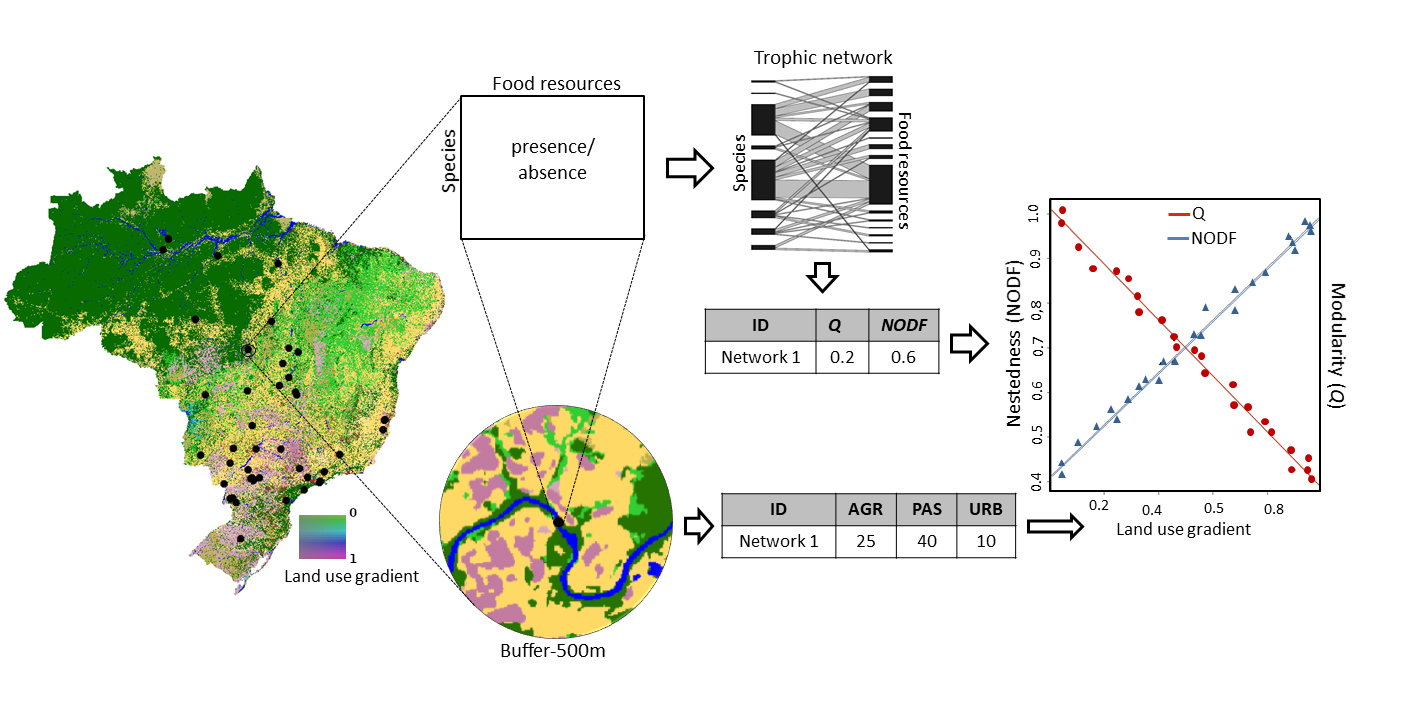
FIGURE 1| Sampling and analytical procedure for trophic networks. For each study region, we quantified land use within a 500 meter radius buffer, using data from the specific year the study was conducted. Dietary data were then used to construct a bipartite trophic network for each study. For each network, we calculated metrics of modularity, nestedness, trophic specialization, and food-web complexity, including number of species, link density, and mean number of links per species.
Material and methods
Data sampling. We conducted a systematic literature review following the PRISMA guidelines to identify articles published between 1982 and 2021, sourced from Scopus, Web of Science, and Google Scholar. As this study exclusively involved the synthesis of previously published data, it did not require approval from an Ethics Committee or collection licenses. Our search focused on studies examining the diet of stream fish assemblages in Brazil. We used a combination of keywords in both English and Portuguese: (fish*) AND (feed* OR diet* OR trophic*) AND (stream*) AND (Brazil*) AND (community OR assembly*). We also included relevant theses and gray literature that met the same criteria (n = 18). This initial search returned 20,200 studies. After screening titles and abstracts, we excluded 19,850 publications due to low relevance to our research objectives. The remaining 350 articles underwent full-text assessment against the following eligibility criteria: (i) inclusion of at least five fish species, (ii) presentation of quantitative dietary data (e.g., IAi, % volume, % number), (iii) availability of a complete trophic matrix, and (iv) conduct within a stream ecosystem. We applied a threshold of five species to ensure the data represented a local community network. Although there is no definitive minimum for an assemblage, five is below the typical mean of seven fish species found in Brazilian headwater streams (Dias et al., 2021). Furthermore, we required studies to quantify diets using established metrics (IAi and/or numeric/volume percentages) to ensure a comprehensive characterization of species’ feeding habits, rather than relying on occasional observations (Bonato et al., 2012; Peressin et al., 2018; Santos et al., 2021; Caldatto et al., 2023). This process, summarized in Tab. S1, led to the exclusion of 301 studies, resulting in a final compilation of 49 trophic networks from across Brazil.
From each study, we extracted dietary matrices (with food items as rows and fish species as columns). The food items encompassed various taxa, including terrestrial and aquatic insects, algae, plant material, crustaceans, and mollusks. To mitigate biases arising from differing sampling efforts and quantification methods across studies, we converted all matrices to a presence/absence (binary) format. This approach allows the analysis to focus on the incidence of trophic interactions rather than their relative strength.
Network metrics. We constructed bipartite networks where nodes represent two distinct sets of trophic components: fish (consumers) and food items (resources). Links between nodes represent trophic interactions, specifically, the consumption of particular food items by each fish species (Dormann, Strauss, 2014). From each interaction matrix, we quantified several network metrics, including nestedness, modularity, connectance, trophic specialization, number of links, and the mean number of links per consumer. In addition, we reported fish species richness, the number of consumer species, not as a structural network metric, but as a descriptor of the local fish assemblage. Nestedness was quantified using the NODF metric, a widely used measure based on the principles of niche overlap and the decreasing fill of the adjacency matrix (Almeida-Neto et al., 2008). In this context, niche overlap refers to the degree to which two or more species share the same food items, such that the diets of specialists tend to form subsets of those of generalist species. Higher NODF values thus indicate a more nested network structure. Modularity was assessed using the Q metric, which measures the difference between the observed fraction of links connecting species within the same module and the fraction expected by chance (Newman, 2006). Since the food webs in this study were structured as bipartite networks (i.e., links only occur between nodes of different sets), we used a Q algorithm adapted for bipartite networks which is a modularity detection method specifically designed for this structure (Dormann, Strauss, 2014). A modular network consists of interconnected modules, each comprising a group of species that are more tightly linked to one another than to species in other modules (e.g., Olesen et al., 2007). We used connectance as a measure of food web complexity, defined as the proportion of realized links out of all possible links in a network (Dunne et al., 2002a).
Trophic specialization was quantified using the H2’ index, which measures the deviation of observed interactions from the number expected if all interactions were random. Derived from the Shannon diversity index, H2’ is a standardized measure for comparing specialization across different networks, ranging from 0 (no specialization, high generalization) to 1 (complete specialization) (Blüthgen et al., 2006). The metric is calculated by comparing observed and expected interaction frequencies based on species marginal totals. As H2’ is based on interaction frequencies, it was the only metric we calculated using the relative abundance of consumed items (i.e., interaction strength). For example, a species might feed exclusively on one particular food item. However, if that item is highly abundant and consumed by many species, the degree of specialization for that consumer would be considered low, resulting in a low H2’ value. Conversely, a species feeding exclusively on rare food items would receive a high H2’ value. In summary, the greater the overall selectivity of species within the network, the higher the network’s H2’ index.
Link density was calculated as the ratio of the total number of observed trophic links (L) to the total number of nodes (S), encompassing both consumers and resources. This metric (L/S) reflects the overall complexity of the network and the number of potential energy pathways (Dunne et al., 2002a). We also calculated the mean number of links per consumer, representing the average number of food items consumed by each fish species (Bersier et al., 1999; Dunne et al., 2002b). While both metrics describe network connectivity, link density captures the complexity of the entire network, whereas the mean number of links per consumer specifically measures the average dietary breadth at the consumer level.
We calculated network completeness for each food web, defined as the proportion of realized interactions to the total number of potential interactions (i.e., the number of observed interactions divided by the product of the number of consumers and resources; Ceron et al., 2019). This metric was included as a covariate in subsequent models because many network descriptors can be influenced by differences in network size and sampling effort (Henriksen et al., 2019; Blüthgen, Staab, 2024). In dietary studies, trophic interactions are identified via stereomicroscope in the laboratory, which minimized the likelihood of missing prey items. While it is possible that some prey consumed in nature were not detected, we expect any such underestimation to be minor as trophic studies typically analyze multiple individuals per species (>10) to capture the full dietary range. Consequently, we are confident that unobserved interactions constitute only a negligible source of bias in our networks.
Null model of trophic network structure. To control for potential sampling bias related to network dimensions (i.e., the number of species and trophic links), which can hinder direct comparisons of metrics across networks, we compared three key observed descriptors (NODF, Q, and H2’) to distributions generated by null models. We used a null model that randomizes the observed interaction matrix while preserving its fundamental structure (Quimbayo et al., 2018; Dáttilo, Vasconcelos, 2019; Kortsch et al., 2019). Specifically, we randomized each observed trophic network 499 times using the ‘swap.web’ null model, as implemented in the R package bipartite (Dormann et al., 2009). This method fixes both marginal totals and connectivity, thereby maintaining a constant number of interactions. This 499-permutation approach, plus the one observed matrix (yielding n = 500), significantly reduces computational time for metrics like Q while achieving a minimum non-zero p-value of 0.002, which is sufficiently precise for standard significance thresholds (e.g., p < 0.05). For each network metric (NODF, Q, and H2’), we then quantified its Standardized Effect Size (SES) using the formula: SES = (observed – μ) / σ, where ‘observed’ is the metric’s value from the empirical network, μ is the mean of the metric across all 499 null matrices, and σ is the standard deviation. A negative SES indicates the observed value is lower than expected given the network’s size and connectance, while a positive SES indicates it is higher.
Anthropogenic impact on streams. Since the precise geographical coordinates for each sampling site were not always available in the published papers or gray literature, we used the mean geographical coordinates of each study to quantify anthropogenic impact by calculating the land use within individual study areas. In this approach, we created a buffer with a 500 m radius around the mean geographical coordinates of each study. Using ArcMap 10.6.1 (ESRI, 2018), we then calculated the percentage area of each land-use class within these buffers (Fig. 1). The methods for characterizing aquatic impacts through buffers vary considerably across studies, ranging from circular to riparian buffers of 50 to 500 m (Brejão et al., 2021; Pessoa et al., 2025). Although a 100 m buffer is most common (Brejão et al., 2021; Pessoa et al., 2025), we selected a 500 m circular buffer because it simultaneously captures both local and regional scale changes and potentially includes multiple sampling sites from each study. Moreover, this buffer size is also sufficient to address major land-use variations across different Brazilian biomes. Therefore, this radius was appropriate for characterizing the overall land use in each study region, and to capture both riparian and catchment-scale influences while ensuring comparability among the different studies.
We obtained land-use data from the Brazilian Annual Land Use and Land Cover Mapping Project (MapBiomas, Collection 4.1). This project generates annual digital maps of land use for Brazil at a 30 m pixel resolution. The maps are produced using random forest and machine learning algorithms applied to Landsat satellite imagery from 1985 to present. For each study in our dataset, we extracted the MapBiomas land-use layer corresponding to its specific reported sampling year. However, for one sample from 1982 and another from 2019, years for which MapBiomas data were unavailable during our GIS processing, we used the closest available data in the time series (1985 and 2018, respectively). The 18 original land-use and land-cover classes found at the evaluated sites were consolidated into two broad categories: natural and non-natural land cover. The natural land cover category included forest formation, savanna formation, mangrove, wetland, grassland, salt flat, rocky outcrop, and other non-forest natural formations (e.g., beach and dune, river, lake, and ocean). The non-natural land cover category, representing anthropogenic impact, encompassed forest plantation, pasture, annual and perennial crops, semi-perennial crops (e.g., sugarcane), mosaic of cropland and pasture, urban infrastructure, mining, and other non-vegetated areas. Using these categories, we established a land-use gradient across the studies based on the percentage cover of non-natural classes, ranging from completely natural to highly modified landscapes. Following this broad classification, we also evaluated croplands and pastures individually, as they are the most prevalent land-use types in Brazil. The “croplands” variable was represented by the sum of all agricultural classes (annual, perennial, and semi-perennial crops), while the “pasture” variable included only the pasture class. This approach allowed us to assess the individual effects of these two dominant land-use types on trophic networks.
Stream covariates. Since network metrics can be influenced by watercourse and environmental properties, we used the mean geographical coordinates of the studies to extract key stream variables. From the HydroRIVERS dataset (hydrosheds.org/products/hydrorivers), we obtained the Strahler stream order (range: 1–10), the surface area of the upstream catchment (1–70 km2; log10-transformed), and the distance from the headwaters (2.4–4,700 km; log10-transformed). We also extracted the elevation for each study location from the CGIAR-SRTM (90 m resolution) as a proxy for habitat heterogeneity. To represent climatic conditions, we extracted data for all 19 bioclimatic variables from WorldClim (v. 2.1) for each study. All environmental and climatic predictors were centered (mean of zero) and scaled (standard deviation of one) before being used in a Principal Component Analysis (PCA). The first three orthogonal axes of the PCA captured 78% of the total variance (48%, 18%, and 12%, respectively). The PCA loadings revealed the following patterns: PC1 positively represents high and stable temperatures, as well as a greater distance from headwaters; PC2 is positively associated with variable precipitation and temperature levels and higher elevation, but negatively associated with high precipitation levels; PC3 is positively related to temperature and negatively related to precipitation seasonality. These three PCA axes were used as environmental covariates in subsequent models to control their potential effects on trophic network metrics.
Linear models. We constructed linear regression models to assess how a broad land-use gradient influences seven trophic network metrics. The predictor variables were the proportional area of anthropogenic land use, cropland, and pasture. The response variables included the Standardized Effect Size (SES) for three metrics (NODF, Q, and H2’). For the remaining four metrics, Connectance, Link Density, Mean Number of Links per Species, and Number of Fish Species (Log10-transformed), SES values were either not applicable or could not be compared via null models. To ensure all response variables were on a comparable scale for analysis, we rescaled these four metrics to have a mean of zero and a standard deviation of one across all observed values. This standardization allows for direct comparison of model coefficients across different metrics. The final models thus evaluated the influence of land use on NODFSES, QSES, H2’SES, Connectance, Link Density, Mean Number of Links per Species, and Fish Species Richness (Fig. 1).
We also employed multiple linear regressions with the same set of response variables to evaluate the individual effects of cropland and pasture on each network metric. This approach allowed us to decompose the broad land-use gradient into its two most prevalent components in Brazil and interpret their distinct influences as separate drivers of network structure. Network completeness was included as a covariate in all multiple regression models, except for those with connectance as the response variable, due to high collinearity between the two metrics. This allowed us to assess whether variation in network structure, such as modularity, nestedness, and link density, was influenced by differences in network size. Variance Inflation Factor (VIF) values for cropland, pasture, network completeness, and the three principal component (PC) axes were low (ranging from 1.19 to 1.73), indicating no significant multicollinearity and supporting their simultaneous inclusion as independent predictors in the multiple regression models. We assessed the normality of model residuals using the Shapiro-Wilk test, which indicated that most models met the normality assumption. To further satisfy model assumptions, we identified outliers based on high Cook’s distance values and iteratively removed the most influential observations. This procedure substantially improved normality in the model residuals. Finally, using the mean geographic coordinates of studies, we tested for spatial autocorrelation in the residuals of all models using Moran’s I. No significant positive spatial autocorrelation was detected in any model, and the corresponding Moran’s I values are reported in the summary tables (see Results).
All analyses were performed in R v.4.4.2 (R Development Core Team, 2024). We used the bipartite package (Dormann et al., 2009) to compute network metrics, specifically employing the networklevel, nested, and metaComputeModules functions. The complete code and analytical procedures are available in the GitHub repository at: https://github.com/msversutdias/Nuven-et-al_Trophic-networks.git.
Results
Overall, we documented 24,214 trophic interactions among 583 fish species and 185 distinct food items, primarily consisting of invertebrates, plant material, detritus, and algae (Tab. S3). At the local scale, the number of fish species per study ranged from 5 to 99 (mean ± SD: 20.93 ± 20.04), while the number of consumed food items varied from 5 to 58 (15.55 ± 10.62). Land use analysis within the 500 m buffer surrounding studies revealed a greater proportion of pasture (19.81% ± 28.72%), followed by cropland (14.73% ± 27.81%; Tab. S2). In general, the networks exhibited higher nestedness (0.33 ± 0.13) than modularity (0.24 ± 0.11), along with high levels of trophic specialization (0.59 ± 0.16; Tab. S4). Connectance varied widely across networks, ranging from 0.17 to 0.85 (mean ± SD: 0.47 ± 0.15). Simple correlation analyses among response metrics indicated that highly nested networks tended to display lower modularity, reduced specialization, and higher completeness (Tab. S5).
Contrary to our expectations, we found no significant effects of land use on QSES, H2’SES, connectance, fish species richness, or link density (Tab. 1; Figs. 2B–E, G). We observed weak, non-significant trends: a negative relationship with NODFSES and a positive relationship with the mean number of links per species (Tab. 1; Figs. 2A, F). Matrix completeness was a significant predictor of NODFSES, while environmental covariates related to habitat and climate were the primary drivers of several network metrics. For example, rivers located farther from their headwaters, in lowland areas with higher temperatures (i.e., positive PC1_environ scores), were characterized by higher species richness, higher link density, greater trophic specialization, and lower connectance.
TABLE 1 | Linear regression coefficients for the relationships between the land-use gradient and trophic network descriptors: nestedness (NODFSES), modularity (QSES), specialization (H2,SES), connectance, link density, mean number of links per species, and number of fish species. The number of fish species was log10[x + 1] transformed. All models, except for connectance, included network completeness as a covariate to control for its potential influence on network metrics. The three Principal Component (PC) axes represent the primary environmental gradients derived from stream properties (Strahler order, distance from headwaters, and drainage area) and 19 bioclimatic variables. Moran’s I values confirm no significant spatial autocorrelation in the model residuals. §0.05 < p < 0.10; *p < 0.05; **p < 0.01.
| NODFses | Qses | H2, ses | Connectance | Link_density | MeanNumberLinks | Number of Species | |||||||
Predictors | Estimates | p | Estimates | p | Estimates | p | Estimates | p | Estimates | p | Estimates | p | Estimates | p |
Intercept | -5.81 | <0.01** | 2.83 | <0.01** | -2.68 | 0.17 | -0.07 | 0.76 | -0.82 | 0.12 | -0.26 | 0.62 | -0.36 | 0.42 |
Land-use index | -0.03 | 0.09§ | -0.00 | 0.65 | 0.01 | 0.54 | 0.00 | 0.73 | 0.00 | 0.73 | 0.01 | 0.07§ | 0.00 | 0.86 |
Matrix completeness | -20.70 | <0.01** | -2.76 | 0.11 | 5.65 | 0.14 | – | – | 1.67 | 0.12 | -0.20 | 0.84 | 0.71 | 0.41 |
PC1_environ | -0.28 | 0.14 | 0.14 | 0.12 | 0.55 | 0.01* | -0.08 | 0.08§ | 0.12 | 0.02* | -0.07 | 0.19 | 0.18 | <0.01** |
PC2_environ | 0.50 | 0.09§ | -0.27 | 0.04* | -0.35 | 0.20 | -0.03 | 0.69 | 0.02 | 0.82 | -0.12 | 0.12 | -0.02 | 0.75 |
PC3_environ | 0.57 | 0.12 | 0.01 | 0.94 | 0.46 | 0.17 | -0.20 | 0.03* | -0.18 | 0.06§ | -0.04 | 0.69 | -0.12 | 0.16 |
Observations | 48 | 48 | 43 | 47 | 46 | 45 | 49 | |||||||
R2 / R2 adjusted | 0.51 / 0.45 | 0.27 / 0.18 | 0.26 / 0.16 | 0.21 / 0.13 | 0.23 / 0.14 | 0.23 / 0.13 | 0.37 / 0.30 | |||||||
Moran’s I | -0.05 | -0.01 | 0.01 | -0.05 | -0.01 | -0.01 | -0.02 | |||||||
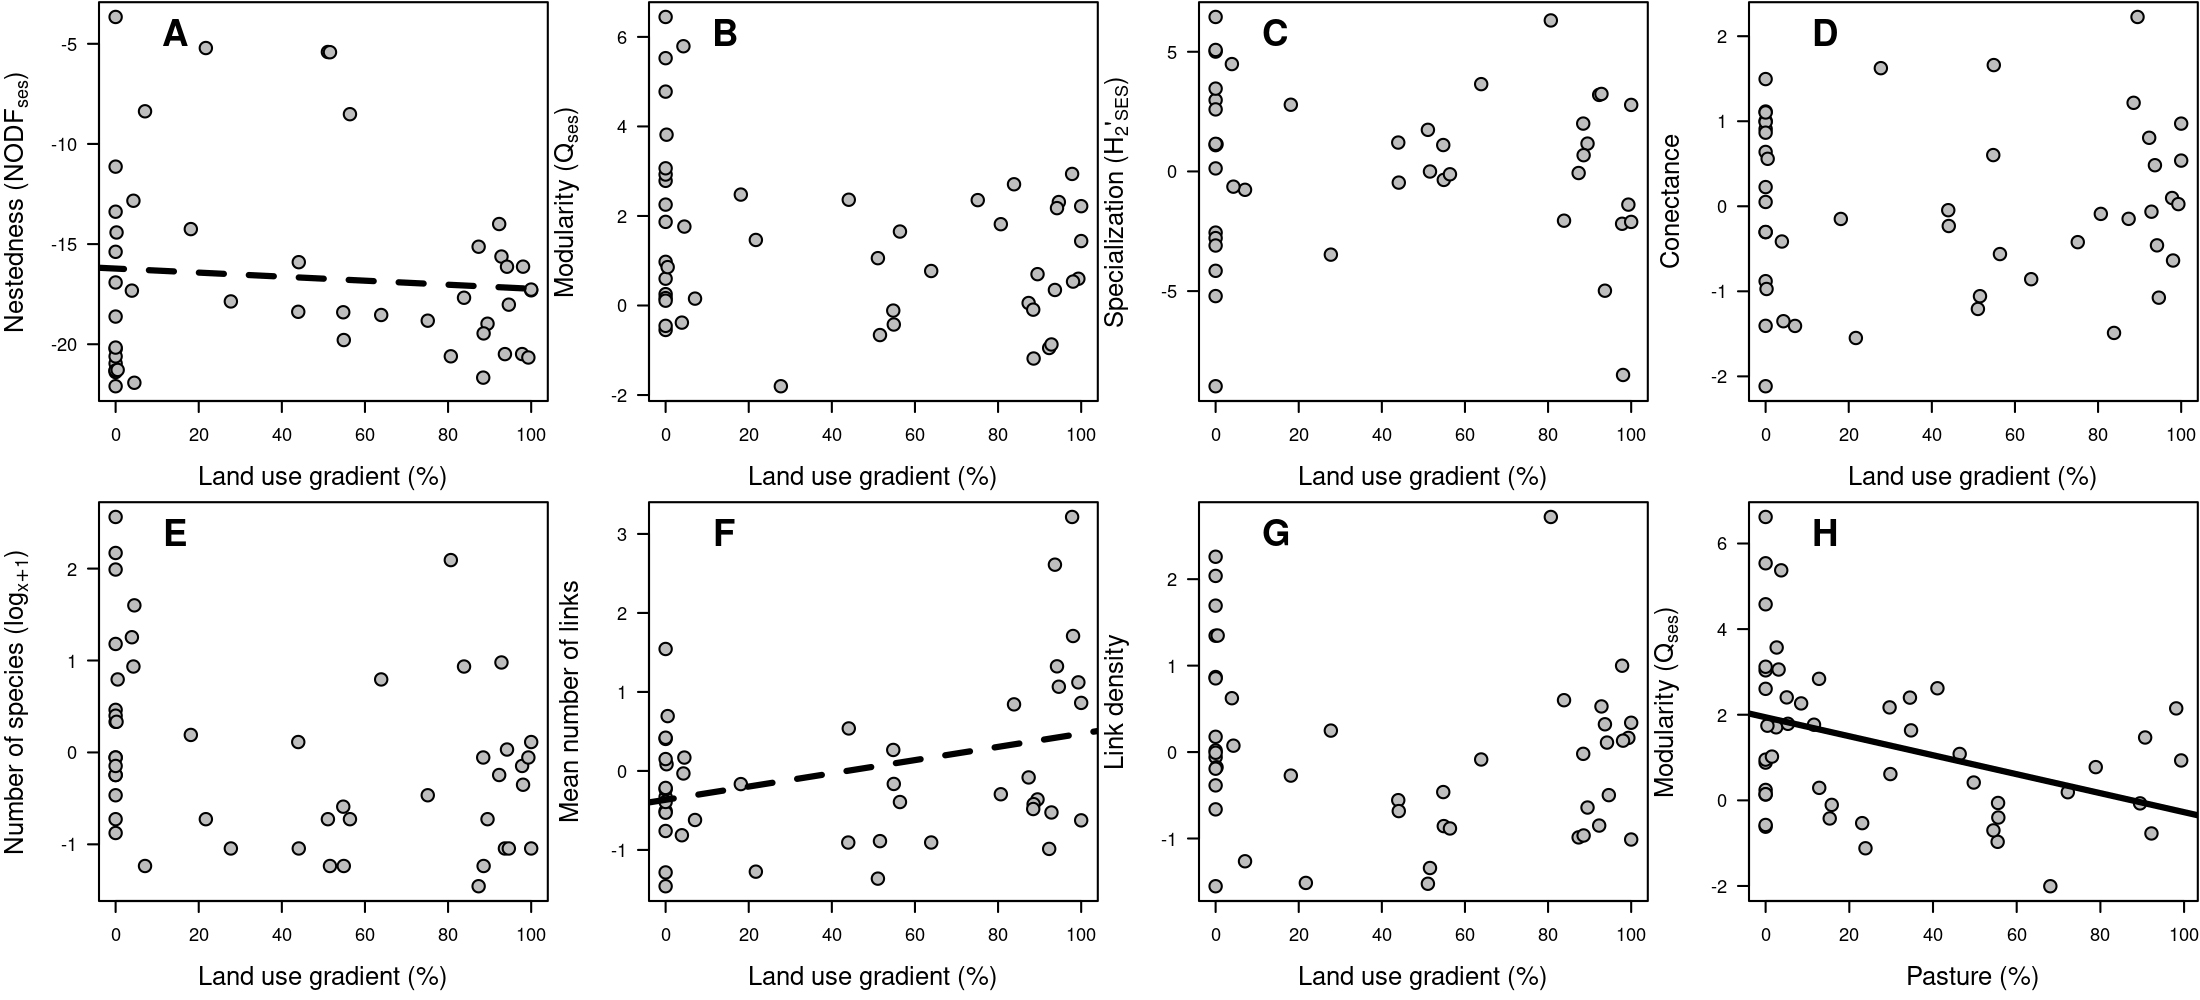
FIGURE 2| Relationships between the anthropogenic land-use gradient (within a 500 m buffer of each study) and key trophic network descriptors: A) Nestedness (NODFSES), B) Modularity (QSES), C) Trophic specialization (H2’SES), D) Connectance, E) Number of fish species (log10[x + 1], F) Mean number of links per species, and G) Link density. Panel H) shows the linear relationship between modularity and the percentage of pasture. Each point represents an independent fish trophic network from a sampling study. The land-use gradient, derived from MapBiomas land-cover data, ranges from 0 (fully natural) to 1 (fully anthropogenic). Continuous and dashed lines indicate significant (p < 0.05) and marginally significant (0.05 < p < 0.10) trends, respectively. Corresponding linear coefficients are provided in Tabs. 1–2.
When we differentiated land use into its two main categories, pasture and cropland, we found that the percentage of pasture had a significant negative effect on QSES (Fig. 2G). No other significant effects of pasture or cropland were detected on the remaining network metrics (Tab. 2). Network completeness negatively influenced both NODFSES and QSES, but had a positive effect on link density (Tab. 2). The environmental gradient represented by PC1 exhibited effects consistent with those described in previous models. Finally, no spatial autocorrelation was detected in the residuals of any model (Tab. 2).
TABLE 2 | Regression coefficients for the effects of two land-use variables (% cropland and % pasture) on trophic network structure: nestedness (NODFSES), modularity (QSES), specialization (H2’SES), connectance, mean number of links per species, link density, and fish species richness. Network completeness was included as a covariate in all models except those with connectance to control for its potential influence on network metrics. The three Principal Component (PC) axes represent environmental gradients derived from stream properties (Strahler order, distance from headwaters, and drainage area) and 19 bioclimatic predictors. Moran’s I values indicate no significant spatial autocorrelation in model residuals. §0.05 < p 0.10; *p < 0.05; **p < 0.01.
| NODFSES | QSES | H2,SES | Connectance | Link density | Mean Number Links | Number of Species | |||||||
Predictors | Estimates | p | Estimates | p | Estimates | p | Estimates | p | Estimates | p | Estimates | p | Estimates | p |
Intercept | -6.19 | <0.01** | 3.28 | <0.01** | -1.23 | 0.57 | -0.08 | 0.74 | -1.01 | 0.03* | -0.13 | 0.82 | -0.28 | 0.55 |
Cropland | -0.03 | 0.22 | 0.01 | 0.57 | -0.00 | 0.97 | 0.00 | 0.69 | 0.00 | 0.58 | 0.01 | 0.16 | 0.00 | 0.82 |
Pasture | -0.01 | 0.49 | -0.02 | 0.04* | 0.01 | 0.46 | 0.00 | 0.83 | -0.00 | 0.51 | 0.00 | 0.63 | -0.00 | 0.68 |
Matrix completeness | -20.12 | <0.01** | -3.40 | 0.04* | 2.10 | 0.61 | – | – | 2.15 | 0.02* | -0.24 | 0.82 | 0.64 | 0.46 |
PC1_environ | -0.27 | 0.20 | 0.16 | 0.08§ | 0.43 | 0.05* | -0.08 | 0.13 | 0.16 | <0.01** | -0.06 | 0.32 | 0.18 | <0.01** |
PC2_environ | 0.25 | 0.39 | -0.19 | 0.13 | -0.44 | 0.14 | -0.02 | 0.74 | 0.05 | 0.49 | -0.09 | 0.28 | -0.01 | 0.93 |
PC3_environ | 0.45 | 0.24 | -0.02 | 0.89 | 0.41 | 0.29 | -0.21 | 0.03* | -0.14 | 0.11 | -0.05 | 0.65 | -0.11 | 0.19 |
Observations | 49 | 48 | 42 | 47 | 48 | 44 | 49 | |||||||
R2/R2 adjusted | 0.47 / 0.40 | 0.36 / 0.27 | 0.22 / 0.08 | 0.21 / 0.11 | 0.39 / 0.30 | 0.18 / 0.05 | 0.38 / 0.29 | |||||||
Moran’s I | -0.06 | -0.03 | -0.01 | -0.06 | -0.04 | -0.03 | 0.03 | |||||||
Discussion
MOur study revealed that fish trophic networks in Brazilian streams are generally more nested than modular, exhibiting high trophic specialization but little response to overall land-use intensity. However, when analyzed by specific land-use type, pasture cover negatively affected modularity, whereas cropland had no measurable effect. These findings indicate that while broad habitat degradation does not strongly alter overall network structure, the expansion of pasture cover simplifies trophic organization.
In natural stream ecosystems, trophic networks are often modular, and nested structures typically emerging within submodules or trophic guilds with large-bodied species frequently acting as specialists, while smaller ones function as generalists (Severo-Neto et al., 2024). The levels of nestedness, modularity, and specialization we observed are comparable to those documented in semi-arid Brazilian streams, where hydrological seasonality is a key determinant of trophic interactions (Gonçalves-Silva et al., 2026). Although our study did not examine intra-guild modules, individual predator traits, or seasonal variation, these factors likely contributed to the high variability in network metrics we recorded (Fig. 2), even among streams with minimal anthropogenic influence. This inherent variability may, in turn, explain the relatively few significant effects of land use we detected.
Our regional study reveals that, unlike in marine and other ecosystems where anthropogenic gradients strongly influence trophic network structure (e.g., Peterson et al., 2017; Kortsch et al., 2019), the metrics of stream fish trophic networks in Brazil are not modulated by the overall land-use intensity. Studies involving other animal groups, such as ant-plant interactions, avian flocks, and seed-dispersal organisms, have demonstrated that network structures become simplified under intense disturbance regimes (Mokross et al., 2014; Sebastián-González et al., 2015; Pellissier et al., 2018; Lara et al., 2020). Although based in a marine environment, Kortsch et al. (2019) showed that multiple food-web metrics can vary predictably along environmental gradients such as temperature, sea ice, and habitat heterogeneity. We recognize that marine ecosystems differ from freshwater streams in many respects, including connectivity, dispersal, and habitat structure, yet this demonstrates that environmental filtering can drive systematic changes in trophic network structure across aquatic landscapes. Previous studies have assessed the effects of environmental gradients on network topology in other groups and concluded that these are largely due to changes in species composition and the relative abundances of consumers (Tylianakis, Morris, 2017; Pellissier et al., 2018). However, turnover in consumer species composition (i.e., of fish) was not within the scope of our study and should be addressed in future research.
The absence of broad land-use effects on network metrics was unexpected and contrary to our initial hypotheses. Alterations in surrounding terrestrial environments typically reduce microhabitat heterogeneity, increase siltation, and modify the physical and chemical water conditions (Casatti et al., 2006; Nessimian et al., 2008; Almada et al., 2019). Such habitat changes generally simplify fish assemblages by excluding specialist species, leading to a greater proportion of generalists (Winemiller, 1990; Thompson, Townsend, 2005; Dala-Corte et al., 2017; Arantes et al., 2018) or forcing species to broaden their trophic niches by consuming less preferred resources like detritus and plant material. Shifts in prey availability can indeed cause significant trophic network rewiring, as demonstrated in anuran food webs (Ceron et al., 2022). The lack of significant effects may also be related to the composite land-use index employed here, which aggregates multiple anthropogenic cover classes. This broad-scale index may obscure fine-scale, in-stream impacts such as localized siltation and microhabitat loss. Furthermore, while the buffer size used is relevant for assessing fish diversity (Pessoa et al., 2025), its specific dimensions and shape may not have fully captured the in-stream habitat modifications driving network structure, potentially contributing to the absence of observed effects.
Nevertheless, our results for stream fish trophic networks revealed a clear reduction in modularity associated with a high percentage of pasture cover in adjacent areas. In contrast, the percentage of croplands was unrelated to any network metrics. This aligns with previous studies linking farming practices to local reductions in fish species richness and simplified aquatic trophic networks (Bonato et al., 2012; Zeni, Casatti, 2014; Santos et al., 2015). Under natural conditions, riparian vegetation supplies allochthonous material (e.g., fruits, leaves, and insects) and increases the physical heterogeneity of the stream channel, thereby creating diverse feeding habitats (e.g., Nuven et al., 2022). Pasture and cropland expansion typically reduces this native vegetation, consequently decreasing the input of terrestrial insects and plant material for various trophic groups (Zeni, Casatti, 2014; Manoel, Uieda, 2018). As a result, fish in these agricultural landscapes increasingly consume low-protein, indigestible foods such as detritus, sediments, and organic matter (Dala-Corte et al., 2016). This dietary shift reflects the ability of opportunistic species to adapt to changes in resource availability, particularly toward low-quality food items (Ferreira et al., 2012; Dala-Corte et al., 2017).
Under degraded conditions, detritus and fine organic matter likely play a crucial role in these trophic networks. In open, pasture-dominated streams, increased sedimentation and primary production can enhance the availability of detritus and its microbial processing. This mechanism sustains generalist consumers and buffers against food-web collapse (Moore et al., 2004), which could explain the overall stability of other network metrics in impacted sites, as observed here. From a macroecological perspective, this stability may also stem from the high diversity and functional redundancy of tropical stream assemblages (Toussaint et al., 2016), where numerous trophic links and overlapping resource pathways foster resilience to perturbation (Mouillot et al., 2011). Such complex networks can absorb environmental variation through redundant feeding pathways (Rooney et al., 2006; Pellissier et al., 2018). Furthermore, while shifts in resource availability and habitat structure negatively affect specialist groups like terrestrial insectivores and herbivores (Zeni, Casatti, 2014), a few resilient consumer species from distinct trophic groups (e.g., characins, catfishes, cichlids, and poeciliids) often persist even under severe disturbance (Casatti et al., 2012). Consequently, some network metrics may remain relatively stable because the overall structure undergoes partial simplification rather than deep reorganization or collapse. Finally, the effects of land use are highly variable and context-dependent (Camana et al., 2024), likely influenced by historical patterns of land conversion (Brejão et al., 2018). Although not explicitly addressed in our study, these factors represent important avenues for future research to refine our understanding of trophic network dynamics.
Network completeness significantly influenced the structural properties of the fish trophic networks, exhibiting a negative relationship with both nestedness and modularity, but a positive relationship with link density. This pattern indicates that a higher matrix fill, resulting from greater sampling effort of consumers and/or more precise identification of food items, tends to reveal more complex network structures. This sensitivity of network topology to sampling and construction methods is well-documented (Brimacombe et al., 2023), reinforcing the need to explicitly account for completeness in comparative analyses (Rivera-Hutinel, et al., 2012; Jordano, 2016). While multiple approaches exist to enhance comparability between networks (Pellissier et al., 2018; Blüthgen, Staab, 2024), we adopted two key strategies: the use of null models (Blüthgen, Staab, 2024) and the inclusion of network completeness as a covariate in all our statistical models to control for its effects. Our results demonstrate that these are crucial steps for minimizing biased ecological interpretations.
Future studies could build upon this work in several key areas. While our literature search was thorough, it is possible that some relevant trophic matrices were missed, and our dataset represents a fixed snapshot in time. We acknowledge this limitation and have made all trophic matrices fully available to facilitate future updates and refinements (see Material and Methods for data and code repository). A potential criticism is the lack of standardization in the taxonomic resolution of food items, as we retained the original classifications from each source study. While this heterogeneity could affect the direct comparability of certain metrics, such as nestedness and modularity, it also reflects the genuine ecological and methodological diversity of research across Brazilian freshwater ecosystems. The null models employed in our analysis are designed to mitigate this bias, as each network metric is compared against its own null distribution when calculating standardized effect sizes. This approach improves comparability across a broad range of environments, dietary strategies, and data sources, thereby enhancing the ecological representativeness of our synthesis. Furthermore, key local environmental features, such as stream width, depth, discharge, substrate heterogeneity, and season, are known drivers of food-web structure (Wang et al., 2022). However, these variables were inconsistently reported or entirely absent in the source studies, preventing their inclusion as covariates. To partially account for large-scale spatial variation, we instead incorporated broad stream and climatic metrics (i.e., PCAs), whose effects were successfully captured in our models (Tabs. 1–2). We strongly emphasize the importance of integrating these finer-scale environmental descriptors in future research to better elucidate their influence on network structure and its response to land-use change.
In conclusion, our study demonstrates that land-use change in Brazilian streams induces minor, but measurable shifts in food-web structure. We identified a specific trend toward simplification in pasture-dominated watersheds, resulting in less complex and modular trophic networks. These findings underscore the critical role of natural cover and riparian vegetation in maintaining the trophic structure of fish communities. Given that this structure responds predictably to pasture coverage, even partial landscape restoration could enhance the complexity of these aquatic systems. Future research should focus on quantifying variables at a finer scale to uncover more subtle effects. Key factors include the intensity and history of land use, the spatial configuration of native vegetation fragments, and local environmental conditions such as organic matter input and limnological characteristics. Integrating these elements will provide a deeper understanding of how the removal of native and riparian forests shapes trophic networks.
Acknowledgments
We thank all researchers who have made their data available online; A. Campelo, A. Braga and L. Ribeiro for help in searching for data; F.V. Costa and T. Oberdorff for carefully reading preliminary versions of this manuscript; M. Cantor for insightful comments in one of the statistical analyses; and the Limnology Lab for logistical support.
References
Almada HKS, Silvério DV, Macedo MN, Maracahipes-Santos L, Zaratim ECP, Zaratim KP et al. Effects of geomorphology and land use on stream water quality in southeastern Amazonia. Hydrol Sci J. 2019; 64(5):620–32. https://doi.org/10.1080/02626667.2019.1587563
Almeida-Neto M, Guimarães P, Guimarães Jr. PR, Loyola RD, Ulrich W. A consistent metric for nestedness analysis in ecological systems: reconciling concept and measurement. Oikos. 2008; 117(8):1227–39. https://doi.org/10.1111/j.0030-1299.2008.16644.x
Alonso MB, Carvalho DR, Alves CBM, Moreira MZ, Pompeu PS. Changes in trophic characteristics of two fish species of Astyanax (Teleostei: Characidae) in response to aquatic pollution. Zoologia. 2019; 36:1–12. https://doi.org/10.3897/zoologia.36.e30445
Amarillo-Suárez AR, Camacho-Erazo M, Herrera HW. Land use is a stronger determinant of ecological network complexity than the number of trophic levels. PLoS ONE. 2024; 19(2):e0295377. https://doi.org/10.1371/journal.pone.0295377
Arantes CC, Winemiller KO, Petrere M, Castello L, Hess LL, Freitas CEC. Relationships between forest cover and fish diversity in the Amazon River floodplain. J Appl Ecol. 2018; 55:386–95. https://doi.org/10.1111/1365-2664.12967
Bambi P, Tonin AM, Rezende RS, Vieira FC, Miranda FGG, Boyero L et al. The legacy of forest logging on organic matter inputs and storage in tropical streams. Biotropica. 2023; 55(1):40–52. https://doi.org/10.1111/btp.13155
Bartomeus I, Gravel D, Tylianakis JM, Aizen MA, Dickie IA, Bernard-Verdier M. A common framework for identifying linkage rules across different types of interactions. Funct Ecol. 2016; 30(12):1894–903. https://doi.org/10.1111/1365-2435.12666
Bascompte J, Jordano P, Melián CJ, Olesen JM. The nested assembly of plant-animal mutualistic networks. PNAS. 2003; 100(16):9383–87. https://doi.org/10.1073/pnas.1633576100
Baumgartner SD, Robinson CT. Changes in macroinvertebrate trophic structure along a land-use gradient within a lowland stream network. Aquat Sci. 2017; 79(2):407–18. https://doi.org/10.1007/s00027-016-0506-z
Bersier L, Dixon P, Sugihara G. Scale-invariant or scale-dependent behavior of the link density property in food webs: a matter of sampling effort? Am Nat. 1999; 153(6):676–82. https://doi.org/10.1086/303200
Blüthgen N, Menzel F, Blüthgen N. Measuring specialization in species interaction networks. BMC Ecol. 2006; 6:9. https://doi.org/10.1186/1472-6785-6-9
Blüthgen N, Staab M. A critical evaluation of network approaches for studying species interactions. Annu Rev Ecol Evol Syst. 2024; 55:65–88. https://doi.org/10.1146/annurev-ecolsys-102722-021904
Boccaletti S, Latora V, Moreno Y, Chavez M, Hwang D-U. Complex networks: Structure and dynamics. Phys Rep. 2006; 424(4):175–308. https://doi.org/10.1016/j.physrep.2005.10.009
Bonato KO, Delariva RL, Silva JC. Diet and trophic guilds of fish assemblages in two streams with different anthropic impacts in the northwest of Paraná, Brazil. Zoologia. 2012; 29(1):27–38. https://doi.org/10.1590/S1984-46702012000100004
Botella C, Gaüzère P, O’Connor L, Ohlmann M, Renaud J, Dou Y et al. Land-use intensity influences European tetrapod food webs. Glob Change Biol. 2024; 30(2):e17167. https://doi.org/10.1111/gcb.17167
Brejão GL, Hoeinghaus DJ, Pérez-Mayorga MA, Ferraz SFB, Casatti L. Threshold responses of Amazonian stream fishes to timing and extent of deforestation. Conserv Biol. 2018; 32(4):860–71. https://doi.org/10.1111/cobi.13061
Brejão GL, Leal CG, Gerhard P. A ecologia de peixes de riacho sob a perspectiva da ecologia de paisagens. Oecol Aust. 2021; 25(2):475–93. https://doi.org/10.4257/oeco.2021.2502.16
Brimacombe C, Bodner K, Michalska-Smith M, Poisot T, Fortin MJ. Shortcomings of reusing species interaction networks created by different sets of researchers. PLOS Biol. 2023; 21(4):e3002068. https://doi.org/10.1371/journal.pbio.3002068
Caldatto AM, Dias RM, Ferreira A. Diet of Moenkhausia bonita (Benine, Castro & Sabino 2004) (Characiformes: Characidae) in streams in the basin of rio Formoso, Brazilian Midwest. Biota Neotrop. 2023; 23(2):e20221388. https://doi.org/10.1590/1676-0611-BN-2022-1388
Camana M, Ortega JCG, Brejão GL, Melo AS, Dias MS, Becker FG. A global meta-analysis of the effects of land use on the diversity of stream fish and macroinvertebrates. Aquat Sci.2024; 86(3):86. https://doi.org/10.1007/s00027-024-01099-2
CaraDonna PJ, Burkle LA, Schwarz B, Resasco J, Knight TM, Benadi G et al. Seeing through the static: the temporal dimension of plant–animal mutualistic interactions. Ecol Lett. 2021; 24(1):149–61. https://doi.org/10.1111/ele.13623
Carvalho DR, Castro DMP, Callisto M, Chaves AJM, Moreira MZ, Pompeu PS. Stable isotopes and stomach content analyses indicate omnivorous habits and opportunistic feeding behavior of an invasive fish. Aquat Ecol. 2019; 53(3):365–81. https://doi.org/10.1007/s10452-019-09695-3
Casatti L, Langeani F, Ferreira CP. Effects of physical habitat degradation on the stream fish assemblage structure in a pasture region. Environ Manage. 2006; 38(6):974–82. https://doi.org/10.1007/s00267-005-0212-4
Casatti L, Teresa FB, Gonçalves-Souza T, Bessa E, Manzotti AR, Gonçalves CD et al. From forests to cattail: how does the riparian zone influence stream fish? Neotrop Ichthyol. 2012; 10(1):205–14. https://doi.org/10.1590/S1679-62252012000100020
Ceron K, Oliveira-Santos LG, Souza CS, Mesquita DO, Caldas FL, Araujo AC et al. Global patterns in anuran–prey networks: structure mediated by latitude. Oikos. 2019; 128(11):1537–48. https://doi.org/10.1111/oik.0662
Ceron K, Provete DB, Pires MM, Araujo AC, Blüthgen N, Santana DJ. Differences in prey availability across space and time lead to interaction rewiring and reshape a predator–prey metaweb. Ecology. 2022; 103(8):e3716. https://doi.org/10.1002/ecy.3716
Cohen R, Havlin S. Complex networks: structure, robustness and function. Cambridge: Cambridge University Press. 2010. https://doi.org/10.1017/CBO9780511780356
Dala-Corte RB, Becker FG, Melo AS. The importance of metacommunity processes for long-term turnover of riffle-dwelling fish assemblages depends on spatial position within a dendritic network. Can J Fish Aquat Sci. 2017; 74(1):101–15. https://doi.org/10.1139/cjfas-2016-0049
Dala-Corte RB, Giam X, Olden JD, Becker FG, Guimarães TF, Melo AS. Revealing the pathways by which agricultural land-use affects stream fish communities in South Brazilian grasslands. Freshw Biol. 2016; 61(11):1921–34. https://doi.org/10.1111/fwb.12825
Dalsgaard B, Trøjelsgaard K, González AMM, Nogués-Bravo D, Ollerton J, Petanidou T et al. Historical climate-change influences modularity and nestedness of pollination networks. Ecography. 2013; 36(12):1331–40. https://doi.org/10.1111/j.1600-0587.2013.00201.x
Dáttilo W, Vasconcelos HL. Macroecological patterns and correlates of ant–tree interaction networks in Neotropical savannas. Glob Ecol Biogeogr. 2019; 28(9):1283–94. https://doi.org/10.1111/geb.12932
Dias MS, Cassemiro FAS, Bailly D, Ribeiro LS, Cossignani EF, Graça WJ et al. Macroecologia de peixes de riachos brasileiros. Oecol Austr. 2021; 25(2):512–30. https://doi.org/10.4257/oeco.2021.2502.18
Dolabela BM, Costa FV, Pinto VD, Lopes I, Bezerra-Neto JF, Barbosa FAR et al. Forest-lake ecotones in a tropical forest: terrestrial invertebrate inputs to lakes decrease with forest distance. Freshw Biol. 2022; 67(6):1079–90. https://doi.org/10.1111/fwb.13902
Dormann CF, Frund J, Bluthgen N, Gruber B. Indices, graphs and null models: analyzing bipartite ecological networks. Open Ecol J. 2009; 2(1):7–24. https://doi.org/10.2174/1874213000902010007
Dormann CF, Strauss R. A method for detecting modules in quantitative bipartite networks. Methods Ecol Evol. 2014; 5(1):90–98. https://doi.org/10.1111/2041-210X.12139
Dunne JA, Williams RJ, Martinez ND. Food-web structure and network theory: the role of connectance and size. PNAS. 2002a; 99(20):12917–22. https://doi.org/10.1073/pnas.192407699
Dunne JA, Williams RJ, Martinez ND. Network structure and biodiversity loss in food webs: robustness increases with connectance. Ecol Lett. 2002b; 5(4):558–67. https://doi.org/10.1046/j.1461-0248.2002.00354.x
Effert-Fanta EL, Chow SL, Wahl DH. Effects of riparian forest and agricultural land use on stream fish diet and trophic position. Ecol Freshw Fish. 2023; 32(2):291–304. https://doi.org/10.1111/eff.12686
Environmental Systems Research Institute (ESRI). ArcMap 10.6.1. Redlands, CA: ESRI. 2018.
Felipe-Lucia MR, Soliveres S, Penone C, Fischer M, Ammer C, Boch S et al. Land-use intensity alters networks between biodiversity, ecosystem functions, and services. PNAS. 2020; 117(45):28140–49. https://doi.org/10.1073/pnas.2016210117
Ferreira A, Paula FR, Barros Ferraz SF, Gerhard P, Kashiwaqui EAL, Cyrino JEP et al. Riparian coverage affects diets of characids in neotropical streams. Ecol Freshw Fish. 2012; 21(1):12–22. https://doi.org/10.1111/j.1600-0633.2011.00518.x
Gonçalves-Silva M, D’Bastiani E, Datry T, Rezende CF. Hydrological fluctuations determine predator-prey interactions in a semi-arid non-perennial river. Hydrobiologia. 2026; 853:817–34. https://doi.org/10.1007/s10750-025-05968-1
Henriksen MV, Chapple DG, Chown SL, McGeoch MA. The effect of network size and sampling completeness in depauperate networks. J Anim Ecol. 2019; 88(2):211–22. https://doi.org/10.1111/1365-2656.12912
Herbst C, Wäschke N, Barto EK, Arnold S, Geuß D, Halboth I et al. Land use intensification in grasslands: higher trophic levels are more negatively affected than lower trophic levels. Entomol Exp Appl. 2013; 147(3):269–81 https://doi.org/10.1111/eea.12072C
Hric D, Peixoto TP, Fortunato S. Network structure, metadata, and the prediction of missing nodes and annotations. Phys Rev X. 2016; 6(3):031038. https://doi.org/10.1103/PhysRevX.6.031038
Jordano P. Sampling networks of ecological interactions. Funct Ecol. 2016; 30(12):1883–93. https://doi.org/10.1111/1365-2435.12763
Kortsch S, Primicerio R, Aschan M, Lind S, Dolgov AV, Planque B. Food-web structure varies along environmental gradients in a high-latitude marine ecosystem. Ecography. 2019; 42(2):295–308. https://doi.org/10.1111/ecog.03443
Lara C, Martinez-Bolaños E, López-Vázquez K, Díaz-Castelazo C, Castillo-Guevara C, Cuautle M. Effect of agricultural land-use change on the structure of a temperate forest ant-plant interaction network. Entomol Sci. 2020; 23(2):128–41. https://doi.org/10.1111/ens.12407
Leal JS, González AL, Soares BE, Casa Nova C, Marino NAC, Farjalla VF. Global and local drivers of the relative importance of allochthonous and autochthonous energy sources to freshwater food webs. Ecography. 2023; 2023(4):e06612. https://doi.org/10.1111/ecog.06612
Lobón-Cerviá J, Mazzoni R, Rezende CF. Effects of riparian forest removal on the trophic dynamics of a Neotropical stream fish assemblage. J Fish Biol. 2016; 89(1):50–64. https://doi.org/10.1111/jfb.12973
Manoel PS, Uieda VS. Effect of the riparian vegetation removal on the trophic network of Neotropical stream fish assemblage. Rev Ambiente Água. 2018; 13:e2088. https://doi.org/10.4136/ambi-agua.2088
MapBiomas. Project MapBiomas – Collection 4.1 of the Annual Series of Land Use and Land Cover Maps of Brazil. 2020. Available from: https://mapbiomas.org/
Mokross K, Ryder TB, Côrtes MC, Wolfe JD, Stouffer PC. Decay of interspecific avian flock networks along a disturbance gradient in Amazonia. Proc R Soc B Biol Sci. 2014; 281(1776):20132599. https://doi.org/10.1098/rspb.2013.2599
Mougi A, Kondoh M. Stability of competition-antagonism-mutualism hybrid community and the role of community network structure. J Theor Biol. 2014; 360:54–58. https://doi.org/10.1016/j.jtbi.2014.06.030
Mouillot D, Villéger S, Scherer-Lorenzen M, Mason NW. Functional structure of biological communities predicts ecosystem multifunctionality. PLoS ONE. 2011; 6(3):e17476. https://doi.org/10.1371/journal.pone.0017476
Moore JC, Berlow EL, Coleman DC, Ruiter PC, Dong Q, Hastings A et al. Detritus, trophic dynamics and biodiversity. Ecol Lett. 2004; 7(7):584–600. https://doi.org/10.1111/j.1461-0248.2004.00606.x
Neill C, Deegan LA, Thomas SM, Cerri CC. Deforestation for pasture alters nitrogen and phosphorus in small amazonian streams. Ecol Appl. 2001; 11(6):1817–28. https://doi.org/10.1890/1051-0761(2001)011[1817:DFPANA]2.0.CO;2
Nessimian JL, Venticinque EM, Zuanon J, De Marco P, Gordo M, Fidelis L et al. Land use, habitat integrity, and aquatic insect assemblages in Central Amazonian streams. Hydrobiologia. 2008; 614(1):117–31. https://doi.org/10.1007/s10750-008-9441-x
Neves MP, Delariva RL, Perkins DM, Fialho CB, Kratina P. Trophic plasticity of omnivorous fishes in natural and human-dominated landscapes. Limnol Oceanogr. 2024; 69(1):189–202. https://doi.org/10.1002/lno.12467
Newman MEJ. Modularity and community structure in networks. PNAS. 2006; 103(23):8577–82. https://doi.org/10.1073/pnas.0601602103
Nuven DMAS, Tonin AM, Rezende RS, Rabelo RS, Sena G, Bambi P et al. Habitat heterogeneity increases leaf litter retention and fragmentation in a Cerrado savanna stream. Limnologica. 2022; 92:125945. https://doi.org/10.1016/j.limno.2021.125945
Olesen JM, Bascompte J, Dupont YL, Jordano P. The modularity of pollination networks. PNAS. 2007; 104(50):19891–96. https://doi.org/10.1073/pnas.0706375104
Pellissier L, Albouy C, Bascompte J, Farwig N, Graham C, Loreau M et al. Comparing species interaction networks along environmental gradients. Biol Rev. 2018; 93(2):785–800. https://doi.org/10.1111/brv.12366
Peressin A, Gonçalves CS, Cetra M. Ichthyofauna diet changes in response to urbanization: the case of upper Paranapanema River basin (Brazil). Urban Ecosyst. 2018; 21(4):795–803. https://doi.org/10.1007/s11252-018-0755-9
Pessoa LA, Couto EV, Pagotto JPA, Goulart E. Scale effects of riparian forests on fish diversity in streams of the upper Paraná River basin. Hydrobiologia. 2025; 852(1):221–33. https://doi.org/10.1007/s10750-024-05699-9
Peterson CC, Keppeler FW, Saenz DE, Bower LM, Winemiller KO. Seasonal variation in fish trophic networks in two clear-water streams in the Central Llanos region, Venezuela. Neotrop Ichthyol. 2017; 15(2):e160125. https://doi.org/10.1590/1982-0224-20160125
Poisot T, Canard E, Mouillot D, Mouquet N, Gravel D. The dissimilarity of species interaction networks. Ecol Lett. 2012; 15(12):1353–61. https://doi.org/10.1111/ele.12002
Poisot T, Stouffer DB, Gravel D. Beyond species: why ecological interaction networks vary through space and time. Oikos. 2015; 124(3):243–51. https://doi.org/10.1111/oik.01719
Prejs A, Prejs K. Feeding of tropical freshwater fishes: seasonality in resource availability and resource use. Oecologia. 1987; 71(3):397–404. https://doi.org/10.1007/BF00378713
Quimbayo JP, Cantor M, Dias MS, Grutter AS, Gingins S, Becker JHA et al. The global structure of marine cleaning mutualistic networks. Glob Ecol Biogeogr. 2018; 27(10):1238–50. https://doi.org/10.1111/geb.12780
R Development Core Team. R: a language and environment for statistical computing. 2024. Available from: https://www.R-project.org/
Rivera-Hutinel A, Bustamante RO, Marín VH, Medel R. Effects of sampling completeness on the structure of plant–pollinator networks. Ecology. 2012; 93(7):1593–1603. https://doi.org/10.1890/11-1803.1
Rooney N, McCann KS, Gellner G, Moore JC. Structural asymmetry and the stability of diverse food webs. Nature. 2006; 442:265–69. https://doi.org/10.1038/nature04887
Santos FB, Ferreira FC, Esteves KE. Assessing the importance of the riparian zone for stream fish communities in a sugarcane dominated landscape (Piracicaba River Basin, Southeast Brazil). Environ Biol Fishes. 2015; 98(8):1895–912. https://doi.org/10.1007/s10641-015-0406-4
Santos SM, Aride PHR, Pantoja-Lima J, Oliveira AT, Zuanon JAS. Trophic relationships among three species of ornamental fish from the region of Lake Amanã, Amazon. Braz J Biol. 2021; 82:e232701. https://doi.org/10.1590/1519-6984.232701
Sebastián-González E, Dalsgaard B, Sandel B, Guimarães PR. Macroecological trends in nestedness and modularity of seed-dispersal networks: human impact matters. Glob Ecol Biogeogr. 2015; 24(3):293–303. https://doi.org/10.1111/geb.12270
Severo-Neto F, Ceron K, Ceneviva-Bastos M, Covich AP, Casatti L. Fish trophic network in karst streams from Brazilian Pantanal headwaters. Neotrop Ichthyol. 2024; 22(3):e240018. https://doi.org/10.1590/1982-0224-2024-0018
Staudacher K, Rubbmark OR, Birkhofer K, Malsher G, Sint D, Jonsson M et al. Habitat heterogeneity induces rapid changes in the feeding behaviour of generalist arthropod predators. Funct Ecol. 2018; 32(3):809–19. https://doi.org/10.1111/1365-2435.13028
Sutherland AB, Culp JM, Benoy GA. Evaluation of deposited sediment and macroinvertebrate metrics used to quantify biological response to excessive sedimentation in agricultural streams. Environ Manage. 2012; 50(1):50–63. https://doi.org/10.1007/s00267-012-9854-1
Tabi A, Santos EP, Brejão GL, Siqueira T. The ecological memory of landscape complexity shapes diversity of freshwater communities. Oikos. 2025; e11253. https://doi.org/10.1002/oik.11253
Thompson RM, Hemberg M, Starzomski BM, Shurin JB. Trophic levels and trophic tangles: the prevalence of omnivory in real food webs. Ecology. 2001; 82(9):2381–93. https://doi.org/10.1890/05-1454
Thompson RM, Townsend CR. Food-web topology varies with spatial scale in a patchy environment. Ecology. 2005; 86(7):1916–25. https://doi.org/10.1890/04-1352
Toussaint A, Charpin N, Brosse S, Villéger S. Global functional diversity of freshwater fish is concentrated in the Neotropics while functional vulnerability is widespread. Sci Rep. 2016; 6:22125. https://doi.org/10.1038/srep22125
Tylianakis JM, Morris RJ. Ecological networks across environmental gradients. Annu Rev Ecol Evol Syst. 2017; 48:25–48. https://doi.org/10.1146/annurev-ecolsys-110316-022821
Tylianakis JM, Tscharntke T, Lewis OT. Habitat modification alters the structure of tropical host-parasitoid food webs. Nature. 2007; 445(7124):202–05. https://doi.org/10.1038/nature05429
Vörösmarty CJ, McIntyre PB, Gessner MO, Dudgeon D, Prusevich A, Green P et al. Global threats to human water security and river biodiversity. Nature. 2010; 467(7315):555–61. https://doi.org/10.1038/nature09440
Wang Y, Li S, Tan X, Zhang Q. The combined effects of land use and seasonal environmental factors on stream food web structure. Front Environ Sci. 2022; 10:969980. https://doi.org/10.3389/fenvs.2022.969980
Wang Y, Jia Y, Li Z, Tao J, Lin L, Chen K et al. Trophic structure in response to land use in subtropical streams. Ecol Indic. 2021; 127:107746. https://doi.org/10.1016/j.ecolind.2021.107746
Winemiller KO. Spatial and temporal variation in tropical fish trophic networks. Ecol Monogr. 1990; 60(3):331–67. https://doi.org/10.2307/1943061
Woodward G, Perkins DM, Brown LE. Climate change and freshwater ecosystems: impacts across multiple levels of organization. Phil Trans R Soc B Biol Sci. 2010; 365(1549):2093–2106. https://doi.org/10.1098/rstb.2010.0055
Zeni JO, Casatti L. The influence of habitat homogenization on the trophic structure of fish fauna in tropical streams. Hydrobiologia. 2014; 726:259–70. https://doi.org/10.1007/s10750-013-1772-6
Authors

![]() Dianne M. A. S. Nuven1,
Dianne M. A. S. Nuven1, ![]() Juan Pablo Quimbayo2,
Juan Pablo Quimbayo2, ![]() Ariane A. Rodrigues1,
Ariane A. Rodrigues1, ![]() José Francisco Gonçalves Júnior1 and
José Francisco Gonçalves Júnior1 and ![]() Murilo Sversut Dias1
Murilo Sversut Dias1 ![]()
[1] Universidade de Brasília, Instituto de Ciências Biológicas, Programa de Pós-Graduação em Ecologia, 70910-900, Brasília, DF, Brazil. (DMASN) dianne.michelle.silva@gmail.com, (AAR) arianerodrigues@gmail.com, (JFGJ) jfjunior@unb.br, (MSD) msdias@unb.br (corresponding author).
[2] Department of Biology, University of Miami, Coral Gables, FL 33146 Miami, USA. (JPQ) quimbayo.j.p@gmail.com.
Authors’ Contribution 

Dianne M. A. S. Nuven: Conceptualization, Data curation, Formal analysis, Investigation, Methodology, Project administration, Software, Supervision, Validation, Visualization, Writing-original draft, Writing-review and editing.
Juan Pablo Quimbayo: Conceptualization, Formal analysis, Investigation, Methodology, Software, Validation, Visualization, Writing-original draft, Writing-review and editing.
Ariane A. Rodrigues: Data curation, Formal analysis, Software, Writing-review and editing.
José Francisco Gonçalves Júnior: Conceptualization, Funding acquisition, Investigation, Methodology, Project administration, Resources, Supervision, Validation, Visualization, Writing-original draft, Writing-review and editing.
Murilo Sversut Dias: Conceptualization, Data curation, Formal analysis, Funding acquisition, Investigation, Methodology, Project administration, Resources, Supervision, Validation, Visualization, Writing-original draft, Writing-review and editing.
Ethical Statement
Not applicable.
Competing Interests
The author declares no competing interests.
Data availability statement
A summary of the data used in this paper is available as supporting information and the full analyses can be found at https://github.com/msversutdias/Nuven-et-al_Trophic-networks.git
AI statement
Artificial intelligence (DeepSeek) was used exclusively for grammar and style checking on the final text revision to improve English version.
Funding
This work was supported by Coordenação de Aperfeiçoamento de Pessoal de Nível Superior (CAPES) for the Research Scholarship to DMASN (Process no. 88882.347244/2019–01). We are grateful to Conselho Nacional de Desenvolvimento Científico e Tecnológico (CNPq) for the Research Scholarship to AAR (141988/2020–7). JFGJ was funded by CNPq project (#311232/2021–3, #400439/2022–0 and PDE grant #200356/2022–4), and Fundação de Amparo à Pesquisa do Distrito Federal FAPDF (#00193–00000229/2021–21). MSD received research grants (#310524/2022–9) from the CNPq, FAPDF (#00193.00001819/2018–75) and UnB/DPI/DPG grants. This article was developed under National Institute of Science and Technology of Biodiversity and Sustainable Use of Neotropical Fishes (MCTIC/CNPq; www.inctpeixes.ufscar.br).
Supplementary Material
Supplementary material SUP
How to cite this article
Nuven DMAS, Quimbayo JP, Rodrigues AA, Gonçalves Júnior JF, Dias MS. High pasture land cover reduces modularity of trophic networks from Brazilian stream fish assemblages. Neotrop Ichthyol. 2026; 24(2):e250149. https://doi.org/10.1590/1982-0224-2025-0149
Copyright
This is an open access article under the terms of the Creative Commons Attribution License, which permits use, distribution and reproduction in any medium, provided the original work is properly cited.
Distributed under
Creative Commons CC-BY 4.0

© 2025 The Authors.
Diversity and Distributions Published by SBI
![]() Accepted December 15, 2025
Accepted December 15, 2025
![]() Submitted December 5, 2024
Submitted December 5, 2024
![]() Epub June 19, 2026
Epub June 19, 2026