![]() Julia Tovar Verba1,2,3,4
Julia Tovar Verba1,2,3,4 ![]() ,
, ![]() Adam Stow2,
Adam Stow2, ![]() Priscila F. M. Lopes1,3,
Priscila F. M. Lopes1,3, ![]() Maria Grazia Pennino3,5,
Maria Grazia Pennino3,5, ![]() Antonio Sole-Cava6 and
Antonio Sole-Cava6 and ![]() Sergio Maia Queiroz Lima7
Sergio Maia Queiroz Lima7
PDF: EN XML: EN | Supplementary: S1 S2 S3 S4 | Cite this article
Abstract
The conservation of biodiversity includes the maintenance of genetic variation and evolutionary processes. Consequently, identifying evolutionarily significant genetic lineages within exploited species can benefit the development of conservation management strategies. With the absence of genetic data life history traits are sometimes assumed to be good predictors of genetic patterns in natural populations. Here we used DNA sequences of cytochrome oxidase I and cytochrome b to test the effects of geographical features on genetic variation in 15 commercially important Brazilian fish species with varying life history traits. Despite extensive environmental heterogeneity, we did not observe evidence of concordant patterns of genetic structure for those species along the Brazilian coast. Similarly, no correlation was found between species traits and levels of gene divergence or diversity. The inference of past demographic changes using mtDNA sequence data suggests that most species have maintained stable population sizes, potentially reflecting the stable environmental conditions in the southwest Atlantic region.
Keywords: Cytochrome B, Cytochrome oxidase I, Fisheries, Neotropical fishes, Phylogeography.
Introduction
Identifying congruent patterns of genetic divergence in exploited species can contribute to the design of ecosystem-level management strategies. Broad-scale patterns of genetic structure can be shaped by historical processes that influence genetic connectivity through geographical barriers or corridors (Brown, Lomolino, 1998; Hewitt, 2004). Historical processes, such as changes in sea level, temperature, salinity, and oceanic currents, especially during the last glacial maximum, have been shown to affect marine biodiversity patterns (O’Connor et al., 2007; Gaggiotti et al., 2009; White et al., 2010; O’Brien et al., 2013; Sjöqvist et al., 2015; Verba et al., 2022). Climatic changes during the Pleistocene may have altered the environment, resulting in population bottlenecks for some species. However, the genetic signature that remains today depends on the severity of the bottleneck, the extant distribution, and the dispersal capacity (Ludt, Rocha, 2015; Baggio et al., 2017).
Many marine species have large distributions, which can be explained by the lack of clear barriers in the marine environment (Hauser, Carvalho, 2008). However, many genetic studies show that genetic population divergence of marine species is more common than expected (Riginos, Nachman, 2001; Hauser, Carvalho, 2008). River outflows, coastal upwelling, and oceanic currents are physical barriers affecting a large diversity of taxonomic groups on the Brazilian coast (Martins et al., 2022; Gama-Maia et al., 2024) and other regions. For example, the Amazon outflow is a barrier for several marine fish species along the West Atlantic coast (Araujo et al., 2022). Similarly, in the Southeast Pacific, several species of limpets show congruent patterns of genetic divergence along the Chilean coast, with the split located in an upwelling region (Peluso et al., 2023). The Cabo Frio upwelling was also reported as an important barrier to gene flow in a number of studies (Davanso et al., 2017; Volk et al., 2021). In addition to historical processes and extant physical barriers, ecological boundaries may also influence the patterns of genetic variation and distribution (Palumbi, 1997; Bowen et al., 2013).
The state of the world’s fisheries is a cause for concern, with overfishing posing a significant threat to the marine environment. According to the Food and Agriculture Organization (FAO, 2012), over 30% of all fish stocks are overexploited worldwide. In Brazil, over 40% of the most fished species are already overexploited or collapsed (Verba et al., 2020). Depletion of marine resources is of particular concern in developing tropical countries, where inadequate regulation and vulnerable fishing communities are prevalent (Bailey, 1988). Therefore, effective management planning is imperative to ensure fisheries sustainability and should be based on stock delimitation (Cowen, Sponaugle, 2009; Ovenden et al., 2015). Genetic tools can provide information needed for fisheries management, for example, identifying low genetic diversity or independent populations that can inform fishing stocks (Waples et al., 2008).
Characterizing genetic connectivity patterns and identifying isolated stocks is essential for conservation management. When planning conservation areas in marine ecosystems on a large scale, information on the population structure of species occurring in the region is usually limited, especially in highly diverse tropical areas (Roberts et al., 2002). It has been shown that specific life history traits can predict genetic structuring in plants, marine fishes, and invertebrates (Bohonak, 1999; Araujo et al., 2022; Kottillil et al., 2023).
By understanding the genetic structure of certain species and the correlation between genetic patterns and species traits, we can predict that similar, unstudied species may exhibit comparable patterns. Variations in life-history traits can lead to differences in the genetic population structure. For marine fish species, the traits that might be relevant for population structure are site fidelity, dispersal ability, body size, or habitat (Jones et al., 1999; Riginos et al., 2014; Araujo et al., 2022). Although this information is limited in most developing countries, the available data can still be used to test the effect of traits on population structure.
In addition to population divergence, genetic diversity is a crucial metric to maintain, as it influences the ability to adapt to changing environments (Reed et al., 2002; CBD, 2022). The effective population size predicts the rate at which genetic variation is lost (Ne). The Ne is one of the most critical parameters in population genetics and conservation biology. It translates the census sizes of an actual population into the size of an idealized population, showing the same rate of genetic diversity loss as the actual population under study. So, Ne is usually much smaller than the total census size, especially in high fecundity species as most fish (Frankham, 1995; Bucklin, Wiebe, 1998; Hauser et al., 2002; Ovenden et al., 2007; Okello et al., 2008). Life history traits can predict genetic diversity: in birds, it was shown that herbivorous species with smaller body mass had a higher genetic diversity (Brüniche-Olsen et al., 2021), while in mammals, parental-care traits were correlated with genetic diversity (Romiguier et al., 2014). The main predictors of gene variability in fish are age at maturity, fecundity, and habitat (Martinez et al., 2018).
To address the hypothesis that fishes with different traits are differentially structured along the Brazilian coast, we investigated the genetic diversity and structure along with the demographic history of 15 exploited fish species in tropical and subtropical regions of Brazil using mitochondrial sequences (cytochrome c oxidase subunit I – COI – and cytochrome B – Cytb). Brazil has an extensive coastline with significant heterogeneity in temperature, productivity, and freshwater outflows, which can potentially restrict the gene flow. The 15 species selected for this study have different natural histories and ecological attributes that we predict may affect their genetic patterns. These include different trophic levels, maximum body size, bathymetric distribution, habitat, and dependence on estuary areas. Here, we aim to test the effects of six existing barriers on the patterns of genetic diversity and population structure changes in the effective population size of fifteen commercially important fish species. We expect species that live in shallow water, with smaller body sizes, living in brackish water, reef, and demersal areas to show higher genetic structuring than those with larger body sizes and high dispersal capability, at least as a legacy of past sea-level changes.
Material and methods
Study area. The Brazilian coast extends over 8,000 km in the southwest Atlantic, covering both tropical and subtropical regions (Fig. 1). The wide latitudinal range represents a gradient of different environments in terms of current and past climate, including temperature, salinity, oceanic currents, river mouths, continental shelf width, and sea level fluctuation. The northern zone (north coast), highly affected by the Amazon River plume, has warmer sea temperatures and strong westward currents. The northeastern area is characterized by warm sea temperatures and a narrow continental shelf, and its southern area is affected by the plume of the São Francisco River. The southeastern coast of Brazil has relatively colder sea temperatures and a wide shelf, marked by an upwelling system around 30oS of latitude (Coelho-Souza et al., 2012). Depending on the type of data applied, it is divided in two, three or five biogeographical clades along the coast. Integrating biotic and abiotic factors, the coast is divided into two marine biogeographic realms, the Tropical Atlantic and the Temperate South America (Spalding et al., 2007). When examining reef fish assemblages, the Brazilian coast is divided in three zoogeographical provinces: the first extending from the state of Pará to Alagoas, the second from Bahia to Santa Catarina, and the third within the state of Rio Grande do Sul (Pinheiro et al., 2018). However, a study using a multi-taxa approach proposed a division into five sub-provinces: North, Northeast, Abrolhos Bank, Southeast and South (Cord et al., 2022). Based on previous studies, we tested six potential barriers: (1) the extensive mangrove region along the coast of Maranhão, (2) the influence of the South Equatorial Current off the coast of Rio Grande do Norte, (3) the outflow of the São Francisco River, (4) the Vitoria-Trindade Seamount Chain, (5) the upwelling phenomenon in Cabo Frio, Rio de Janeiro, and (6) Santa Marta Cape, in Santa Catarina (Fig. 1).
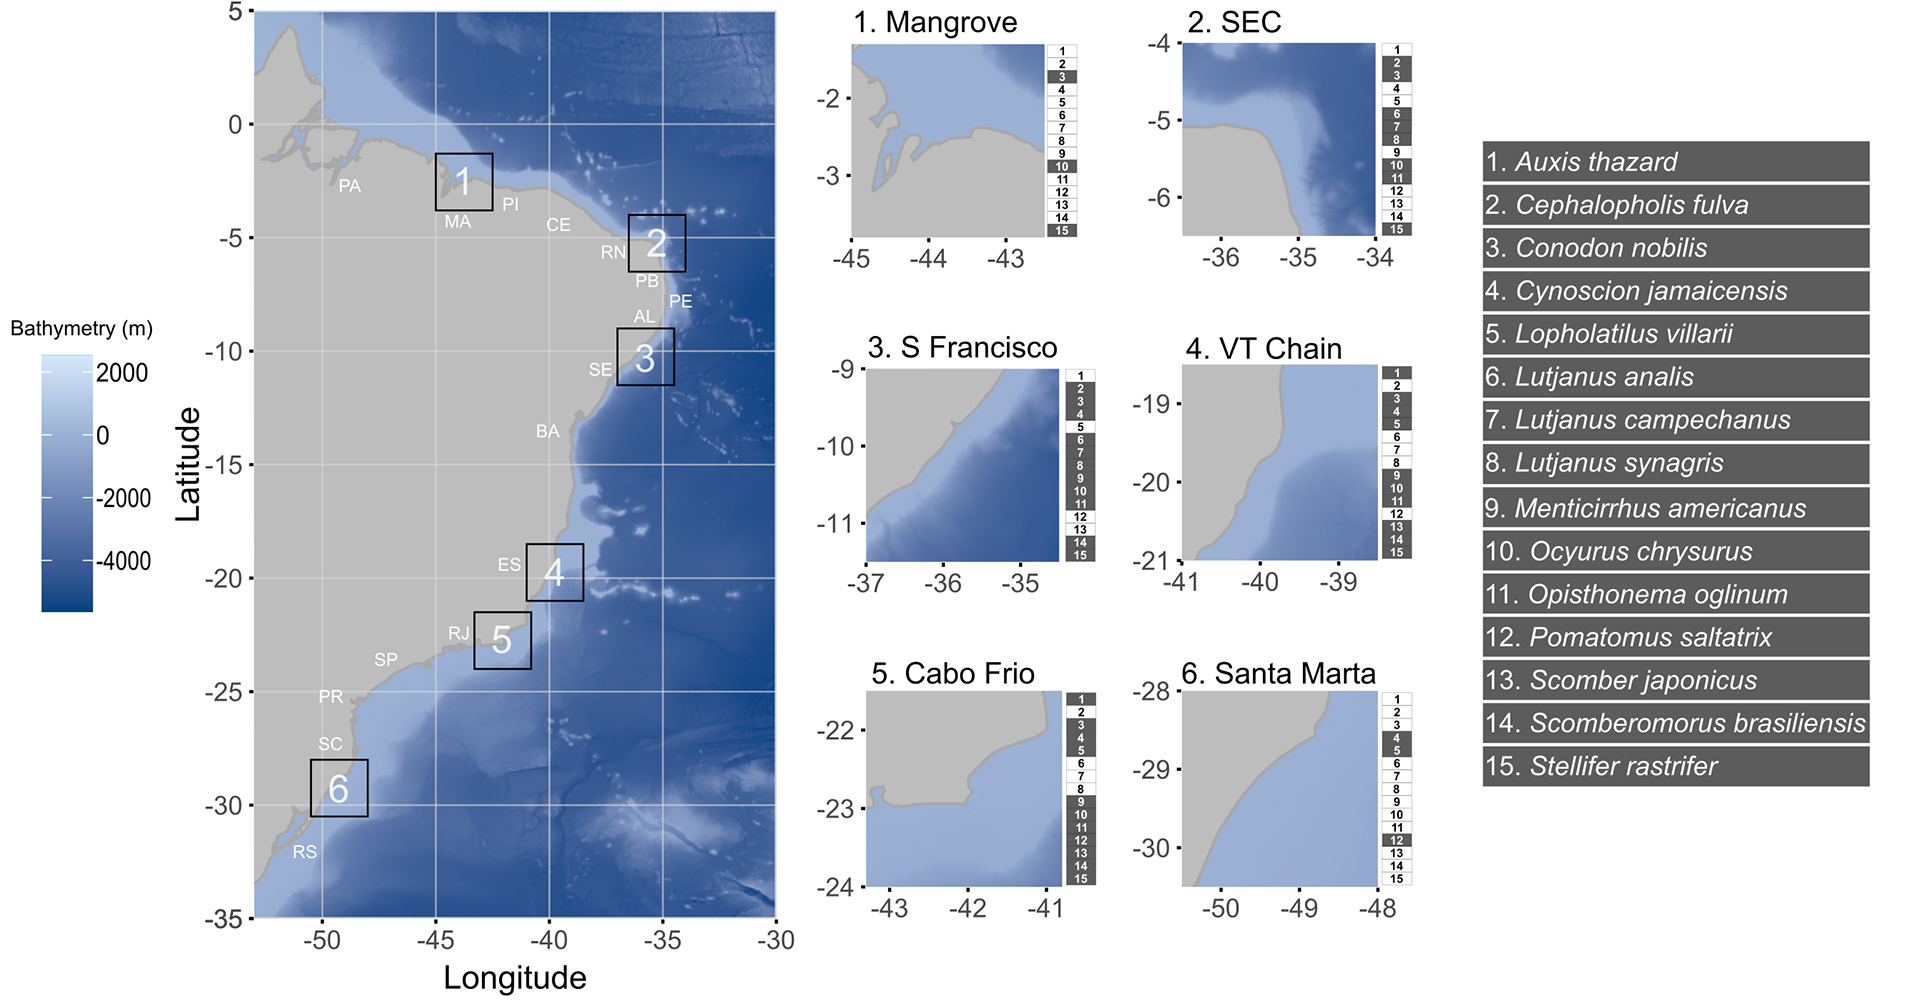
FIGURE 1| Brazilian coast with bathymetry gradient, state abbreviations: PA – Pará, MA – Maranhão, PI – Piauí, CE – Ceará, RN – Rio Grande do Norte, PB – Paraíba, PE – Pernambuco, AL – Alagoas, SE – Sergipe, BA – Bahia, ES – Espírito Santo, RJ – Rio de Janeiro, SP – São Paulo, PR – Paraná, SC – Santa Catarina, and RS – Rio Grande do Sul. In the right, the hypothesized barriers in squares with the species with data available for each hypothesis marked in grey. SEC – South Equatorial Current, S Francisco – Mouth of São Francisco River, VT Chain – Vitoria-Trindade Seamounts Chain.
Species selection. The 15 species selected for this study represented more than 50,000 tons and almost 10% of the total fish caught in Brazil in 2010 (Tab. S1; Freire et al., 2015). These species belong to eight different Teleostei families: four Lutjanidae, three Scombridae, three Sciaenidae, and one species each of Epinephelidae, Haemulidae, Malacanthidae, Clupeidae and Pomatomidae. Additionally, these species have a wide diversity of biological traits, and threat levels. For example, their maximum body size ranges from 32 to 130 cm, their trophic level between 3.3 and 4.5, and there are species with demersal, pelagic, and reef habitats (Froese, Pauly, 2000). They also show a variety of reproduction and developmental traits, including having some aggregation and estuarine spawners, different lengths of pelagic phase, and protogynous species. Most species are considered Least Concern by IUCN, 2019 (N = 9), although four have unknown population trends and two have been decreasing. Of the remaining six, all show signs of decreasing populations, with two species not evaluated by IUCN, 2019, one considered as Data Deficient (Ocyurus chrysurus), two Near Threatened (Lutjanus analis and L. synagris), and one Vulnerable (Pomatomus saltatrix) (Fig. 2A). Analysis based on historical catch data indicates that two of the analyzed species are considered ‘overexploited’ (Conodon nobilis and Lopholatilus villarii). At the same time, six are ‘fully exploited’ (Cynoscion jamaicensis, L. analis, L. campechanus, Menticirrhus americanus, Opisthonema oglinum and Scomberomorus brasiliensis), meaning that the catch is near the limits of sustainability (Fig. 2A; Verba et al., 2020). Overall, the species analyzed here are either of conservation concern or important fishing targets.
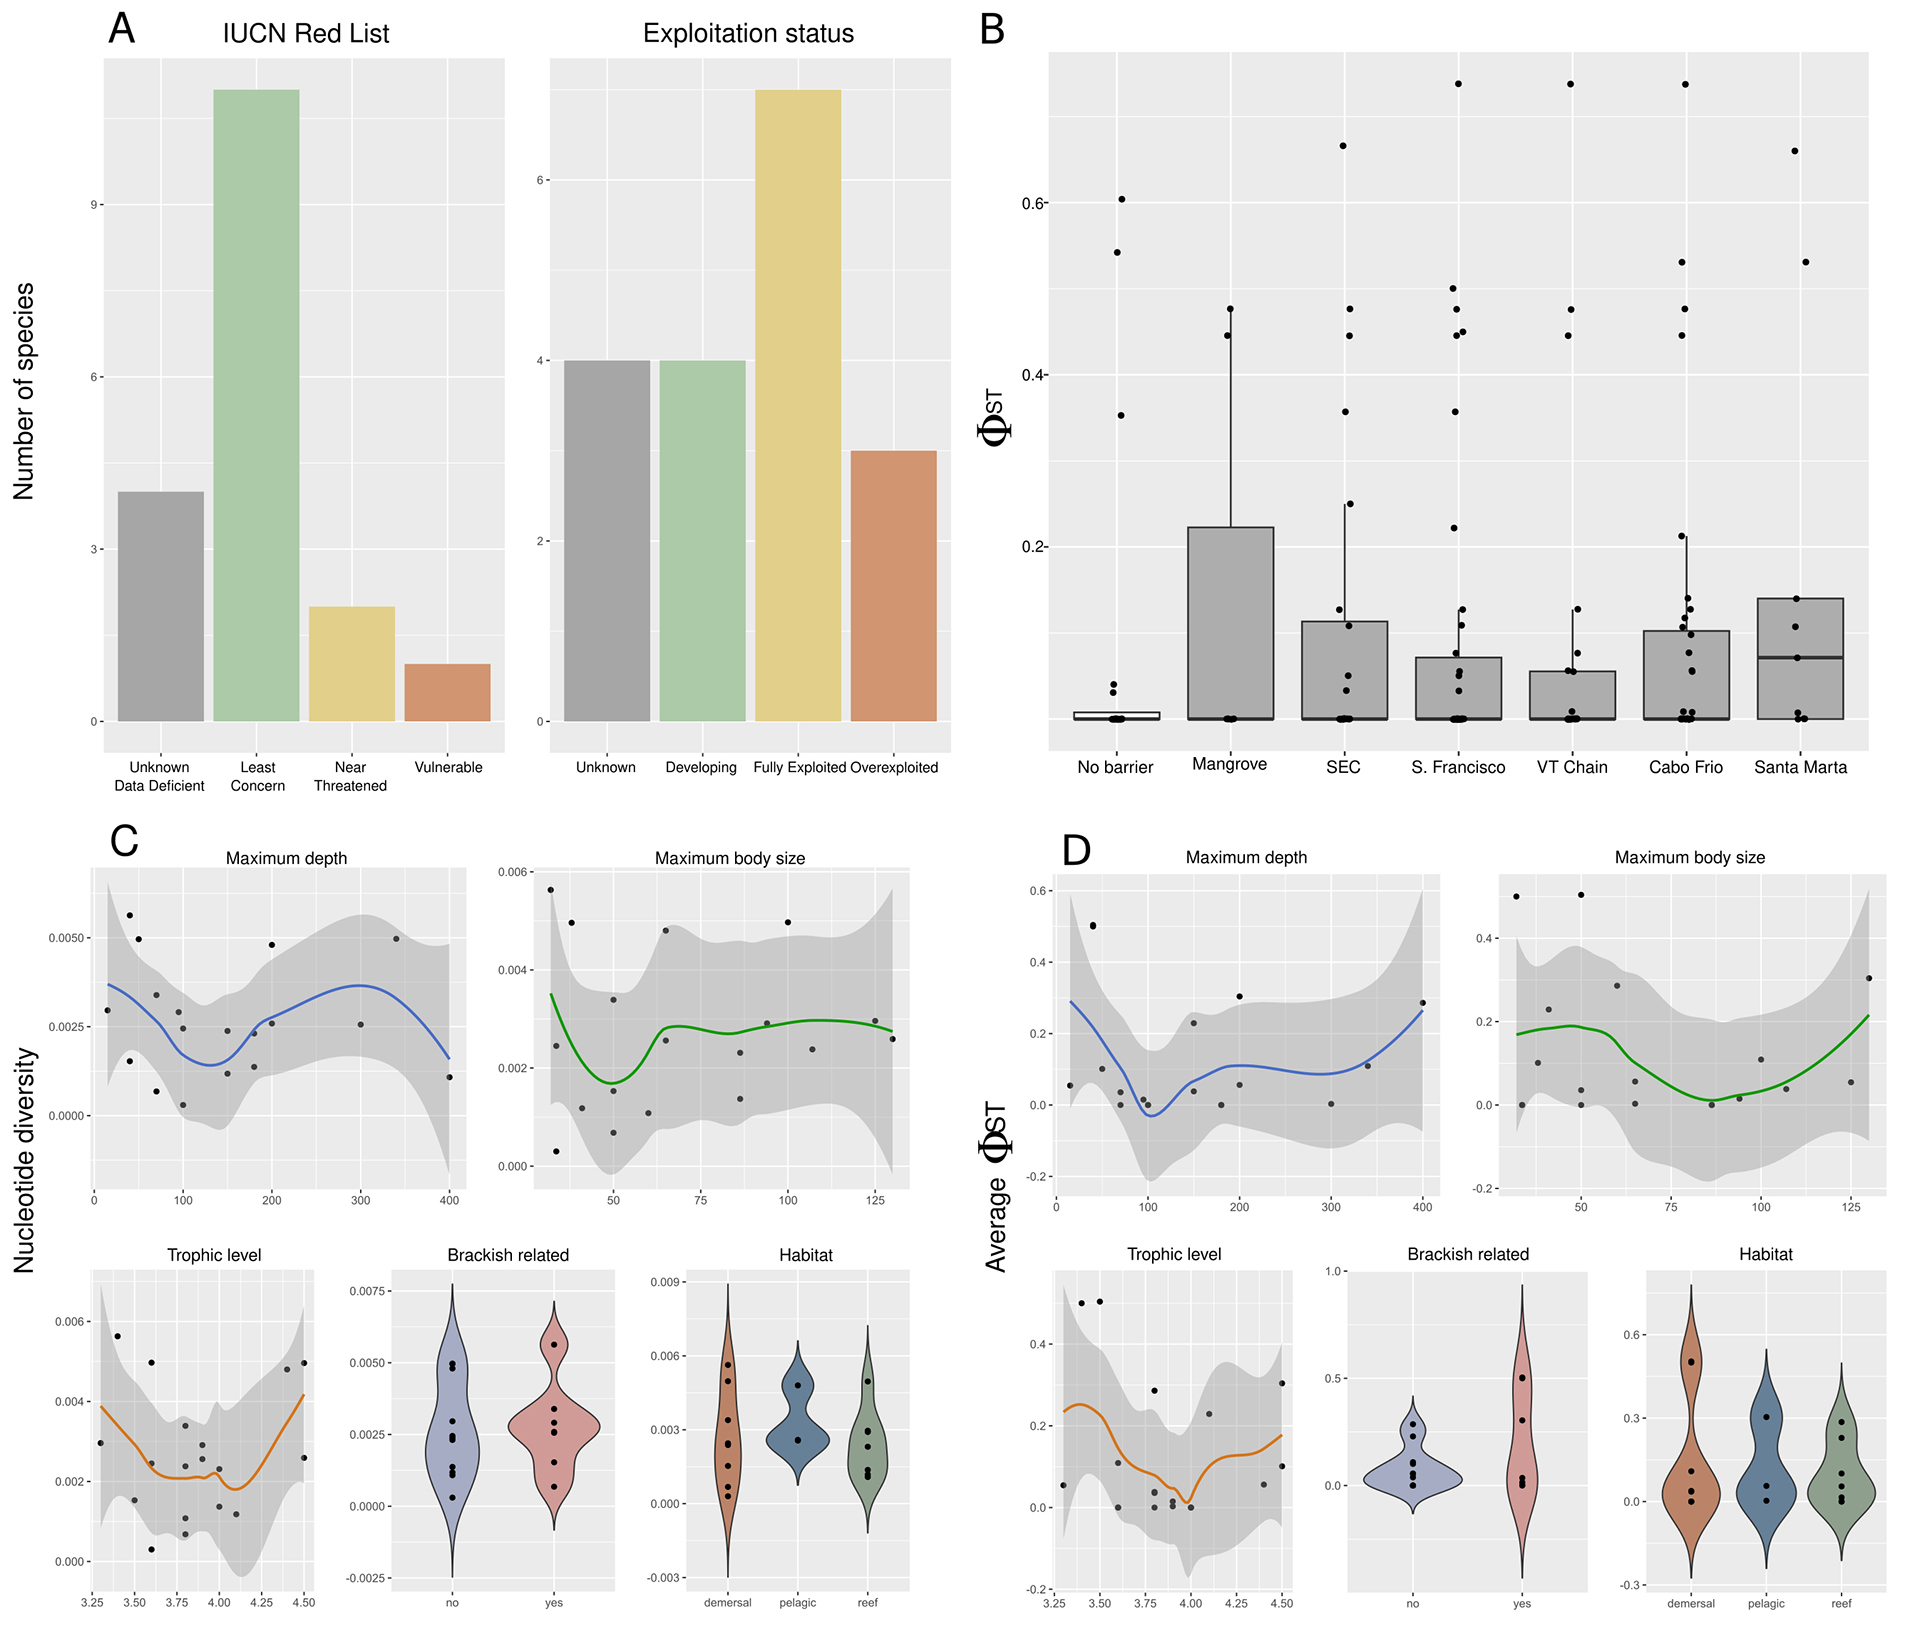
FIGURE 2| A. Status of the marine fish species based on the Red List of IUCN and based on catch data (Verba et al., 2020). B. Pairwise ΦST between sampling sites. C. Nucleotide diversity per species, per marker. D. Average ΦST per species, per marker.
Molecular analyses. Each PCR reaction consisted of 5–10 ng of sample DNA, 2 ìl of 5X Master Mix containing 12.5 mM MgCl2 (final concentration of 2.5 mM) (Solis BioDyne, Tartu, Estonia), 0.25 ìM of each primer, 200 ìM dNTPs, 0.5 mg BSA, and nuclease-free water for a final concentration of 10 ìl. The primer pair L14735 (F 5′-AAAAACCACCGTTGTTATTCAACTA-3′ 25 mers) and H15149AD (R 5′-GCICCTCARAATGAYATTTGTCCTCA-3′ 26 mers) (Sotelo et al., 2001) was used for Cytb amplifications, whereas primers FishF2_t1-F forward (F 5′-TGTAAAACGACGGCCAGTCGACTAATCATAAAGATATCGGCAC-3’) and FishR2_t1 reverse (R 5’- CAGGAAACAGCTATGACACTTCAGGGTGACCGAAGAATCAGAA-3’) (Ivanova et al., 2007) were used for amplifying COI. PCR was performed with an initial denaturing step of 4 min at 94 °C, followed by 35 cycles at 93 °C for 30 s, 50 °C for 40 s, and 72 °C for 1 min, and a final extension step of 7 min at 72 °C. PCR products were inspected using 2% agarose gel electrophoresis and purified enzymatically by incubating 5 ìl of PCR product for 15 min at 37 °C in 6 ìl of an aqueous solution containing 0.08 units of alkaline phosphatase (FastAP, Fermentas, Waltham, MA, USA) and 0.83 units of exonuclease I (Fermentas). Sequencing was performed using the BigDye Terminator v. 3.1 Ready Mix kit (Applied Biosystems, Foster City, CA, USA) on a 3500 Genetic Analyzer (Applied Biosystems).
Forward and reverse DNA sequences were assembled using Geneious Prime software v. 2019.1.2 (Biomatters Ltd., Auckland, New Zealand). The sequences were used for species identification using similarity searches and phylogenetic analyses. In the similarity-based approach, a threshold of 98% similarity was used for species identification. Custom local BLASTn searches were conducted against a database containing all fish COI and Cytb sequences available at NCBI, supplemented by an in-house sequence database. Only sequences with a minimum length of 450 bp for COI and 700 bp for Cytb were used. COI sequences were available for eight species and Cytb for 12 species. Following this publication, new sequences produced by Centro Nacional para a Identificação Molecular do Pescado (CENIMP) initiative will be publicly available to help build a robust database that can aid future phylogeographical, molecular systematic, and fish forensics studies.
Genetic diversity and population structure. The sequences we obtained and Genbank sequences from the same species and geographic location were combined and aligned in MEGA4 (Tamura et al., 2007) using the MUSCLE function. We used DNAsp software (Librado, Rozas, 2009) to define population sets to perform pairwise ΦST analyses and an Analysis of Molecular Variance (AMOVA) using Arlequin 3.5 software (Excoffier, Lischer, 2010) with 10,000 permutations; values were considered significant when p < 0.05. These parameters were calculated in two ways: i) among some localities, grouping combinations considering the six possible barriers (ΦST-barriers) and ii) among each sampling site, independent of the occurrence of possible barriers (ΦST-sites). After defining the population structure, we calculated the following genetic diversity parameters: DNA polymorphism, haplotype number, haplotype diversity, number of polymorphic sites, and nucleotide diversity. To visualize the haplotype diversity, we built networks using PopArt (Leigh, Bryant, 2015) and the TCS network function. We edited the figures using the InkScape software (Bah, 2009).
Life history, exploitation status and genetic diversity. To assess the effect of life history traits on ΦST and genetic diversity measures (nucleotide and haplotype diversity), we applied several statistical tests in R. We estimated genetic divergence for each species by calculating the average pairwise ΦST-sites across all combinations of sampling sites. An ANOVA test (aov function, Girden, 1992) was used to examine habitat effects (demersal, reef, or pelagic), while a t-test (t.test function, Student, 1908) tested the effect of estuarine dependence (related or unrelated). For continuous variables (maximum bathymetry in meters, body size in cm, and trophic level), we performed correlation tests (cor.test function). P-values were used to determine whether genetic measures differed between groups or correlated with continuous life history variables. We also investigated if there is a correlation between exploitation status (Population trend, Red List, and Exploitation Status) and haplotype diversity, using an ANOVA test in R.
Historical demography. We used three different and complementary approaches to identify population size tendencies (expansion, stability, or decline). First, we applied two neutrality tests (Tajima’s D and Fu’s Fs) using Arlequin (considering a significant p-value lower than 0.02 after Bonferroni correction). Tajima’s D test uses information on mutation frequency to distinguish stable from expanding or contracting populations (Tajima, 1989). However, these changes in mutation frequency can be attributed to changes in population size or positive selection (Ford, 2002). Fu’s Fs uses haplotype distribution information to infer changes in population size (Fu, 1997). Fu’s Fs can be sensitive to small sample sizes but more potent in identifying population expansion under some conditions (Ramos-Onsins, Rozas, 2002).
Since neutrality tests alone cannot capture all signals of historical demography, we also used an additional coalescent Bayesian Skyline Plot in BEAST v. 1 and BEAUti (Drummond, Bouckaert, 2015). This analysis permits inferring changes in population size over time. In the lack of specific rates for each species and each markers, the parameters included in BEAUti were clock rate = 1.2E-08, which was based on the cytb mitochondrial gene substitution rate in fish (Bermingham, 1997). Because of that, the time of effective population size change should be consider with cautious, especially for the COI results. The chain length used was 10,000,000, but this number was increased whenever the Effective Sample Sizes of any parameter were less than 200. Convergence was assessed by the Bayesian Skyline. The reconstruction graphs were made using Tracer v. 1.7.1.
Results
Genetic diversity and population structure. We analyzed 362 sequences from the 15 species, 116 of COI from seven species, and 246 of Cytb from 11 species (Tab. 1; Figs. 3–4).For COI, nucleotide diversity ranged from 0.00030 (Conodon nobilis) to 0.00563 (Stellifer rastrifer), and haplotype diversity ranged from 0.154 (C. nobilis) to 0.950 (S. rastrifer). For Cytb, nucleotide diversity ranged from 0.00108 (Lutjanus synagris) to 0.00497 (Lutjanus campechanus), and haplotype diversity ranged from 0.575 (Ocyurus chrysurus) to 1.000 (Auxis thazard). Although none of the estimates of ΦST-barriers were statistically significant (p > 0.05, Tab. S1), certain species exhibited genetic divergence that could be potentially attributed to at least one of the tested barriers. These species included Cephalopholis fulva (São Francisco River, Vitoria-Trindade Chain, and/or Cabo Frio), Cynoscion jamaicensis (Cabo Frio), Lopholatilus villarii (Vitoria-Trindade Chain, Cabo Frio, and/or Santa Marta Cape), Ocyurus chrysurus (SEC, São Francisco River, Vitoria-Trindade Chain, and/or Cabo Frio), Pomatomus saltatrix (Cape of Santa Marta), and Scomber japonicus (Vitoria-Trindade Chain, and/or Cabo Frio). Stellifer rastrifer showed significant genetic difference (pairwise ΦST-sites, Tab. S2) among all three sample localities – (Rio de Janeiro – RJ, São Paulo – SP and Pará – PA), although the AMOVA results were not significant (Tab. S3). Similar patterns were observed in Menticirrhus americanus and Lutjanus synagris, where two out of three pairwise ΦST-sites comparisons were significant (Tab. S2). However, these genetic differences could not be attributed to any of the tested barriers. The observed divergence in these species may also be influenced by ecological speciation, in which local adaptation to distinct environmental conditions plays a role in shaping genetic structure (Rocha et al., 2005).
TABLE 1 | Species selected, their population trend according to IUCN (2019), and their status based on catch data (Verba et al., 2020), the markers analyzed, number of sequences for each marker (# sequences), total number of sites, polymorphic sites (S), haplotype diversity (h), nucleotide diversity (pi), sampling locations, with the number of samples in each area in parenthesis, and the tested barriers. Abbreviation for states are: PA – Pará, MA – Maranhão, PI – Piauí, CE – Ceará, RN – Rio Grande do Norte, PB – Paraíba, PE – Pernambuco, AL – Alagoas, SE – Sergipe, BA – Bahia, ES – Espírito Santo, RJ – Rio de Janeiro, SP – São Paulo, PR – Paraná, SC – Santa Catarina, RS – Rio Grande do Sul.
Species | Family | Habitat | Depth range (m) | Brackish related | Maximum size (cm) | Trophic level | Red List | Population trend (IUCN) | Exploitation status (Verba et al.. 2020) | Marker | # sequences | Number of sites | Polymorphic sites | Haplotype number | Haplotype diversity | Nucleotide diversity π | Average # of nucleotide differences |
Auxis thazard (Lacepède, 1800) | Scombridae | Pelagic | 50 to ? | no | 65 | 4.4 | LC | Stable | – | CytB | 12 | 1022 | 22 | 12 | 1 | 0.0048 | 4.909 |
Cephalopholis fulva (Linnaeus, 1758) | Epinephellidae | Reef | 1 to 150 | no | 41 | 4.1 | LC | Decreasing | Developing | CytB | 18 | 1043 | 7 | 8 | 0.752 | 0.00118 | 1.235 |
Conodon nobilis (Linnaeus, 1758) | Haemulidae | Demersal | 1 to 100 | no | 33.6 | 3.6 | LC | Unknown | Overexploited | COI | 13 | 517 | 1 | 2 | 0.154 | 0.0003 | 0.154 |
Cynoscion jamaicensis (Vaillant & Bocourt, 1883) | Sciaenidae | Demersal | 1 to 70 | yes | 50 | 3.8 | LC | Stable | Fully exploited | COI | 13 | 452 | 2 | 3 | 0.295 | 0.00068 | 0.308 |
Lopholatilus villarii Miranda Ribeiro, 1915 | Malacanthidae | Demersal | – | no | 107 | 3.8 | – | – | Overexploited | CytB | 20 | 896 | 7 | 5 | 0.821 | 0.00238 | 2.132 |
Lutjanus analis (Cuvier, 1828) | Lutjanidae | Reef | 25 to 95 | yes | 94 | 3.9 | NT | Decreasing | Fully exploited | CytB | 12 | 724 | 11 | 7 | 0.773 | 0.00291 | 2.106 |
Lutjanus campechanus (Poey, 1860) | Lutjanidae | Demersal | 26 to 340 | no | 100 | 3.6 | – | – | Fully exploited | CytB | 51 | 779 | 40 | 44 | 0.995 | 0.00497 | 3.87 |
Lutjanus synagris (Linnaeus, 1758) | Lutjanidae | Reef | 10 to 400 | no | 60 | 3.8 | NT | Decreasing | Developing | CytB | 17 | 725 | 5 | 6 | 0.588 | 0.00108 | 0.779 |
Menticirrhus americanus (Linnaeus, 1758) | Sciaenidae | Demersal | ? to 40 | yes | 50 | 3.5 | LC | Unknown | Fully exploited | COI | 23 | 565 | 5 | 5 | 0.644 | 0.00153 | 0.862 |
Ocyurus chrysurus (Bloch, 1791) | Lutjanidae | Reef | 0 to 180 | no | 86.3 | 4.0 | DD | Decreasing | Developing | COI | 16 | 564 | 4 | 4 | 0.575 | 0.00137 | 0.775 |
Opisthonema oglinum (Lesueur, 1818) | Clupeidae | Reef | 1 to 50 | no | 38 | 4.5 | LC | Unknown | Fully exploited | COI | 13 | 600 | 11 | 8 | 0.91 | 0.00496 | 2.974 |
Pomatomus saltatrix (Linnaeus, 1766) | Pomatomidae | Pelagic | 0 to 200 | yes | 130 | 4.5 | VU | Decreasing | – | CytB | 36 | 736 | 22 | 19 | 0.927 | 0.00259 | 1.908 |
Scomber japonicus Houttuyn, 1782 | Scombridae | Pelagic | – | yes | 65 | 3.9 | LC | Stable | – | CytB | 20 | 1043 | 15 | 13 | 0.947 | 0.00256 | 2.674 |
Scomberomorus brasiliensis Collette, Russo & Zavala-Camin, 1978 | Scombridae | Reef | – | no | 125 | 3.3 | LC | Decreasing | Fully exploited | COI | 22 | 625 | 11 | 11 | 0.913 | 0.00296 | 1.853 |
Stellifer rastrifer (Jordan, 1889) | Sciaenidae | Demersal | 0 to 40 | yes | 32 | 3.4 | LC | Unknown | – | COI | 16 | 627 | 12 | 11 | 0.95 | 0.00563 | 3.525 |
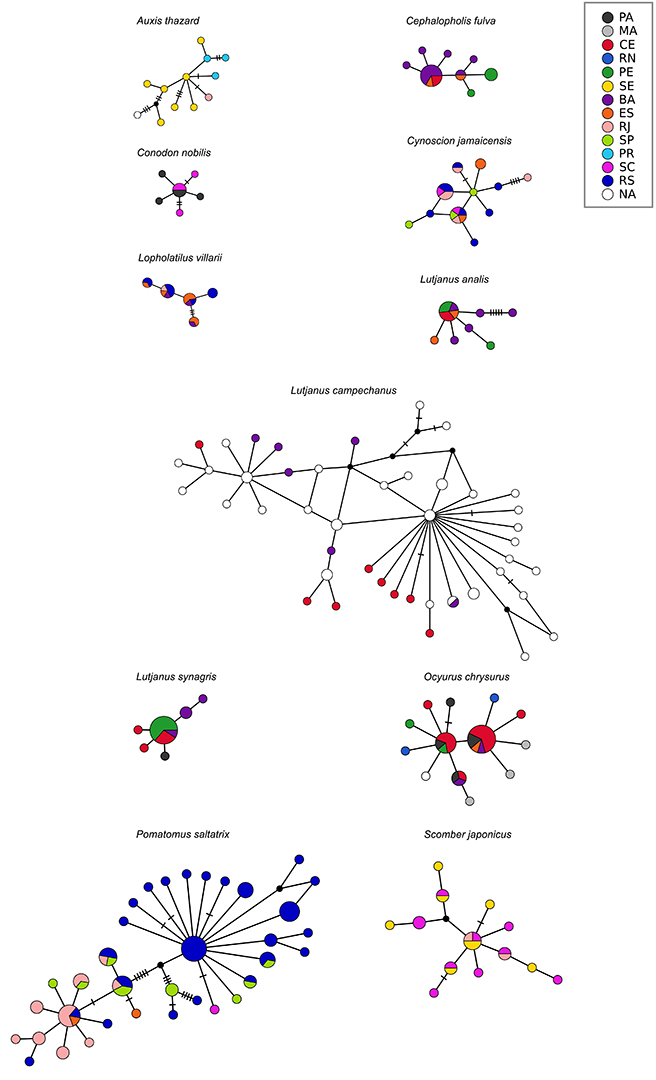
FIGURE 3| Cytochrome B haplotype networks for each commercially marine fish species. Abbreviations refer to Brazilian coastal states: PA – Pará, MA – Maranhão, CE – Ceará, RN – Rio Grande do Norte, PE – Pernambuco, SE – Sergipe, BA – Bahia, ES – Espírito Santo, RJ – Rio de Janeiro, SP – São Paulo, PR – Paraná, SC – Santa Catarina, RS – Rio Grande do Sul. Individuals collected in unknown locations are marked in white as NA.
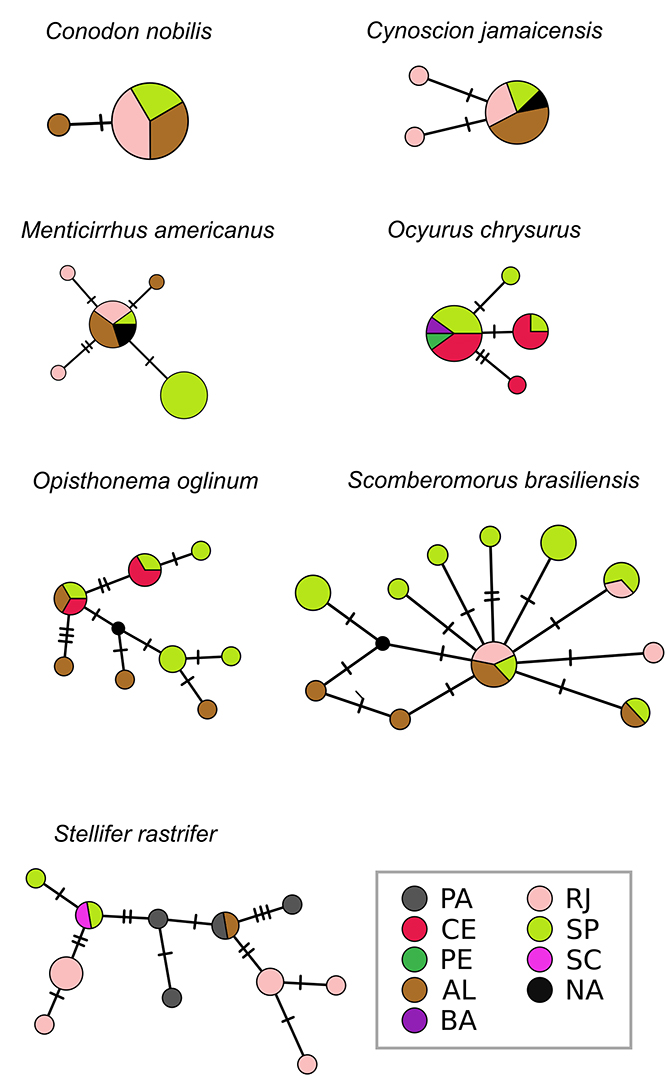
FIGURE 4| Cytochrome oxidase I haplotype networks for each commercially marine fish species. Abbreviations refer to Brazilian coastal states: PA – Pará, CE – Ceará, PE – Pernambuco, AL – Alagoas, BA – Bahia, RJ – Rio de Janeiro, SP – São Paulo, SC – Santa Catarina. Individuals collected in unknown locations are marked in white as NA.
Life history, exploitation status and genetic diversity. We found no significant difference in either ΦST-sites or nucleotide diversity between species in different habitats (Figs. 2C–D). We also found no significant correlation between genetic and continuous life history measures (depth, maximum body size, and trophic levels), or exploitation status (Population trend, Red List status, or Exploitation status).
Demographic history. According to Tajima’s D neutrality tests using COI, no species showed signs of population size variation, while for Cytb, five species showed signs of expansion (Tab. 2). Fu’s Fs provided evidence of population expansion in 12 species, while signatures of expansion were common in the analyses of three species. Analysis of changes in population size over time, using Bayesian Skyline Plots, indicated that all but one species that showed expansion (L. campechanus) were demographically stable (Tab. 2; Fig. S4).
TABLE 2 | Demography results of each marine commercial fish species and marker in Tajima’s D, Fu’s Fs, and Bayesian Skyline Plot (BSP) analyses. For Tajima’s D and Fu’s Fs, only significant results (p < 0.02) were included.
Species | Marker | Tajima’s D | Fu’s Fs | BSP |
Auxis thazard | Cytb | Non-significant | Expansion | Stability |
Cephalopholis fulva | Cytb | Non-significant | Expansion | Stability |
Conodon nobilis | COI | Non-significant | Non-significant | Stability |
Cytb | Expansion | Non-significant | Stability | |
Cynoscion jamaicensis | COI | Non-significant | Expansion | Stability |
Cytb | Non-significant | Expansion | Stability | |
Lopholatilus villarii | Cytb | Non-significant | Non-significant | Stability |
Lutjanus analis | Cytb | Expansion | Non-significant | Stability |
Lutjanus campechanus | Cytb | Expansion | Expansion | Stable expansion through time |
Lutjanus synagris | Cytb | Non-significant | Expansion | Stability |
Menticirrhus americanus | COI | Non-significant | Non-significant | Stability |
Ocyurus chrysurus | COI | Non-significant | Non-significant | Stability |
Cytb | Expansion | Expansion | Stability | |
Opisthonema oglinum | COI | Non-significant | Not significant | Stability |
Pomatomus saltatrix | Cytb | Expansion | Expansion | Stability |
Scomber japonicus | Cytb | Non-significant | Expansion | Stability |
Scomberomorus brasiliensis | COI | Non-significant | Expansion | Stability |
Stellifer rastrifer | COI | Non-significant | Expansion | Stability |
Discussion
Low genetic structure and stable demography were observed in most of Brazil’s 15 commercially exploited marine fish evaluated. The lack of genetic structure for most of these species implies that each can be managed as a single unit. However, more variable markers may provide more resolution to detect stocks with a more subtle level of differentiation. In addition, the lack of differentiation for some of the species may be attributed to small sample sizes, and could benefit from the use of highly resolving nuclear markers and larger sample sizes. Levels of genetic variation were similar in the two mitochondrial markers used, with the lowest variation reported in Conodon nobilis and Cynoscion jamaicensis.
Measures of genetic diversity are critical to determining risks of inbreeding or lack of adaptive potential and are increasingly being officially considered in evaluating conservation status (Hoban et al., 2021; CBD, 2022; Bertola et al., 2024). Considering the lack of data on many fish species exploited in the tropics, information about the distribution of genetic diversity can contribute to prioritizing and directing conservation efforts (Hoban et al., 2024). Although a significant correlation was not found between genetic diversity and threat status, the nucleotide diversity (COI-ð) measures of all seven species with available COI data were below the threshold reported for non-threatened species (Petit-Marty et al., 2020). This finding suggests that these species may be experiencing population declines, and could benefit from limitations on their exploitation in Brazil.
Our general finding of no significant genetic structure indicates that the considerable environmental variability along the Brazilian coast, such as the sea surface temperature, large river outflows, and variability in the occurrence of reefs and mangroves, does not lead to significant genetic structure in the analyzed species. It is important to emphasize that, at least for some species, the small sample size and limited number of localities may affect our findings. However, most previous studies in the same area found a similar pattern (Silva-Oliveira et al., 2008; Silva et al., 2015; Peres et al., 2020), even when analyzing many markers (Verba et al., 2022, 2023; Coelho et al., 2024). Low genetic structure in marine organisms can be partially attributed to a pelagic larval phase for many species, which allows gene flow and the mixing of young individuals in the early stages of their lives (Palumbi, 1994). In addition, most species analyzed are large-bodied (76.2 cm on average), facilitating the crossing of adults over what might otherwise be considered a marine barrier (Luiz et al., 2013; Araujo et al., 2022).
Despite the lack of statistical significance, higher ΦST-barriers level may provide some insights into possible barriers in marine organisms. Among the six barriers tested in this study, five were associated with at least one species with a ΦST-barrier value higher than 0.1. The only potential barrier that did not appear to influence the genetic distribution of the tested species was the Mangroves in the state of Maranhão (MA). However, this hypothesis was tested with only three species, which limits the capacity to draw conclusions.
For the South Equatorial Current barrier hypothesis, we analyzed eight species, with only one (Ocyurus chrysurus) showing a high of ΦST-barrier value with one of the markers (COI ΦST-barrier > 0.5). The São Francisco River, although considered a weak barrier, is known to be relevant barrier for some marine fish (Costa et al., 2022). In this study, we analyzed 10 species for this barrier, with two (C. nobilis and O. chrysurus) showing ΦST-barrier value larger than 0.2. However, for both species, the sampling site do not allow us to exclude the potential influence of the other barriers, such as Vitoria-Trindade Chain and Cabo Frio on their genetic patterns. The Vitoria-Trindade Chain, which affects the distribution of fish and other marine organisms, appears to act as a genetic barrier for four out of the 10 analyzed species (C. nobilis, L. villarii, O. chrysurus,and S. japonicus). Similarly, the temperature variation in Cabo Frio appears to influence the genetic structure of five out of eleven analyzed species (C. nobilis, C. jamaicensis, L. villarii, O. chrysurus,and S. japonicus). For the southernmost barrier hypothesis at Santa Marta Cape, we were able to analyze three species. Of these, two (L. villarii and P. saltatrix) exhibited ΦST-barrier values higher than 0.15, suggesting potential genetic influence.
Ocyurus chrysurus is a reef species that showed higher ΦST-barriers values for comparisons across four of the six tested barriers. However, it is important to note that we had more than one sample only from two sampling sites, CE and SP, while PE and BA had only one sample each. This limitation makes it challenging to determine, which barrier most significantly explain the observed genetic patterns. For this species, we also analyzed the Cytb marker from a larger number of sampling sites, which consistently yielded negative ΦST-barriers values, in alignment with a previous study conducted in the same region (Silva et al., 2015). The difference in structure levels between COI and Cytb markers for this species may be attributed to the disparity in samples size, potentially leading to an overestimation of structure in the COI marker. A similar pattern was observed in the demersal species Conodon nobilis, where COI marker showed ΦST-barriers values of 0.28, while Cytb marker exhibited values that were 10-fold lower (0.02).
Three other species showed relatively higher ΦST-barriers values, which could be attributed to at least one of the tested barrier. Lopholatilus villarii, a large demersal species, presented relatively high ΦST-barriers values associated to three tested barriers (VT Chain, Cabo Frio and Santa Marta Cape). Two of these barriers, VT Chain and Cabo Frio, may also influence the genetic structure of the pelagic species Scomber japonicus. Pomatomus saltatrix, a pelagic species inhabiting waters up to 200 m deep, exhibits divergence, consistent with the presence of Santa Marta Cape (Fig. 1; Tab. S1). However, when analyzing ΦST-sites (without considering the barriers), we found no significant genetic difference between any sample localities and ES, north of Cabo Frio. This lack of differentiation can be likely attributed to the low sampling size (N = 2). Recently, a study focused on the same species used COI to reveal a significant genetic break between samples from Argentina and Brazil, and some divergence between RJ and SP, also identified here. Interestingly, there were no genetic differences between Rio de Janeiro and Venezuela (Queiroz-Brito et al., 2022). A related study (Villela et al., 2024) reported a deep divergence between nuclear and mitochondrial genes of anchovy groups along the Brazilian coast. Pomatomus saltatrix is a globally distributed large-bodied species (Froese, Pauly, 2000), indicating a high dispersal capacity potentially facilitating gene flow. Environmental factors may be more important than biological traits in explaining the genetic structuring (Jenkins et al., 2018; Lehnert et al., 2019).
We combined three methods to identify the demographic history (Eytan, Hellberg, 2010). Each test presents caveats, responding differently to sample size and departures from neutrality (selection) (Grant, 2015; Domingues et al., 2018). They also provide information about different evolutionary periods. Despite some contrasting results between different analyses, most species showed stable or expanding populations. The high connectivity across sites and the West Atlantic climate stability could explain the population stability found in 15 species (BSP results).
Coastal-dependent species may have been subject to more population bottlenecks followed by expansion in response to past sea level declines (Ludt, Rocha, 2015; Domingues et al., 2018). However, the only species that showed consistent evidence of population expansion was L. campechanus, which is not dependent on coastal habitats and is found in waters more than 300 m deep (Froese, Pauly, 2000) The distribution of L. campechanus is primarily tropical and is associated with warmer waters (Froese, Pauly, 2000). Contrary to expectations, its expansion could have been due to environmental changes related to sea level changes and increased habitat availability given by the expanded continental shelf (Hoareau et al., 2013).
Here, we provided helpful information for managing marine fisheries resources in Brazil. The results suggest that the Brazilian marine environment can be managed as a single unit for its fished species, although the relatively low levels of genetic diversity could indicate the need for management strategies. Protective management is even more relevant for species with the lowest levels of genetic diversity that additionally are already experiencing population reductions or lacking sufficient data. Based on both our findings of low genetic diversity (below 0.002) and threatened status (Population trend, Exploitation status as overexploited, and Red List classification as Vulnerable, Near Threatened or Data Deficient), we recommend prioritizing the following species: Cephalopholis fulva (Cytb-ð = 0.00118), Conodon nobilis (COI-ð = 0.0003), Lutjanus synagris (Cytb-ð = 0.00108), and Ocyurus chrysurus (COI-ð = 0.00137). Furthermore, species considered threatened under at least two of these categories and exhibiting relatively low nucleotide diversity (between 0.002 and 0.003), such as Lopholatilus villarii and Lutjanus analis, should also be managed with precaution. It is important to remember that low levels of genetic structure may not have been detected (Mariani et al., 2005) with the markers used. Subtler levels of differentiation could be detected using more variable and multilocus markers (e.g., microsatellites, SNPs; Xue et al., 2014; Drinan et al., 2018). Mitochondrial DNA is traditionally used to identify management units, but applying different markers can yield finer-grained insights into genetic connectivity (e.g., Knutsen et al., 2003; Nielsen et al., 2004). Although our study presents some methodological caveats (e.g., low sample size and the spatial arrangement of the data), this is the first available information on the genetic structure of many species along the Brazilian coastline. This baseline information could be applied in evolutionary and molecular systematics studies in addition to management strategies and conservation efforts.
Acknowledgments
JTV was funded by Coordenação de Aperfeiçoamento de Pessoal de Nível Superior (CAPES) with a PhD scholarship. PFML and SMQL thank CNPq for a productivity grant (302365/2022–2 and 312066/2021–0, respectively). ASC was funded by grants from CNPq (productivity proc 303300/2019–1) and FAPERJ (CNE proc E26/201.019/2022). We also thank the Graduate Program in Ecology at UFRN for the infrastructural support. This study was partially financed by the CAPES – Finance Code 001. JTV and SMQL designed the study. ASC and SMQL provided part of the data. JTV analyzed the data and wrote the manuscript. AS contributed by reviewing the text and making analysis suggestions. All authors reviewed the manuscript.
References
Araujo GS, Rocha LA, Lastrucci NS, Luiz OJ, Di Dario F, Floeter SR. The Amazon-Orinoco Barrier as a driver of reef-fish speciation in the Western Atlantic through time. J Biogeogr. 2022; 49(8):1407–19. https://doi.org/10.1111/jbi.14398
Baggio RA, Stoiev SB, Spach HL, Boeger WA. Opportunity and taxon pulse: the central influence of coastal geomorphology on genetic diversification and endemism of strict estuarine species. J Biogeogr. 2017; 44(7):1626–39. https://doi.org/10.1111/jbi.12934
Bah T. Inkscape: guide to a vector drawing program (Digital Short Cut). Pearson Education; 2009.
Bailey C. The political economy of fisheries development in the third world. Agric Hum Values. 1988; 5(1):35–48. https://doi.org/10.1007/BF02217175
Bermingham E. Fish biogeography and molecular clocks: perspectives from the Panamanian Isthmus. Mol Syst Fishes. 1997; 113–28. https://doi.org/10.1016/b978-012417540-2/50009-9
Bertola LD, Brüniche-Olsen A, Kershaw F, Russo IR, MacDonald AJ, Sunnucks P et al. A pragmatic approach for integrating molecular tools into biodiversity conservation. Conserv Sci Pract. 2024; 6(1):e13053. https://doi.org/10.1111/csp2.13053
Bohonak AJ. Dispersal, gene flow, and population structure. Q Rev Biol. 1999; 74(1):21–45. https://doi.org/10.1086/392950
Bowen BW, Rocha LA, Toonen RJ, Karl SA. The origins of tropical marine biodiversity. Trends Ecol Evol. 2013; 28(6):359–66. https://doi.org/10.1016/j.tree.2013.01.018
Brown JH, Lomolino MV. Biogeography [Internet]. 2nd ed. Sinuer Associates Publishers; 1998. Available from: https://experts.esf.edu/esploro/outputs/book/Biogeography/99885909704826
Brüniche-Olsen A, Kellner KF, Belant JL, DeWoody JA. Life-history traits and habitat availability shape genomic diversity in birds: implications for conservation. Proc R Soc B Biol Sci. 2021; 288(1961):20211441. https://doi.org/10.1098/rspb.2021.1441
Bucklin A, Wiebe P. Low mitochondrial diversity and small effective population sizes of the copepods Calanus finchicus and Nannocalanus minor: possible impact of climatic variation during recent glaciation. J Hered. 1998; 89(5):383–92. https://doi.org/10.1093/jhered/89.5.383
Coelho JFR, Mendes LF, Di Dario F, Carvalho PH, Dias RM, Lima SMQ et al. Integration of genomic and ecological methods inform management of an undescribed, yet highly exploited, sardine species. Proc R Soc B Biol Sci. 2024; 291(2018):20232746. https://doi.org/10.1098/rspb.2023.2746
Coelho-Souza SA, López MS, Guiães JR, Coutinho R, Candella RN. Biophysical interactions in the Cabo Frio upwelling system, southeastern Brazil. Universidade de São Paulo, Instituto Oceanográfico; 2012. https://doi.org/10.1590/s1679-87592012000300008
Convention on Biological Diversity (CBD). Fifteenth meeting of the Conference of the Parties (COP 15). Held in two parts: Virtual sessions from October 11-15, 2021, and in-person meetings from December 7-19, 2022, in Montreal, Canada; 2022.
Cord I, Nunes LT, Barroso CX, Freire AS, Gadig OB, Gomes PB et al. Brazilian marine biogeography: a multi-taxa approach for outlining sectorization. Mar Biol. 2022; 169(5):61. https://doi.org/10.1007/s00227-022-04045-8
Costa TL, Petean FF, Berbel-Filho WM, Solé-Cava AM, Mendes LF, Lima SM. Molecular testing of the São Francisco River as an ecological filter for the Brazilian large-eyed stingray Hypanus marianae (Dasyatidae, Myliobatiformes). Hydrobiologia. 2022; 849(11):2435–48. https://doi.org/10.1007/s10750-022-04828-6
Cowen RK, Sponle S. Larval dispersal and marine population connectivity. Annu Rev Sci. 2009; 15(1):443–66. https://doi.org/10.1146/annurev.marine.010908.163757
Davanso TM, Hirose GL, Herrera DR, Fransozo A, Costa RC. Does the upwelling phenomenon influence the population dynamics and management of the seabob shrimp Xiphopenaeus kroyeri (Heller, 1862) (Crustacea, Penaeidae)? Hydrobiologia. 2017; 795:295–311. https://doi.org/10.1007/s10750-017-3152-0
Domingues RR, Hilsdorf AWS, Shivji MM, Hazin FVH, Gadig OBF. Effects of the Pleistocene on the mitochondrial population genetic structure and demographic history of the silky shark (Carcharhinus falciformis) in the western Atlantic Ocean. Rev Fish Biol Fish. 2018; 28(1):213–27. https://doi.org/10.1007/s11160-017-9504-z
Drinan DP, Gruenthal KM, Canino MF, Lowry D, Fisher MC, Hauser L. Population assignment and local adaptation along an isolation-by-distance gradient in Pacific cod (Gadus macrocephalus). Evol Appl. 2018; 11(8):1448–64. https://doi.org/10.1111/eva.12639
Drummond AJ, Bouckaert RR. Bayesian evolutionary analysis with BEAST. Cambridge University Press; 2015.
Excoffier L, Lischer HEL. Arlequin suite ver 3.5: a new series of programs to perform population genetics analyses under Linux and Windows. Mol Ecol Resour. 2010; 10(3):564–67. https://doi.org/10.1111/j.1755-0998.2010.02847.x
Eytan RI, Hellberg ME. Nuclear and mitochondrial sequence data reveal and conceal different demographic histories and population genetic processes in Caribbean reef fishes. Evolution. 2010; 64(12):3380–97. https://doi.org/10.1111/j.1558-5646.2010.01071.x
Food and Agriculture Organization (FAO). The state of world fisheries and aquaculture 2012. Rome, London: Food and Agriculture Organization of the United Nations; Eurospan [distributor]; 2012.
Ford MJ. Selection in captivity during supportive breeding reduce fitness in the wild. Conserv Biol. 2002; 16(3):815–25. https://doi.org/10.1046/j.1523-1739.2002.00257.x
Frankham R. Effective population size/adult population size ratios in wildlife: a review. Genet Res. 1995; 66(2):95–107. https://doi.org/10.1017/S0016672300034455
Froese R, Pauly D. FishBase 2000: concepts, design and data sources. Los Baños, Laguna, Philippines: ICLARM; 2000.
Fu YX. Statistical tests of neutrality of mutations against population growth, hitchhiking and background selection. Genetics. 1997; 147(2):915–25. https://doi.org/10.1093/genetics/147.2.915
Gaggiotti OE, Bekkevold D, Jørgensen HBH, Foll M, Carvalho GR, Andre C et al. Disentangling the effects of evolutionary, demographic, and environmental factors influencing genetic structure of natural populations: Atlantic herring as a case study. Evolution. 2009; 63(11):2939–51. https://doi.org/10.1111/j.1558-5646.2009.00779.x
Gama-Maia DJ, Calado LL, Bitencourt JA, Affonso PRAM, Souza G, Torres RA et al. Multispecies genetic approach reveals divergent connectivity patterns in marine fish from Western Atlantic. Biodivers. 2024; 54(1):4. https://doi.org/10.1007/s12526-023-01399-0
Girden ER. ANOVA: Repeated Measures. SAGE; 1992.
Grant WS. Problems and cautions with sequence mismatch analysis and bayesian skyline plots to infer historical demography. J Hered. 2015; 106(4):333–46. https://doi.org/10.1093/jhered/esv020
Hauser L, Adcock GJ, Smith PJ, Bernal Ramírez JH, Carvalho GR. Loss of microsatellite diversity and low effective population size in an overexploited population of New Zealand snapper (Pagrus auratus). Proc Natl Acad Sci. 2002; 99(18):11742–47. https://doi.org/10.1073/pnas.172242899
Hauser L, Carvalho GR. Paradigm shifts in marine fisheries genetics: ugly hypotheses slain by beautiful facts. Fish Fish. 2008; 9(4):333–62. https://doi.org/10.1111/j.1467-2979.2008.00299.x
Hewitt GM. Genetic consequences of climatic oscillations in the Quaternary. Philos Trans R Soc Lond B Biol Sci. 2004; 359(1442):183–95. https://doi.org/10.1098/rstb.2003.1388
Hoareau TB, Boissin E, Paulay G, Bruggemann JH. The Southwestern Indian Ocean as a potential marine evolutionary hotspot: perspectives from comparative phylogeography of reef brittle-stars. J Biogeogr. 2013; 40(11):2167–79. https://doi.org/10.1111/jbi.12155
Hoban S, Bruford MW, Funk WC, Galbusera P, Griffith MP, Grueber CE et al. Global commitments to conserving and monitoring genetic diversity are now necessary and feasible. BioScience. 2021; 71(9):964–76. https://doi.org/10.1093/biosci/biab054
Hoban S, Hvilsom C, Abdeldjalil A, Aleixo A, Biala K, Ekblom R et al. How can biodiversity strategy and action plans incorporate genetic diversity concerns, plans, policies, capacity, and commitments? 2024. Available from: https://ecoevorxiv.org/repository/view/6973/
Ivanova NV, Zemlak TS, Hanner RH, Hebert PDN. Universal primer cocktails for fish DNA barcoding. Mol Ecol Notes. 2007; 7(4):544–48. https://doi.org/10.1111/j.1471-8286.2007.01748.x
International Union for Conservation of Nature (IUCN). The IUCN Red List of Threatened Species. 2019. Available from: https://www.iucnredlist.org
Jenkins TL, Castilho R, Stevens JR. Meta-analysis of northeast Atlantic marine taxa shows contrasting phylogeographic patterns following post-LGM expansions. PeerJ. 2018; 6:e5684. https://doi.org/10.7717/peerj.5684
Jones GP, Milicich MJ, Emslie MJ, Lunow C. Self-recruitment in a coral reef fish population. Nature. 1999; 402(6763):802–04. https://doi.org/10.1038/45538
Knutsen H, Jorde PE, André C, Stenseth N. Fine-scaled geographical population structuring in a highly mobile marine species: the Atlantic cod. Mol Ecol. 2003; 12(2):385–94. https://doi.org/10.1046/j.1365-294X.2003.01750.x
Kottillil S, Rao C, Bowen BW, Shanker K. Phylogeography of sharks and rays: a global review based on life history traits and biogeographic partitions. PeerJ. 2023; 11:e15396. https://doi.org/10.7717/peerj.15396
Lehnert SJ, DiBacco C, Van Wyngaarden M, Jeffery NW, Ben Lowen J, Sylvester EVA et al. Fine-scale temperature-associated genetic structure between inshore and offshore populations of sea scallop (Placopecten magellanicus). Heredity. 2019; 122(1):69–80. https://doi.org/10.1038/s41437-018-0087-9
Leigh JW, Bryant D. POPART: full‐feature software for haplotype network construction. 2015; 6(9). https://doi.org/10.1111/2041-210X.12410
Librado P, Rozas J. DnaSP v5: a software for comprehensive analysis of DNA polymorphism data. Bioinformatics. 2009; 25(11):1451–52. https://doi.org/10.1093/bioinformatics/btp187
Ludt WB, Rocha LA. Shifting seas: the impacts of Pleistocene sea-level fluctuations on the evolution of tropical marine taxa. J Biogeogr. 2015; 42(1):25–38. https://doi.org/10.1111/jbi.12416
Luiz OJ, Allen AP, Robertson DR, Floeter SR, Kulbicki M, Vigliola L et al. Adult and larval traits as determinants of geographic range size among tropical reef fishes. Proc Natl Acad Sci. 2013; 110(41):16498–502. https://doi.org/10.1073/pnas.1304074110
Mariani S, Hutchinson WF, Hatfield EMC, Ruzzante DE, Simmonds EJ, Dahlgren TG et al. North Sea herring population structure revealed by microsatellite analysis. Ecol Prog Ser. 2005; 303:245–57.
Martinez AS, Willoughby JR, Christie MR. Genetic diversity in fishes is influenced by habitat type and life-history variation. Ecol Evol. 2018; 8(23):12022–31. https://doi.org/10.1002/ece3.4661
Martins NT, Macagnan LB, Cassano V, Gurgel CFD. Brazilian marine phylogeography: a literature synthesis and analysis of barriers. Mol Ecol. 2022; 31(21):5423–39. https://doi.org/10.1111/mec.16684
Nielsen EE, Nielsen PH, Meldrup D, Hansen MM. Genetic population structure of turbot (Scophthalmus maximus L.) supports the presence of multiple hybrid zones for marine fishes in the transition zone between the Baltic Sea and the North Sea. Mol Ecol. 2004; 13(3):585–95. https://doi.org/10.1046/j.1365-294X.2004.02097.x
O’Brien SM, Gallucci VF, Hauser L. Effects of species biology on the historical demography of sharks and their implications for likely consequences of contemporary climate change. Conserv Genet. 2013; 14(1):125–44. https://doi.org/10.1007/s10592-012-0437-8
O’Connor MI, Bruno JF, Gaines SD, Halpern BS, Lester SE, Kinlan BP et al. Temperature control of larval dispersal and the implications for marine ecology, evolution, and conservation. Proc Natl Acad Sci. 2007; 104(4):1266–71. https://doi.org/10.1073/pnas.060342210
Okello JBA, Wittemyer G, Rasmussen HB, Arctander P, Nyakaana S, Douglas-Hamilton I et al. Effective population size dynamics reveal impacts of historic climatic events and recent anthropogenic pressure in African elephants. Mol Ecol. 2008; 17(17):3788–99. https://doi.org/10.1111/j.1365-294X.2008.03871.x
Ovenden JR, Berry O, Welch DJ, Buckworth RC, Dichmont CM. Ocean’s eleven: a critical evaluation of the role of population, evolutionary and molecular genetics in the management of wild fisheries. Fish Fish. 2015; 16(1):125–59. https://doi.org/10.1111/faf.12052
Ovenden JR, Peel D, Street R, Courtney AJ, Hoyle SD, Peel SL et al. The genetic effective and adult census size of an Australian population of tiger prawns (Penaeus esculentus). Mol Ecol. 2007; 16(1):127–38. https://doi.org/10.1111/j.1365-294X.2006.03132.x
Palumbi SR. Genetic divergence, reproductive isolation, and marine speciation. Annu Rev Ecol Evol Syst. 1994; 25:547–72.
Palumbi SR. Molecular biogeography of the Pacific. Coral Reefs. 1997; 16(1):47–52. https://doi.org/10.1007/s003380050241
Peluso L, Broitman BR, Lardies MA, Nespolo RF, Saenz-Agudelo P. Comparative population genetics of congeneric limpets across a biogeographic transition zone reveals common patterns of genetic structure and demographic history. Mol Ecol. 2023; 32(14):3812–25. https://doi.org/10.1111/mec.16978
Peres PA, Lopes M, Negri M, Robles R, Santos CRM, Mantelatto FL. Lack of population genetic structure among Brazilian populations of Callinectes danae (Brachyura: Portunidae): implication for management and conservation. Reg Stud Sci. 2020; 37:101336. https://doi.org/10.1016/j.rsma.2020.101336
Petit-Marty N, Vázquez-Luis M, Hendriks IE. Use of the nucleotide diversity in COI mitochondrial gene as an early diagnostic of conservation status of animal species. Conserv Lett. 2021; 14(1):e12756. https://doi.org/10.1111/conl.12756
Pinheiro HT, Rocha LA, Macieira RM, Carvalho‐Filho A, Anderson AB, Bender MG et al. South‐western Atlantic reef fishes: zoogeographical patterns and ecological drivers reveal a secondary biodiversity centre in the Atlantic Ocean. Divers Distrib. 2018; 24(7):951–65. https://doi.org/10.1111/ddi.12729
Queiroz-Brito MCG, Machado CB, Maia DJG, Jacobina UP, Nirchio M, Rotundo MM et al. DNA barcoding reveals deep divergent molecular units in Pomatomus saltatrix (Perciformes: Pomatomidae): implications for management and global conservation. J Biol Assoc U K. 2022; 102(1–2):139–51. https://doi.org/10.1017/S0025315422000236
Ramos-Onsins SE, Rozas J. Statistical properties of new neutrality tests against population growth. Mol Biol Evol. 2002; 19(12):2092–100. https://doi.org/10.1093/oxfordjournals.molbev.a004034
Reed JM, Mills LS, Dunning Jr. JB, Menges ES, McKelvey KS, Frye R et al. Emerging issues in population viability analysis. Conserv Biol. 2002; 16(1):7–19. https://doi.org/10.1046/j.1523-1739.2002.99419.x
Riginos C, Buckley YM, Blomberg SP, Treml EA. Dispersal capacity predicts both population genetic structure and species richness in reef fishes. Am Nat. 2014; 184(1):52–64. https://doi.org/10.1086/676505
Riginos C, Nachman MW. Population subdivision in marine environments: the contributions of biogeography, geographical distance and discontinuous habitat to genetic differentiation in a blennioid fish, Axoclinus nigricaudus. Mol Ecol. 2001; 10(6):1439–53. https://doi.org/10.1046/j.1365-294X.2001.01294.x
Roberts CM, McClean CJ, Veron JEN, Hawkins JP, Allen GR, McAllister DE et al. Marine biodiversity hotspots and conservation priorities for tropical reefs. Science. 2002; 295(5558):1280–84. https://doi.org/10.1126/science.1067728
Rocha LA, Robertson DR, Roman J, Bowen BW. Ecological speciation in tropical reef fishes. Proc R Soc B. 2005; 272(1563):573–79. https://doi.org/10.1098/2004.3005
Romiguier J, Gayral P, Ballenghien M, Bernard A, Cahais V, Chenuil A et al. Comparative population genomics in animals uncovers the determinants of genetic diversity. Nature. 2014; 515(7526):261–63. https://doi.org/10.1038/nature13685
Silva R, Veneza I, Sampaio I, Araripe J, Schneider H, Gomes G. High levels of genetic connectivity among populations of Yellowtail Snapper, Ocyurus chrysurus (Lutidae – Perciformes), in the Western South Atlantic revealed through multilocus analysis. PLoS ONE. 2015; 10(3):e0122173. https://doi.org/10.1371/journal.pone.0122173
Silva-Oliveira GC, Rêgo PS, Schneider H, Sampaio I, Vallinoto M. Genetic characterisation of populations of the critically endangered Goliath grouper (Epinephelus itajara, Serranidae) from the Northern Brazilian coast through analyses of mtDNA. Genet Mol Biol. 2008; 31(4):988–94. https://doi.org/10.1590/S1415-47572008005000016
Sjöqvist C, Godhe A, Jonsson PR, Sundqvist L, Kremp A. Local adaptation and oceanographic connectivity patterns explain genetic differentiation of a marine diatom across the North Sea-Baltic Sea salinity gradient. Mol Ecol. 2015; 24(11):2871–85. https://doi.org/10.1111/mec.13208
Sotelo CG, Calo-Mata P, Chapela MJ, Pérez-tín RI, Rehbein H, Hold GL et al. Identification of flatfish (Pleuronectiforme) species using DNA-based techniques. J Agric Food Chem. 2001; 49(10):4562–69. https://doi.org/10.1021/jf010452a
Spalding MD, Fox HE, Allen GR, Davidson N, Ferdaña ZA, Finlayson M et al. Marine ecoregions of the world: a bioregionalization of coastal and shelf areas. BioScience. 2007; 57(7):573–83. https://doi.org/10.1641/B570707
Student S. The probable error of a mean. Biometrika. 1908; 6(1):1–25. https://doi.org/10.2307/2331554
Tajima F. The effect of change in population size on DNA polymorphism. Genetics. 1989; 123(3):597–601. https://doi.org/10.1093/genetics/123.3.597
Tamura K, Dudley J, Nei M, Kumar S. MEGA4: Molecular evolutionary genetics analysis (MEGA) software version 4.0. Mol Biol Evol. 2007; 24(8):1596–99. https://doi.org/10.1093/molbev/msm092
Verba JT, Ferreira CEL, Pennino MG, Hagberg L, Lopes PFM, Padovani Ferreira B et al. Genetic structure of the threatened gray parrotfish (Sparisoma axillare) in the Southwestern Atlantic. Coral Reefs. 2023; 42(1):105–17. https://doi.org/10.1007/s00338-022-02324-w
Verba JT, Pennino MG, Coll M, Lopes PFM. Assessing drivers of tropical and subtropical marine fish collapses of Brazilian Exclusive Economic Zone. Sci Total Environ. 2020; 702:134940. https://doi.org/10.1016/j.scitotenv.2019.134940
Verba JT, Stow A, Bein B, Pennino MG, Lopes PFM, Ferreira BP et al. Low population genetic structure is consistent with high habitat connectivity in a commercially important fish species (Lutjanus jocu). Biol. 2022; 170(1):5. https://doi.org/10.1007/s00227-022-04149-1
Villela LB, Carvalho PH, Vilasboa A, Rodríguez-Rey GT, Henning F, Grothues T et al. Deep genetic divergence among bluefish (Pomatomus saltatrix) of the Southwestern Atlantic. Zool Scr. 2024; 53(5):555–70. https://doi.org/10.1111/zsc.12662
Volk DR, Konvalina JD, Floeter SR, Ferreira CE, Hoffman EA. Going against the flow: Barriers to gene flow impact patterns of connectivity in cryptic coral reef gobies throughout the western Atlantic. J Biogeogr. 2021; 48(2):427–39. https://doi.org/10.1111/jbi.14010
Waples RS, Punt AE, Cope JM. Integrating genetic data into management of marine resources: how can we do it better? Fish Fish. 2008; 9(4):423–49. https://doi.org/10.1111/j.1467-2979.2008.00303.x
White C, Selkoe KA, Watson J, Siegel DA, Zacherl DC, Toonen RJ. Ocean currents help explain population genetic structure. Proc R Soc B Biol Sci. 2010; 277(1688):1685–94. https://doi.org/10.1098/rspb.2009.2214
Xue DX, Wang HY, Zhang T, Liu JX. Population genetic structure and demographic history of Atrina pectinata based on mitochondrial DNA and microsatellite markers. PLoS ONE. 2014; 9(5):e95436. https://doi.org/10.1371/journal.pone.0095436
Authors

![]() Julia Tovar Verba1,2,3,4
Julia Tovar Verba1,2,3,4 ![]() ,
, ![]() Adam Stow2,
Adam Stow2, ![]() Priscila F. M. Lopes1,3,
Priscila F. M. Lopes1,3, ![]() Maria Grazia Pennino3,5,
Maria Grazia Pennino3,5, ![]() Antonio Sole-Cava6 and
Antonio Sole-Cava6 and ![]() Sergio Maia Queiroz Lima7
Sergio Maia Queiroz Lima7
[1] Programa de Pós-Graduação em Ecologia, Universidade Federal do Rio Grande do Norte, 59078-970 Natal, RN, Brazil. (JTV) juliatovarv@gmail.com (corresponding author), (PFML) prilopes.ufrn@gmail.com.
[2] Conservation Genetics Lab, Macquarie University, Sydney NSW 2109, Australia. (AS) adam.stow@mq.edu.au.
[3] Ecologia, Gestão e Economia de Pesca, Departamento de Ecologia, Universidade Federal do Rio Grande do Norte, 59078-970 Natal, RN, Brazil. (MGP) graziapennino@yahoo.it.
[4] Division of Evolutionary Biology, Faculty of Biology, Ludwig-Maximilians-Universität München, Planegg-Martinsried 82152, Germany.
[5] Instituto Español de Oceanografía/Consejo Superior de Investigaciones Científicas, Madrid, 28002, Spain.
[6] Departamento de Genética, Universidade Federal do Rio de Janeiro, Ilha do Fundão, 21941-617 Rio de Janeiro, RJ, Brazil. (ASC) sole@biologia.ufrj.br.
[7] Laboratório de Ictiologia Sistemática e Evolutiva, Universidade Federal do Rio Grande do Norte, 59078-970 Natal, RN, Brazil. (SMQL) sergio.lima@ufrn.br.
Authors’ Contribution 

Julia Tovar Verba: Conceptualization, Formal analysis, Investigation, Methodology, Project administration, Software, Visualization, Writing-original draft, Writing-review and editing.
Adam Stow: Supervision, Writing-review and editing.
Priscila F. M. Lopes: Supervision, Writing-review and editing.
Maria Grazia Pennino: Writing-review and editing.
Antonio Sole-Cava: Conceptualization, Data curation, Funding acquisition, Supervision, Writing-review and editing.
Sergio Maia Queiroz Lima: Conceptualization, Supervision, Writing-review and editing.
Ethical Statement
Not applicable.
Competing Interests
The author declares no competing interests.
How to cite this article
Verba JT, Stow A, Lopes PFM, Pennino MG, Sole-Cava A, Lima SMQ. No genetic structure detected in multiple Brazilian marine fish species. Neotrop Ichthyol. 2025; 23(2):e240068. https://doi.org/10.1590/1982-0224-2024-0068
Copyright
This is an open access article under the terms of the Creative Commons Attribution License, which permits use, distribution and reproduction in any medium, provided the original work is properly cited.
Distributed under
Creative Commons CC-BY 4.0

© 2025 The Authors.
Diversity and Distributions Published by SBI
![]() Accepted March 24, 2025
Accepted March 24, 2025
![]() Submitted July 18, 2024
Submitted July 18, 2024
![]() Epub June 30, 2025
Epub June 30, 2025