
 Valdenor Magalhães1
  Nasrah Muhammad Calderaro Handam2, Micael Cavalli3, Izeni Pires Farias2,4 and Lúcia Rapp Py-Daniel3
PDF: Download Here | Supplementary: Sup | Cite this article
Associate Editor: Claudio Oliveira
Section Editor: William Crampton
Editor-in-chief: José Birindelli
Abstract
O pirarucu ou Arapaima é uma das poucas linhagens de Osteoglossomorfos na Amazônia e o maior peixe de água doce da América do Sul. Apesar de sua importância econômica e evolutiva, sua taxonomia e status de conservação ainda são debatidos. Estudos moleculares anteriores mostraram pouca variação genética entre populações de indivíduos identificados como Arapaima gigas, frequentemente carecendo de dados morfológicos e informações precisas sobre a localidade. Este estudo fornece a primeira análise integrada de morfologia e genética para esta espécie icônica. Dados morfológicos, morfométricos e genéticos foram obtidos de espécimes coletados em quatro localidades amazônicas, alto rio Solimões, rio Juruá, rio Purus e baixo Amazonas (Santarém), abrangendo mais de 1.000 km do sistema Solimões-Amazonas. Noventa espécimes foram coletados sob as diretrizes de manejo vigentes; 82 foram fotografados e medidos para análises de componentes principais e discriminantes, e 70 foram analisados geneticamente utilizando o marcador mitocondrial COI. Estudos anatômicos e osteológicos foram realizados em 15 espécimes esqueletizados. Os resultados confirmam baixa divergência genética entre as populações, mas revelam considerável variação morfológica. Para fins de estabilidade taxonômica e avaliação de conservação, todos os espécimes analisados são considerados Arapaima gigas. Essas descobertas são discutidas em comparação com os dados disponíveis, embora limitados, sobre outras espécies nominais de Arapaima recentemente revalidadas.
Palavras-chave: Conservação, Diversidade genética, Pirarucu, Taxonomia.
Introduction
The pirarucu (paiche in Peru and Bolivia) Arapaima gigas (Schinz, 1822), is an emblematic Amazon fish and it is being intensely studied in order to raise information about its conservation. Considered historically the most important fish in Amazon fisheries until the middle of the 20th century, its presence in the diet of Amerindians (Veríssimo, 1895) and by Spanish and Portuguese colonizers, as well as the impact of overfishing during decades is well summarized in Hrbek et al. (2005). The strong decline of pirarucu in markets around the 1970s raised concerns about the survival of the species in nature (CITES) (Mueller, Green, 2006; Viana et al., 2007). Listed as Vulnerable (VU) by the IUCN (International Union for Conservation of Nature) in 1986 and 1988, the fisheries aiming pirarucu were finally regulated by IBAMA (Instituto Brasileiro do Meio Ambiente e dos Recursos Naturais Renováveis) in 1989. Under this regulation, only specimens above 150 mm Total or Standard Length could be captured and fishing was forbidden during the reproductive period of the species (“defeso”) (Amaral, 2009; Amaral et al., 2011). Unfortunately, without law reinforcement and control, these measures showed no success in protecting the fish. Only in 1996, the IBAMA prohibited any fishing or capture and commercialization of pirarucu, except in areas with some sort of management of the natural populations. The amount of knowledge compiled on the biology, ecology, and population dynamics provided the grounds for a very successful management and a positive answer from natural populations of pirarucu to all these efforts (Queiroz, 2000; Arantes et al.,2006; Castello, 2008; Arantes et al., 2010; Castello et al.,2013), with the populations showing a clear recovery in many formerly depleted areas.
Besides its importance for fisheries, Arapaima gigas has evolutionary importance among Actinopterygii, being the solely extant representative of a very old lineage within Osteoglossomorpha in the Neotropics, along with its distantly-related Osteoglossum (“arowana”). Due to a unique configuration of the occipital region that provide a prompt identification in the fossil record (Hilton, Lavoué, 2018), a representative of Arapaima was recorded from alto rio Magdalena, belonging to the Honda Group Strata (La Venta Fauna) in Colombia, from the late Miocene (Lundberg, Chernoff, 1992), and it was considered very similar to the recent forms.
Following Hilton, Lavoué (2018) classification, the genus Arapaima, together with the African genus Heterotis, is herein considered included in the family Osteoglossidae, and subfamily Arapaiminae. The subfamily Osteoglossinae would comprise only Osteoglosssum and the non-Neotropical genus (Scleropages). However, studies using molecular data suggest the separation of Arapaimidae and Osteoglossidae as two distinct families within Osteoglossiformes (Tagliacollo et al., 2024). Arapaima had been considered monotypic for a long time until Stewart (2013a,b) raised the possibility of validation of Arapaima agassizii (Valenciennes, 1847), A. mapae (Valenciennes, 1847),and A. arapaima (Valenciennes, 1847). Stewart (2013a) presented a rationale for revalidating the species formerly synonymized in A. gigas and provided a tentative morphological reconstruction of the holotype of A. agassizii based on osteological illustrations (Spix, Agassiz, 1829). In this same paper, Stewart reports on future redescriptions of A. gigas, A. mapae,and A. arapaima. In a subsequent paper in the same year, Stewart (2013b) describes a new species of Arapaima, A. leptosoma, based on a single subadult specimen of 77.6 mm SL collected in the rio Solimões close to the confluence with the rio Purus, Amazonas State, Brazil (Tab. 1).
TABLE 1 | Valid species of Arapaima (Stewart, 2013a,b; Fricke et al., 2025).
Taxon | Type locality |
Arapaima agassizi (Valenciennes, 1847) | Brazilian Amazon, holotype destroyed during WWII (Stewart, 2013) |
Arapaima arapaima (Valenciennes, 1847) | Rupununi River, Guyana (Fricke et al., 2024) |
Arapaima gigas (Schinz, 1822) | Pará State, Brazil, lower Amazon, around the city of Santarém (Stewart 2013a; Fricke et al., 2024) |
Arapaima leptosoma (Stewart, 2013) | Confluence region between the Purus and Solimões rivers (Stewart, 2013) |
Arapaima mapae (Valenciennes, 1847) | Amapá Lake, in Amapá State, Brazil (Stewart, 2013; Farias et al., 2019) |
The possibility of the existence of more than one species of a well-known and heavily threatened species, such as the pirarucu, raised immediate concern about which taxon was being so heavily exploited and what we knew about its genetic structure and which measures could be taken against its strong regional population depletions all over the Amazon. Since 2005, several other studies have brought a lot of information on the genetic structure of the pirarucu. Hrbek et al. (2005) developed the first populational study of pirarucu using mitochondrial markers and concluded that there was a large Amazonian population of one single species. Hrbek et al. (2008) used microsatellites and mtDNA from 126 specimens collected from different areas in the Amazon, and their results depicted extensive genetic flow that starts to show significant reduction with distances above 2,500 km between samples. Araripe et al. (2013) used microsatellites to analyze 561 specimens considering three levels of geographic distance: 25 km, 100 km and above 1,300 km. The authors detected relevant genetic differences only at the 3rd level, but also drew attention to the fluctuation of population size during a long historical period and to the sedentary behavior of the species.
Farias et al. (2019) used 11 DNA markers to estimate genetic variation and connectivity between different populations of Arapaima, sampled in different localities in three countries (Peru, Colombia, and Brazil). Again, the factor of distance made a difference. This study showed two main populations, one in the rio Amazonas that is genetically structured by distance (with different populations detected in samples more than 1,500 km apart) and another in the Araguaia-Tocantins basin. The authors did not find any evidence of the presence of different species among the samples. Nogueira et al. (2020a) used CytB, control region, COI, NADH subunit 2. and seven microsatellite loci to assess any genetic structure in populations of Arapaima from the Amazon and Araguaia-Tocantins basins and found no evidence for more than one species in the whole region. Watson et al.(2016), analyzing populations of pirarucu in Essequibo and Branco, based on microsatellites and mitochondrial sequences, detected a low genetic diversity in the rivers, which is less relevant than that found among Amazon populations in other studies. However, the authors recognized two sympatric genotypes and suggested that one of them could belong to A. arapaima, a nominal species of Arapaima described from the Rupununi (Cuvier, Valenciennes, 1847). Nonetheless, their results did not bring enough evidence to consider two recognized species among their samples.
Despite all these efforts on genetic studies of pirarucu populations, none of these were followed by a morphological account or comparison. Many of the genetically analyzed samples were obtained from markets and, consequently, uncertain localities.
In the present work, we aimed to genetically analyze pirarucu populations from distant Amazon areas, using COI, as well as to analyze this material morphologically, through morphometric analysis using corporal and meristic measures, as well as osteological features such as the number of vertebrae, number of ray fins, number of teeth, and shape of skull elements, among others. We aimed to answer the following questions: a. How do these distant pirarucu populations differ morphologically?; b. Is this difference, if any, related to genetic structure?; c. Are there morphological differences within these populations?; d. How are these differences related genetically?; e. Is geographic distance relevant for genetic and/or morphological differences?; f. Are we dealing with one or more species of Arapaima in these studied regions?
Material and methods
Sampling. For the present work, all pirarucu specimens were sampled in marginal ‘várzea’ lakes adjacent to the main stem of the Amazonas/Solimões system or in lakes connected to tributaries during the period of low waters, from September to November 2022 (Fig. 1). For the samples collected at lto rio Solimões, AM , rio Purus (Piagaçu-Purus Sustainable Development Reserve: RDS-PP) in Beruri-AM, rio Juruá in Carauari, AM and rio Amazonas in Santarém, PA (Tab. S1), it was possible to extract muscle tissue, acquire detailed images of the fishes and collect some specimens for osteological analyses. The second phase included tissue samples from localities at rio Unini, AM (rio Negro basin), lower Amazonas close to the estuary in the Marajó Island, Ilha da Mexiana, PA, rio Tocantins at Tucurui, PA and Biological Reserva (REBio) Lago Piratuba, AP, which are already deposited in the Laboratory of Evolution and Animal Genetics of the Universidade Federal do Amazonas, Manaus (UFAM). For the third phase, we used A. gigas COI DNA sequences from the rio Marañon basin in Peru obtained from GenBank (see Tab. S2).
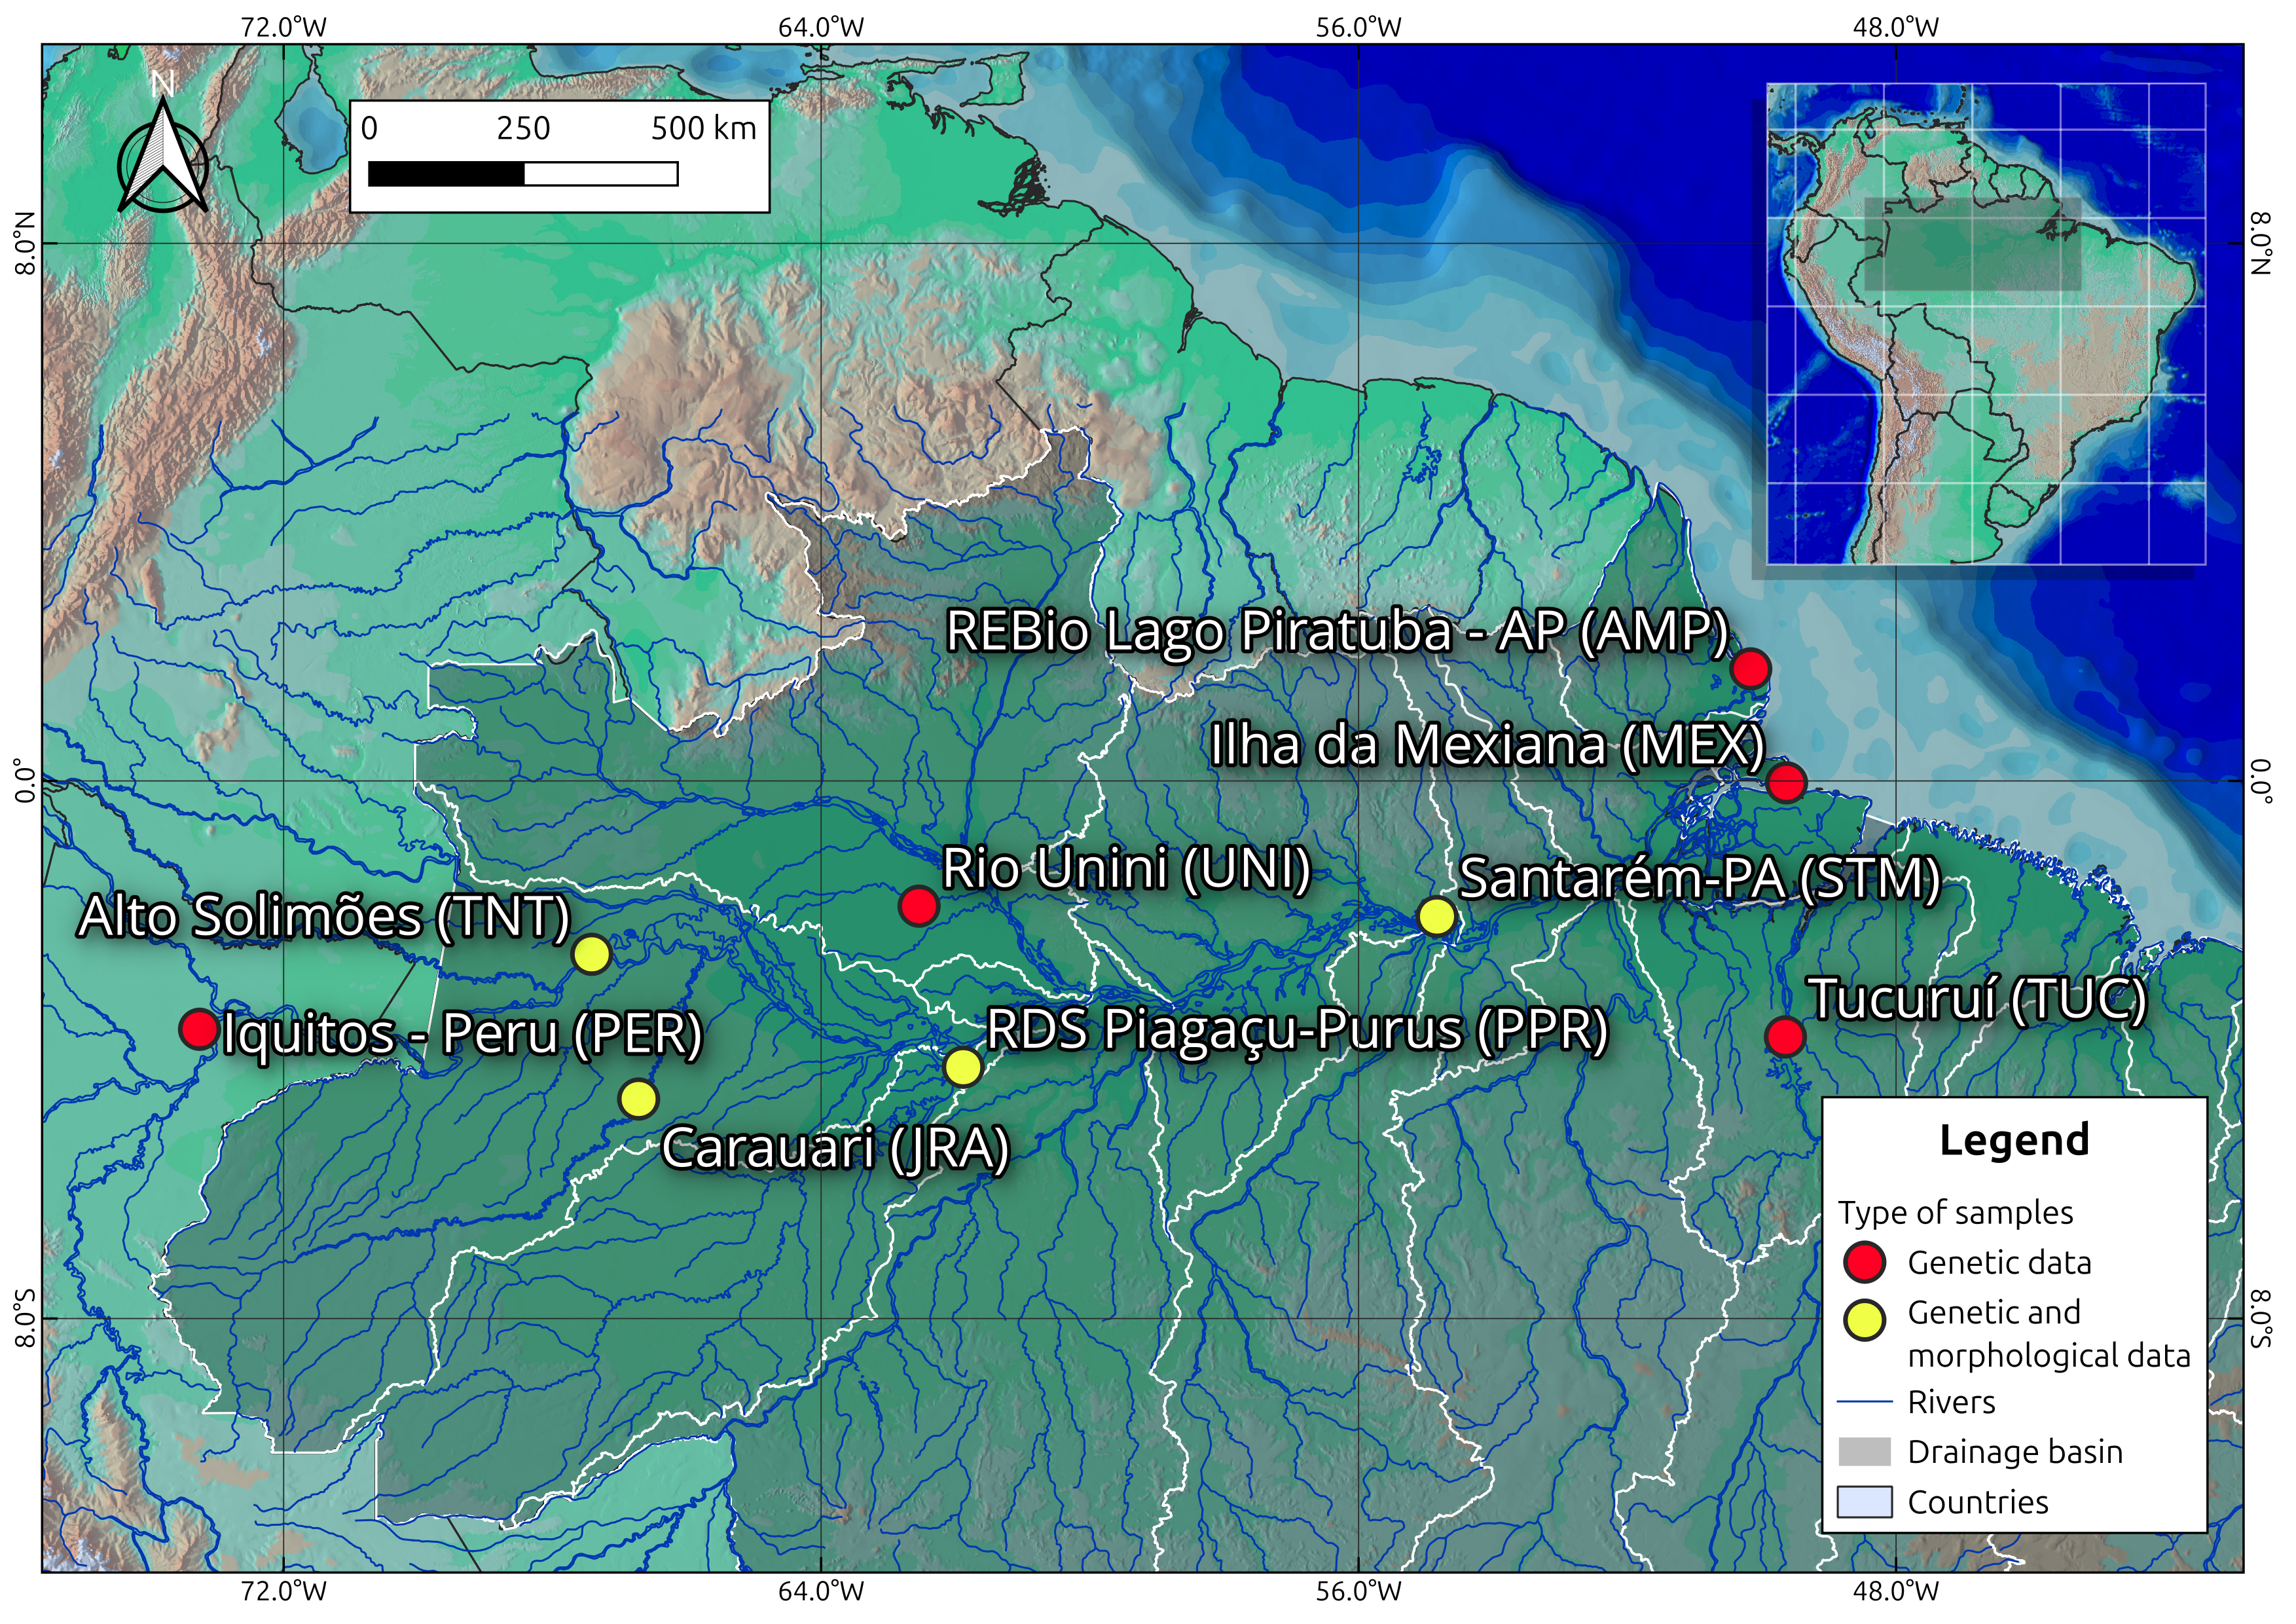
FIGURE 1| Location of sampling sites. Yellow dots indicate locations from which genetic and morphological data were obtained. Red dots indicate locations where only genetic data were obtained.
The COI sequences used were deposited in GenBank (https://www.ncbi.nlm.nih.gov/) and can be accessed using the access codes provided in Tab. S2. As managed fisheries allow only the collection of specimens above 150 cm SL, it was possible to obtain a number of very large specimens. Due to the difficulties of handling large specimens, a working-size range was established for obtaining the morphological data in the field. The selected specimens ranged from 100 to 170 cm SL. These specimens received a code for the tissue sample and were photographed with a NIKON D90 with an 18–50 mm lens. Images were taken in a standardized manner, with the specimens set in a millimetric sheet of paper 4×1 cm. From each specimen, five images were obtained: 1. body lateral view, 2. head lateral view, 3. head dorsal view, 4. head ventral view, and 5. caudal fin lateral view. Measurements were obtained in ImageJ, public domain, under the commands File > Open File > Select file folder > Select image > Straight > Analyze > Set Scale > Known Distance (1 mm) > Unit of length (mm) > Scale: Pixels/unit > Ok. Twenty-nine (29) morphometric measurements were taken from the images based in Stewart (2013a) with some modifications: Total length (TL), Standard length (SL), Predorsal length (PDL), dorsal fin base length (DBL), longest dorsal fin ray (LDR), Preanal length (PAL), anal fin base length (ABL), anal fin longest ray (LAR), prepelvic length (PPeL), prepectoral length (PPL), distance between origin of pectoral to origin of pelvic fin (PPD), body depth at pelvic fin origin (BDPe), distance between origin of pelvic to origin of dorsal fin (PDd), depth of caudal peduncle (CPD), caudal peduncle length (CPL), depth of caudal fin (CFD), head length (HL), head depth at occipital (HDOc), head depth at orbit (HDOr), head width at opercles (HWop), interorbital distance (IOD), internares distance (IND), orbit diameter (OD), snout length (SnL), preorbital length (POL), 4th infraorbital length (IO4L), postorbital length (pOL), skull length (SKL) and upper maxilla length (UML). All measurements were obtained in mm and presented as percentages of the SL.
The muscle tissue from each specimen was placed in 2 ml Eppendorf tubes containing 96% alcohol and stored at -20°C. DNA extraction followed the salt extraction protocol developed by Medrano et al. (1990) with some adaptations. However, we only used a representative number of individuals from each location for COI gene sequencing (Tab. 2). The COI gene (~614 bp) was amplified and sequenced according to the protocol established by Colatreli et al. (2012).
TABLE 2 | Number of samples used in molecular analyses, listed by location.
Location | Nº of samples | Coordinates |
Iquitos, Peru (PER) | 5 | 03°41’54.8”S 73°15’08.9”W |
Alto Solimões (TNT) | 9 | 02°34’58.3”S 67°24’49.9”W |
Carauari (JRA) | 13 | 04°44’11.7”S 66°42’57.1”W |
Tucuruí (TUC) | 5 | 03º48’44.1”S 49º38’33.1”W |
RDS Piagaçu-Purus (PPR) | 19 | 04°15’47.9”S 61°52’57.2”W |
Rio Unini (UNI) | 4 | 01°51’57.6”S 62°32’26.7”W |
Santarém-PA (STM) | 4 | 02°01’14.1”S 54°49’46.5”W |
Ilha da Mexiana (MEX) | 6 | 00°01’51.1”S 49°37’32.1”W |
REBio Lago Piratuba, Amapá (AMP) | 6 | 01°39’54.8”N 50°09’32.1”W |
The PCR (Polymerase Chain Reaction) was performed in a total volume of 15µL, including: 6.7µL of ddH2O, 1.2µL of MgCl2 (25 nM), 1.2µL of dNTP (10 mM), 1.5µL of 10x PCR Buffer (100 mM Tris-HCl, 500 mM KCl), 1.2µL of Primer COIFishF2, 1.2µL of Primer COIFishR1, 0.5µL of BSA, 0.5µL of Taq DNA Polymerase, and 1µL of DNA (concentration ranging between 50ng and 100ng). The thermal cycling for the PCR consisted of 1 cycle of denaturation at 93ºC for 60 sec, followed by 35 cycles of denaturation at 93ºC for 10 sec, annealing at 50ºC for 45 sec, extension at 72ºC for 60 sec, and a final extension at 72ºC for 10 min. The PCR products were purified using PEG 8000 (polyethylene glycol) and 80 % ethyl alcohol (Paithankar, Prasad, 1991). Sequence reactions were performed using the BigDye TM Terminator v. 3.1 Cycle Sequencing kit (Life Technologies), and sequencing was done on the ABI 3130XL sequencer. The obtained sequences were edited in BioEdit (Hall, 1999) and aligned in MEGA X (Kumar et al., 2018) using the ClustalW algorithm (Thompson et al., 1994).
Skeletal preparations followed Hall, Russell (1933) with modifications by De La Torre (1951). Specimens selected had all soft tissues removed and were posteriorly immersed in 96% alcohol for approximately seven days for grease removal. After that, the material was air-dried and then transferred for sealed plastic or wooden containers with domestic beetle (Dermestes maculatus) colonies to final cleaning. After complete removal of soft tissue, skeletons were maintained in freezers at -4º C for four to five days to interrupt the processing of tissue digestion by the beetles.
Data analysis. To calculate the genetic distances among all individuals, we used MEGA X (Kumar et al., 2018) employing the Kimura 2-parameter (K2P) model. This model is based on the assumption of interspecific distances of 2% or higher, as indicated by previous research on other groups of Neotropical fish (Castro Paz et al., 2014; Machado et al., 2018; Ota et al., 2020). For the analysis of population structuring and differentiation, we conducted an Analysis of Molecular Variance (AMOVA) and calculated the pairwise Fst index using ARLEQUIN v. 3.5 (Excoffier et al., 1992). We employed 1,000 permutations and considered a significance level of P < 0.05, in line with the differentiation levels proposed by Wright (1969). The Mantel test (Mantel, 1967) was implemented in Arlequin v. 3.5.2.2 (Excoffier, Lischer, 2015) to evaluate the significance of the association between the genetic distance matrix (using the pairwise FST values) and the geographical distance matrix, estimated using Google Earth v. 6.2 (2012) (Google), following river courses. Additionally, a haplotype network was constructed based on a likelihood tree using HAPLOVIEWER v. 4.2 (Salzburger et al., 2011).
Morphometric analyses included basic descriptive statistics and multivariate analyses. Principal Components Analysis (PCA) was used with logarithmized and raw measurements calculated as percentages of standard length (%SL) to build a covariance matrix (Bookstein et al., 1985) in order to explore the variation in form and shape and to identify possible diagnostic measurements (Varella et al., 2016). The same data were used in a Linear Discriminant Analysis (LDA) (Fisher, 1936) to access putative morphological clusters. In both analyses, 95% confidence ellipses were established for each location. For morphometric analysis, we used R (v. 4.5.1), R Studio (v. 2025.09.1 Build 401), using the packages: ggplot2, dplyr, MASS, ggfortify, and patchwork. Skeletonized specimens were used for counts and comparative anatomy under the terminology used by Hilton (2003) and Stewart (2013b). All the analyses included the holotype of Arapaima leptosoma Stewart, 2013 (INPA-ICT 16847) for comparisons.
Results
Molecular analyses. The COI gene alignment consisted of approximately 614 base pairs from 70 individuals, of which seven were variable and three were parsimony informative. The sequences were deposited in GenBank under the accession number available in Tab. S2. Analysis of pairwise genetic distances among all individuals revealed intraspecific genetic distances ranging from 0.1% to 0.7% (see Tab. S3), with no pairwise values > 2%. AMOVA was conducted, treating each location as a distinct population. Analysis of this scenario revealed no genetic differentiation between populations (-0.53) where nearly 100% of the variation occurred within localities, indicating no population structure (Fst = -0.0052, P < 0.05).
This was observed when we analyzed the Fst values for pairwise differences between the localities (Tab. 3). The only values that showed a moderate level of genetic differentiation were between Mexiana Island and Iquitos-PER (Fst = 0.20) and Carauari and the rio Unini (Fst = 0.18), but the values were not significant (P > 0.05). The only significant differentiation values (P < 0.05) in our analyses were between RDS Piagaçu-Purus (PPR) and Carauari (JRA) and Mexiana Island (MEX) and REBio Lago Piratuba (AMP) (Tab. 3), but the levels of differentiation for these localities were weak (< 0.15) considering the classification proposed by Wright (1969).
TABLE 3 | Fst values for pairwise differences between locations. *Significant values, where P<0.05. PER = Iquitos, Peru; UNI = rio Unini; TUC = Tucuruí; TNT = Alto Solimões, STM = Santarém, PA; PPR = RDS Piagaçu-Purus; MEX = Ilha da Mexiana; JRA = Carauari; AMP = REBio Lago Piratuba, AP.
| PER | UNI | TUC | TNT | STM | PPR | MEX | JRA | AMP |
PER | – | – | – | – | – | – | – | – | – |
UNI | 0.06456 | – | – | – | – | – | – | – | – |
TUC | 0.04575 | -0.11024 | – | – | – | – | – | – | – |
TNT | -0.06203 | -0.11804 | -0.10041 | – | – | – | – | – | – |
STM | -0.02601 | 0.00452 | 00000 | -0.10463 | – | – | – | – | – |
PPR | -0.03902 | 0.09162 | 0.0294 | -0.05727 | -0.09226 | – | – | – | – |
MEX | 0.2013 | 0.10483 | 0.14894 | -0.04563 | 0.11111 | -0.06516 | – | – | – |
JRA | 0.08809 | 0.18643 | 0.01049 | 0.02095 | 0.02347 | 0.04667* | 0.10634 | – | – |
AMP | -0.03011 | -0.08999 | -0.18498 | -0.09305 | -0.07752 | 0.01238 | 0.04375* | 0.03318 | – |
The Mantel test revealed no correlation (r = 0.06, P > 0.05) between genetic and geographic distances. This suggests that the limited genetic differentiation between populations, in this case, cannot be attributed to the geographic distance between the sampled locations. Among the 70 individuals analyzed, seven haplotypes were found. Each haplotype was distinct from the others by only a single mutation (Fig. 2). The two most frequent haplotypes, H1 and H2, were found in all locations. H3 was shared between Peru, Tonantins (alto Solimões), and Purus. Haplotype 4 was exclusive to Mexiana, haplotype 5 was exclusive to Tonantins, haplotype 6 was exclusive to Purus, and haplotype 7 was exclusive to Peru.
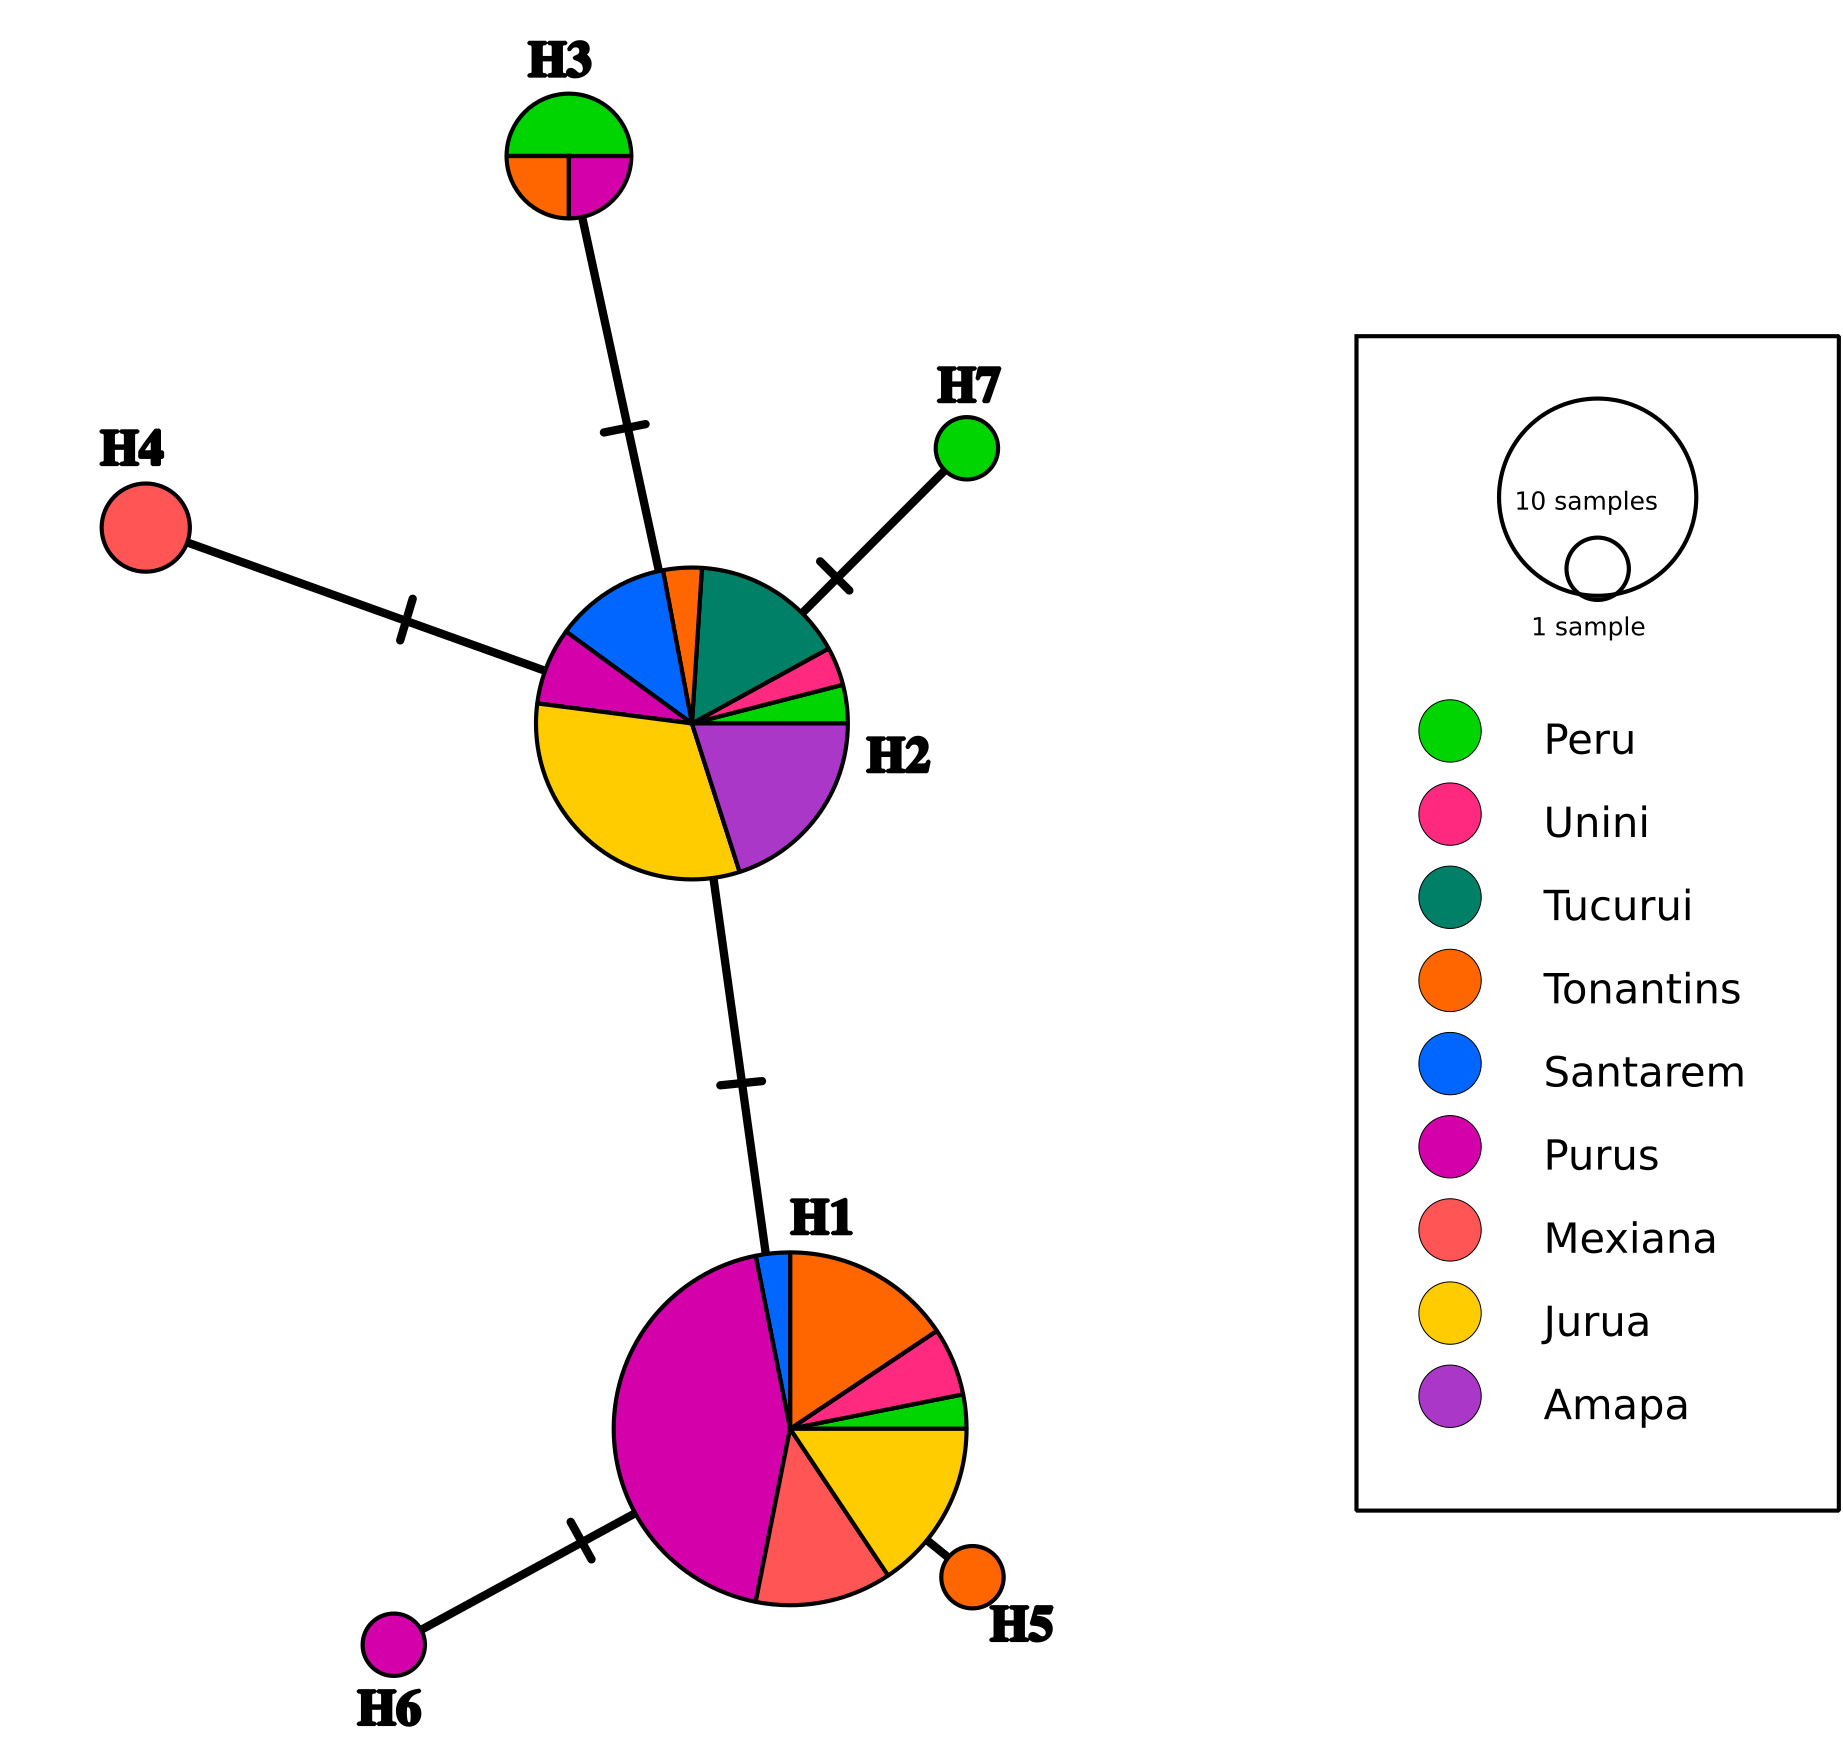
FIGURE 2| Haplotype network of COI gene sequences obtained from Arapaima gigas individuals collected from nine different locations in the Amazon basin. Circles represent observed haplotypes, and their size indicates their abundance. Colors correspond to different localities, with the corresponding codes listed in Tab. 1.
Morphometric analysis. One hundred and four specimens were sampled from four localities: two along the rio Solimões/Amazonas and two in tributaries (rio Purus and rio Juruá) (Tab. 4). Among the 90 measured specimens (Tab. S4), 82 were used in the analyses in order to keep a comparable size range among the different populations. Thus, specimens above 165 mm SL were excluded (Tab. 5; Tab. S5). For the osteological analysis, only 14 specimens were used from Purus, Santarém and alto Solimões. Only one specimen from the rio Juruá had the complete skeleton prepared. For the remaining specimens, only the head was used.
TABLE 4 | Number of specimens (N) used in the morphometric and osteological analyses.
Morphometric analysis | Osteological analysis | |
Locality | N | N |
Alto Solimões (ASL) | 22 | 2 |
Rio Purus (PPR) | 32 | 7 |
Rio Juruá (JRA) | 32 | 5 |
Santarém, Pará (STM) | 4 | 1 |
n | 90 | 15 |
TABLE 5 | Percentages of measurements over SL (%SL). N = Number of specimens, X = Average, SD = Standard deviation, Min = Minimum values, Max = Maximum values. Predorsal length (PDL), dorsal fin base length (DBL), longest dorsal fin ray (LDR), Preanal length (PAL), anal fin base length (ABL), anal fin longest ray (LAR), prepelvic length (PPeL), prepectoral length (PPL), distance between origin of pectoral to origin of pelvic fin (PPD), body depth at pelvic fin origin (BDPe), distance between origin of pelvic to origin of dorsal fin (PDd), depth of caudal peduncle (CPD), caudal peduncle length (CPL), depth of caudal fin (CFD), head length (HL), head depth at occipital (HDOc), head depth at orbit (HDOr), head width at opercles (HWop), interorbital distance (IOD), internares distance (IND), orbit diameter (OD), snout length (SnL), preorbital length (POL), 4th infraorbital length (IO4L), postorbital length (pOL), skull length (SKL) and upper maxilla length (UML).
Measurement |
| Santarém | Purus | Alto Solimões | Juruá | |||||||
N = 82 | N = 4 | N = 26 | N = 22 | N = 30 | ||||||||
X | SD | Min | Max | X | SD | X | SD | X | SD | X | SD | |
RAW | ||||||||||||
SL (cm) | 135.9 | 12.5 | 107.1 | 163.9 | 115.1 | 7.0 | 147.3 | 9.6 | 130.9 | 11.5 | 132.3 | 6.6 |
% SL | ||||||||||||
PDL | 70.4 | 1.8 | 66.1 | 76.5 | 70.8 | 4.0 | 70.5 | 1.5 | 70.1 | 2.2 | 70.5 | 1.3 |
DBL | 27.4 | 1.5 | 23.3 | 32.8 | 30.3 | 1.8 | 27.7 | 1.0 | 27.5 | 1.1 | 26.6 | 1.4 |
ABL | 25.4 | 1.6 | 20.8 | 29.1 | 26.6 | 1.3 | 26.1 | 1.4 | 25.9 | 1.4 | 24.4 | 1.3 |
PAL | 74.6 | 2.2 | 68.1 | 80.9 | 74.6 | 4.7 | 74.7 | 1.7 | 75.2 | 2.8 | 74.2 | 1.5 |
PPL | 23.0 | 1.3 | 20.6 | 26.6 | 24.1 | 1.4 | 22.9 | 1.1 | 22.8 | 1.4 | 23.1 | 1.3 |
PPD | 41.8 | 1.4 | 37.2 | 45.7 | 40.9 | 2.4 | 41.9 | 1.2 | 42.2 | 1.8 | 41.5 | 1.0 |
PPeL | 63.9 | 1.9 | 58.6 | 69.7 | 64.0 | 3.8 | 64.0 | 1.3 | 63.9 | 2.5 | 63.8 | 1.7 |
BDPe | 18.6 | 1.1 | 16.5 | 23.2 | 20.1 | 1.2 | 19.1 | 1.2 | 18.8 | 0.9 | 17.9 | 0.6 |
PDd | 20.4 | 1.0 | 18.4 | 23.5 | 21.8 | 1.6 | 20.8 | 0.9 | 20.5 | 0.9 | 19.8 | 0.8 |
LDR | 8.7 | 1.3 | 5.1 | 12.0 | 8.3 | 1.4 | 9.1 | 1.3 | 9.0 | 0.8 | 8.2 | 1.3 |
LAR | 7.4 | 1.0 | 3.9 | 10.2 | 7.2 | 0.7 | 6.9 | 1.1 | 7.8 | 1.0 | 7.5 | 0.8 |
CPD | 6.5 | 0.5 | 5.4 | 7.8 | 6.7 | 0.1 | 6.4 | 0.6 | 6.8 | 0.3 | 6.2 | 0.4 |
CPL | 5.4 | 0.6 | 4.1 | 6.8 | 4.9 | 0.3 | 5.3 | 0.5 | 5.9 | 0.4 | 5.1 | 0.5 |
CFD | 12.0 | 1.2 | 8.4 | 14.5 | 10.7 | 0.2 | 11.6 | 1.3 | 12.4 | 0.8 | 12.2 | 1.3 |
HL | 26.9 | 1.8 | 22.2 | 30.1 | 25.6 | 2.4 | 27.2 | 1.9 | 25.6 | 1.6 | 27.8 | 1.2 |
HDOc | 11.8 | 1.0 | 9.5 | 13.8 | 11.1 | 1.3 | 11.8 | 0.9 | 10.8 | 0.7 | 12.5 | 0.6 |
HDOr | 5.7 | 0.7 | 4.0 | 8.2 | 7.0 | 1.3 | 5.7 | 0.5 | 5.0 | 0.4 | 6.0 | 0.3 |
OD | 1.6 | 0.2 | 1.1 | 2.2 | 1.7 | 0.3 | 1.5 | 0.1 | 1.4 | 0.1 | 1.9 | 0.1 |
PoL | 2.1 | 0.2 | 1.4 | 2.6 | 1.7 | 0.2 | 2.3 | 0.1 | 2.0 | 0.2 | 2.1 | 0.1 |
IO4L | 10.5 | 0.7 | 8.3 | 11.7 | 10.0 | 1.0 | 10.6 | 0.6 | 9.9 | 0.7 | 10.9 | 0.4 |
POL | 21.6 | 1.2 | 18.1 | 24.3 | 20.6 | 1.6 | 22.0 | 1.5 | 21.3 | 1.2 | 21.7 | 0.8 |
UML | 5.8 | 0.8 | 3.9 | 7.8 | 6.0 | 0.6 | 5.9 | 0.6 | 4.8 | 0.4 | 6.5 | 0.6 |
HWop | 14.0 | 1.0 | 11.5 | 16.4 | 13.6 | 0.8 | 13.4 | 1.1 | 14.3 | 1.0 | 14.4 | 0.7 |
IOD | 6.9 | 0.3 | 6.1 | 8.1 | 6.6 | 0.3 | 6.8 | 0.2 | 7.0 | 0.5 | 6.9 | 0.3 |
IND | 4.4 | 0.2 | 3.7 | 5.2 | 4.1 | 0.1 | 4.3 | 0.2 | 4.4 | 0.3 | 4.4 | 0.2 |
SKL | 18.4 | 1.1 | 15.3 | 21.5 | 17.8 | 0.9 | 18.2 | 0.6 | 18.3 | 1.5 | 18.7 | 1.0 |
SnL | 6.1 | 0.4 | 4.8 | 7.9 | 5.8 | 0.3 | 6.1 | 0.2 | 6.0 | 0.7 | 6.2 | 0.3 |
The average of SL of all the examined specimens was 135.9 cm. From Santarém, we had the smallest specimens and only four were analyzed, with an average SL of 115.1 cm; Juruá was the most abundant locality and Purus showed the largest specimens. The average SL was 147.3 cm in Purus, 132.3 cm in Juruá and 130.9 cm in alto Solimões (Tab. 4).
Principal Component Analysis. For the individual localities, the Santarém PCA showed that the first component (PC1) explained 78% of the total variation and PC2 just 17% (Tab. S6). The most relevant loads in PC1 were (PAL = 0.55), (PDL = 0.45), (PpeL = 0.45) and (PPD = 0.26); in PC2 were (HL = 0.50), (HDOr = 0.33), (POL = 0.28), (HDOc = 0.27), (PPD = -0.23), (PPd = 0.23), (IO4L = 0.21) and (SKL = -0.20) (Tab. S6). For the rio Purus population, PCA showed that PC1 explained 28% of the total variation, whereas PC2 explained 22%. For this locality, the relevant eigenvalues in PC1 were (HL = 0.50), (PAL = 0.38), (POL = 0.37), (PPeL = 0.31), (PDL = 0.31) and (PPD = 0.29); in PC2 were (PAL = 0.46), (HL = 0.40), (POL = 0.35), (PDL = 0.33), (PPL = 0.27), (PPeL = 0.25) and (BDPe = 0.24) (Tab. S7). For the alto rio Solimões population, PC1 explained 54% and PC2 16%. Eigenvalues for PC1 were (PAL = 0.56), (PPeL = 0.50), (PDL = 0.40) and (PPD = 0.34); for PC2 were (HL = 0.56), (POL = 0.41), (SKL = 0.38), (HDOc = 0.25), (IO4L = 0.23) and (ABL = 0.21) (Tab. S8). For the locality rio Juruá, PC1 explained 34% and PC2 27% of the total variation. Eigenvalues for PC1 were (PPeL = 0.49), (PAL = 0.40), (PDL = 0.34), (DBL = -34), (PPL = 0.34), (ABL = -0.31); for PC2 were (LDR = 0.45), (HL = 0.38), (CFD = 0.35), (PPeL = -0.32), and (SKL = 0.26) (Tab. S9).
In the individual analysis per locality using log-transformed measures, PC1 showed a correlation of 50% and 46% for rio Purus and rio Juruá, respectively, whereas for Santarém and alto Solimões, this correlation was higher at 77% and 60% respectively. For specimens from the populations of Santarém and alto Solimões, the measures that showed the most relevance in total body variation were related to the head, such as, orbit, depth of head at orbit, snout length, preorbital length and maxilla length. For the populations of Juruá and Purus, the more relevant measures were related to the fins, as well as the length and depth of the caudal peduncle (Tab. S10).
In the composite PCA, with all four locations, the analysis with SL percentages showed that PC1 and PC2 explained 25% and 15% of the data variation, respectively (Fig. 3A), with all polygons plus Arapaima leptosoma grouped together (Fig. 3B). At this point, the most relevant loadings were related to the dorsal and anal fins, the pre-dorsal, pre-anal and pre-pelvic lengths, and the head length.
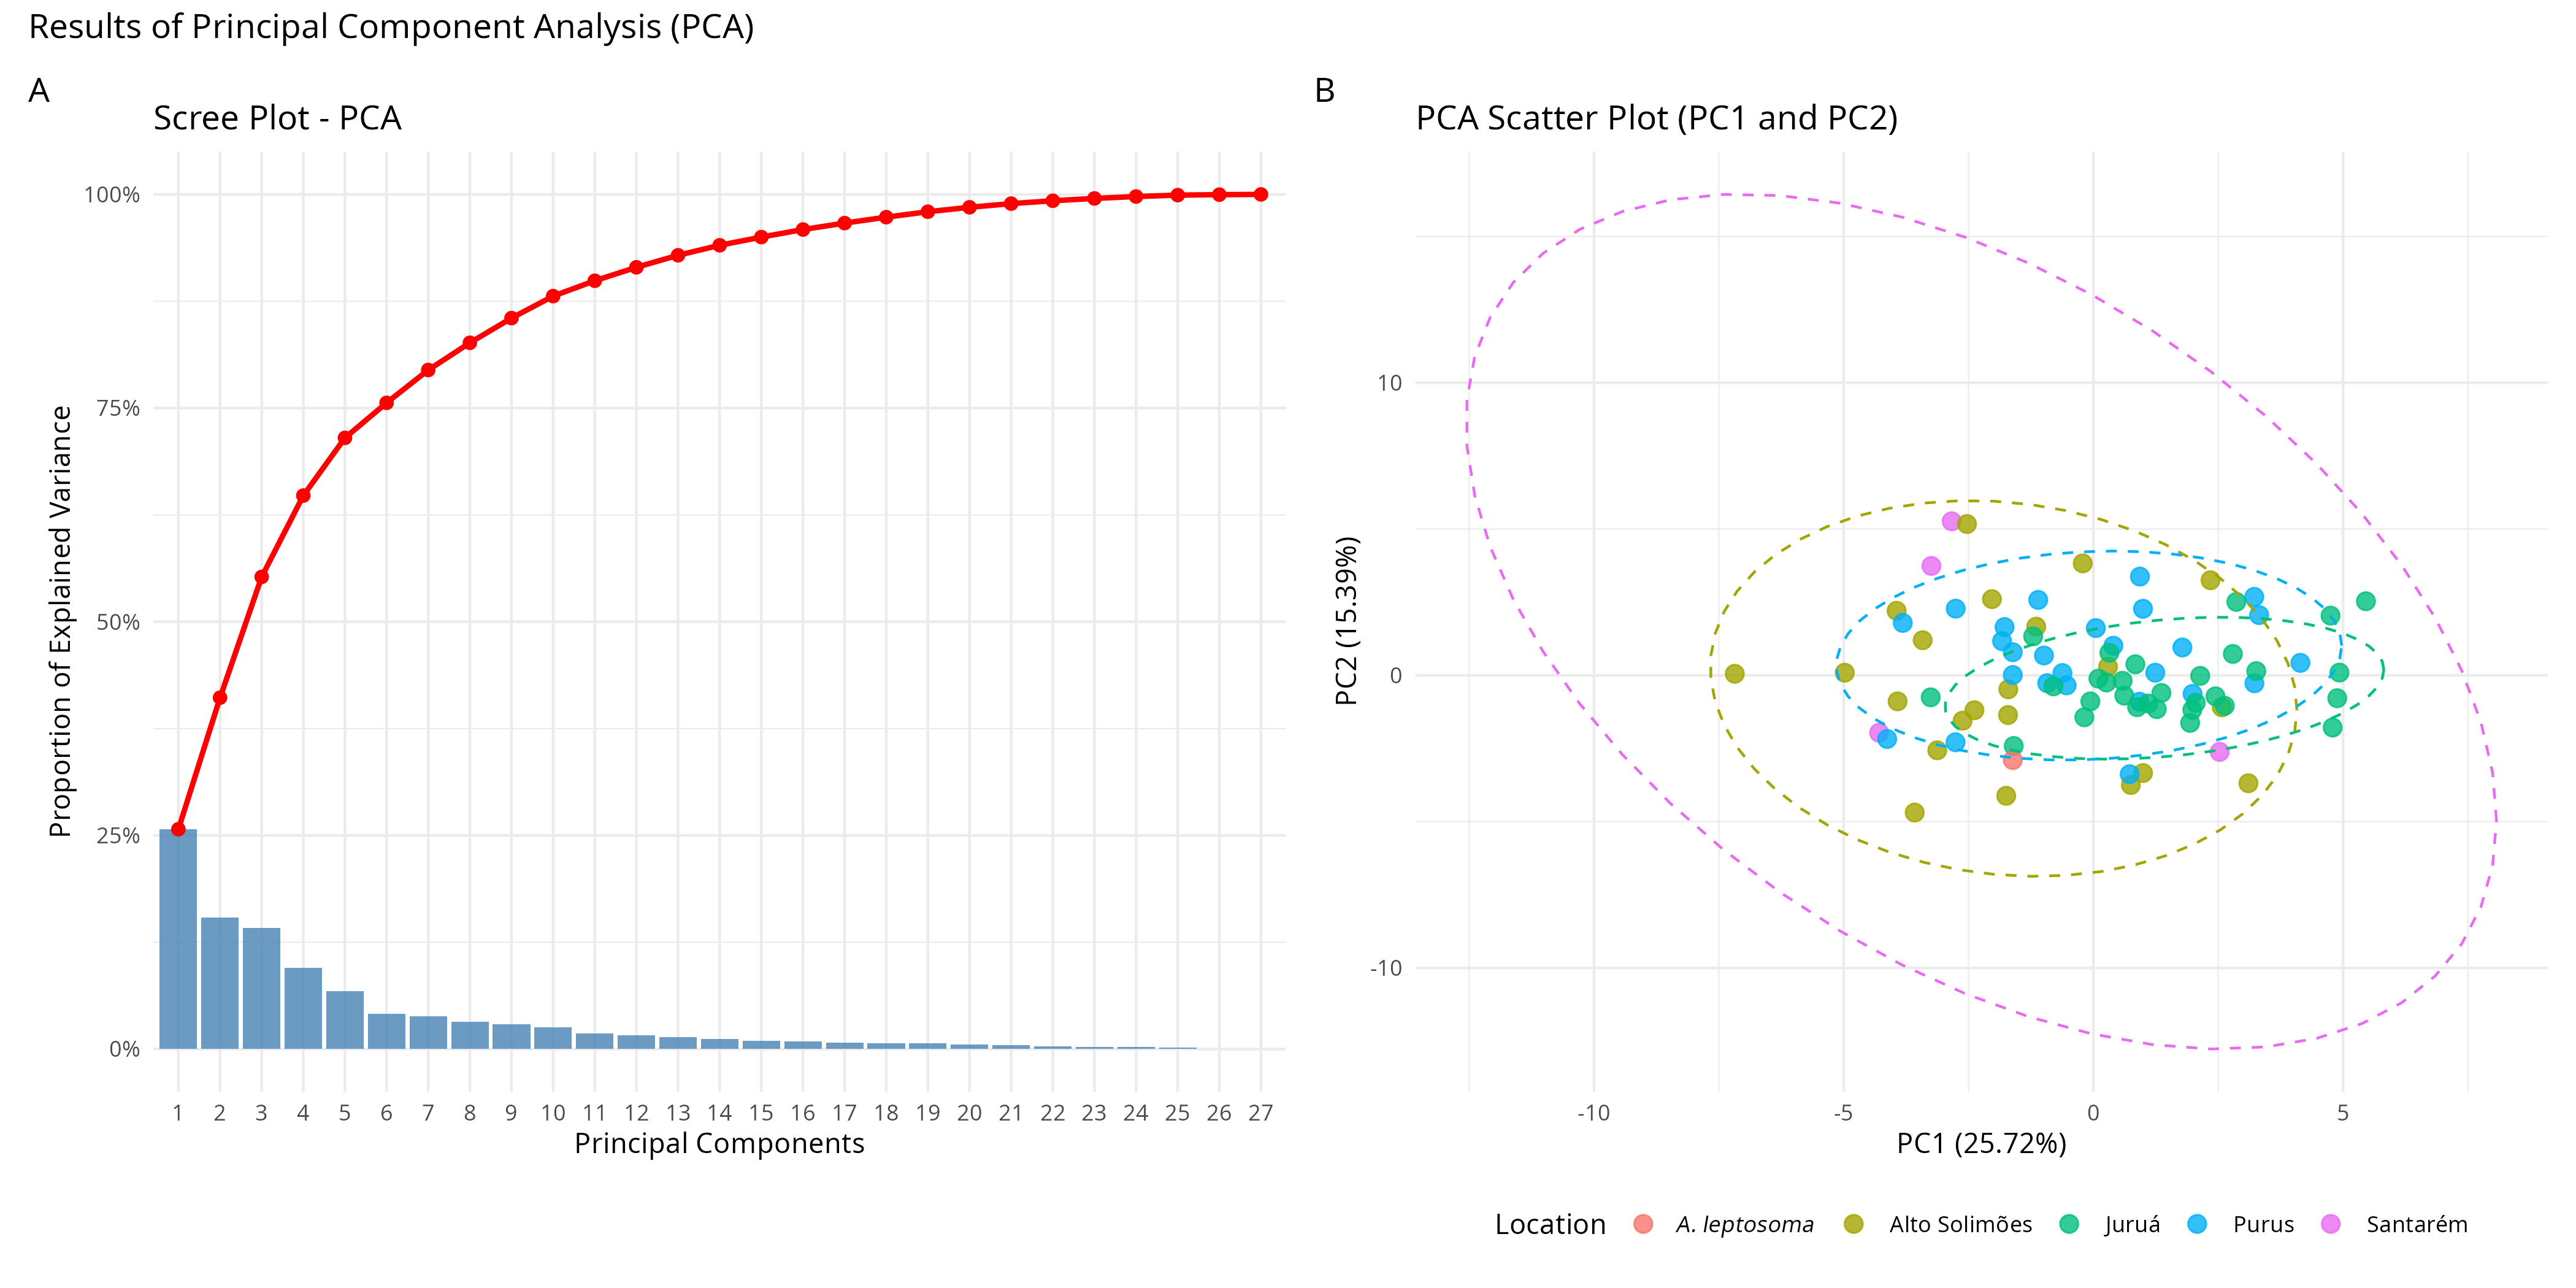
FIGURE 3| Principal Component Analysis using %SL for Arapaima gigas individuals from the four locations and the single A. leptosoma individual.
However, composite principal component analysis (PCA), transformed by logarithm, showed a different result. PC1 and PC2 explained 68% and 10% respectively (Fig. 4A). The polygons were poorly connected, with the Juruá and Purus polygons close to each other in the upper quadrants, and the alto Simões polygon in the lower quadrant (Fig. 4B). The four specimens from Santarém were closer to the alto Solimões and rio Juruá polygons, and A. leptosoma was displaced to the edge of the upper negative quadrant, far from the others. The separation of A. leptosoma is most likely related to its small size (77.2 cm SL).
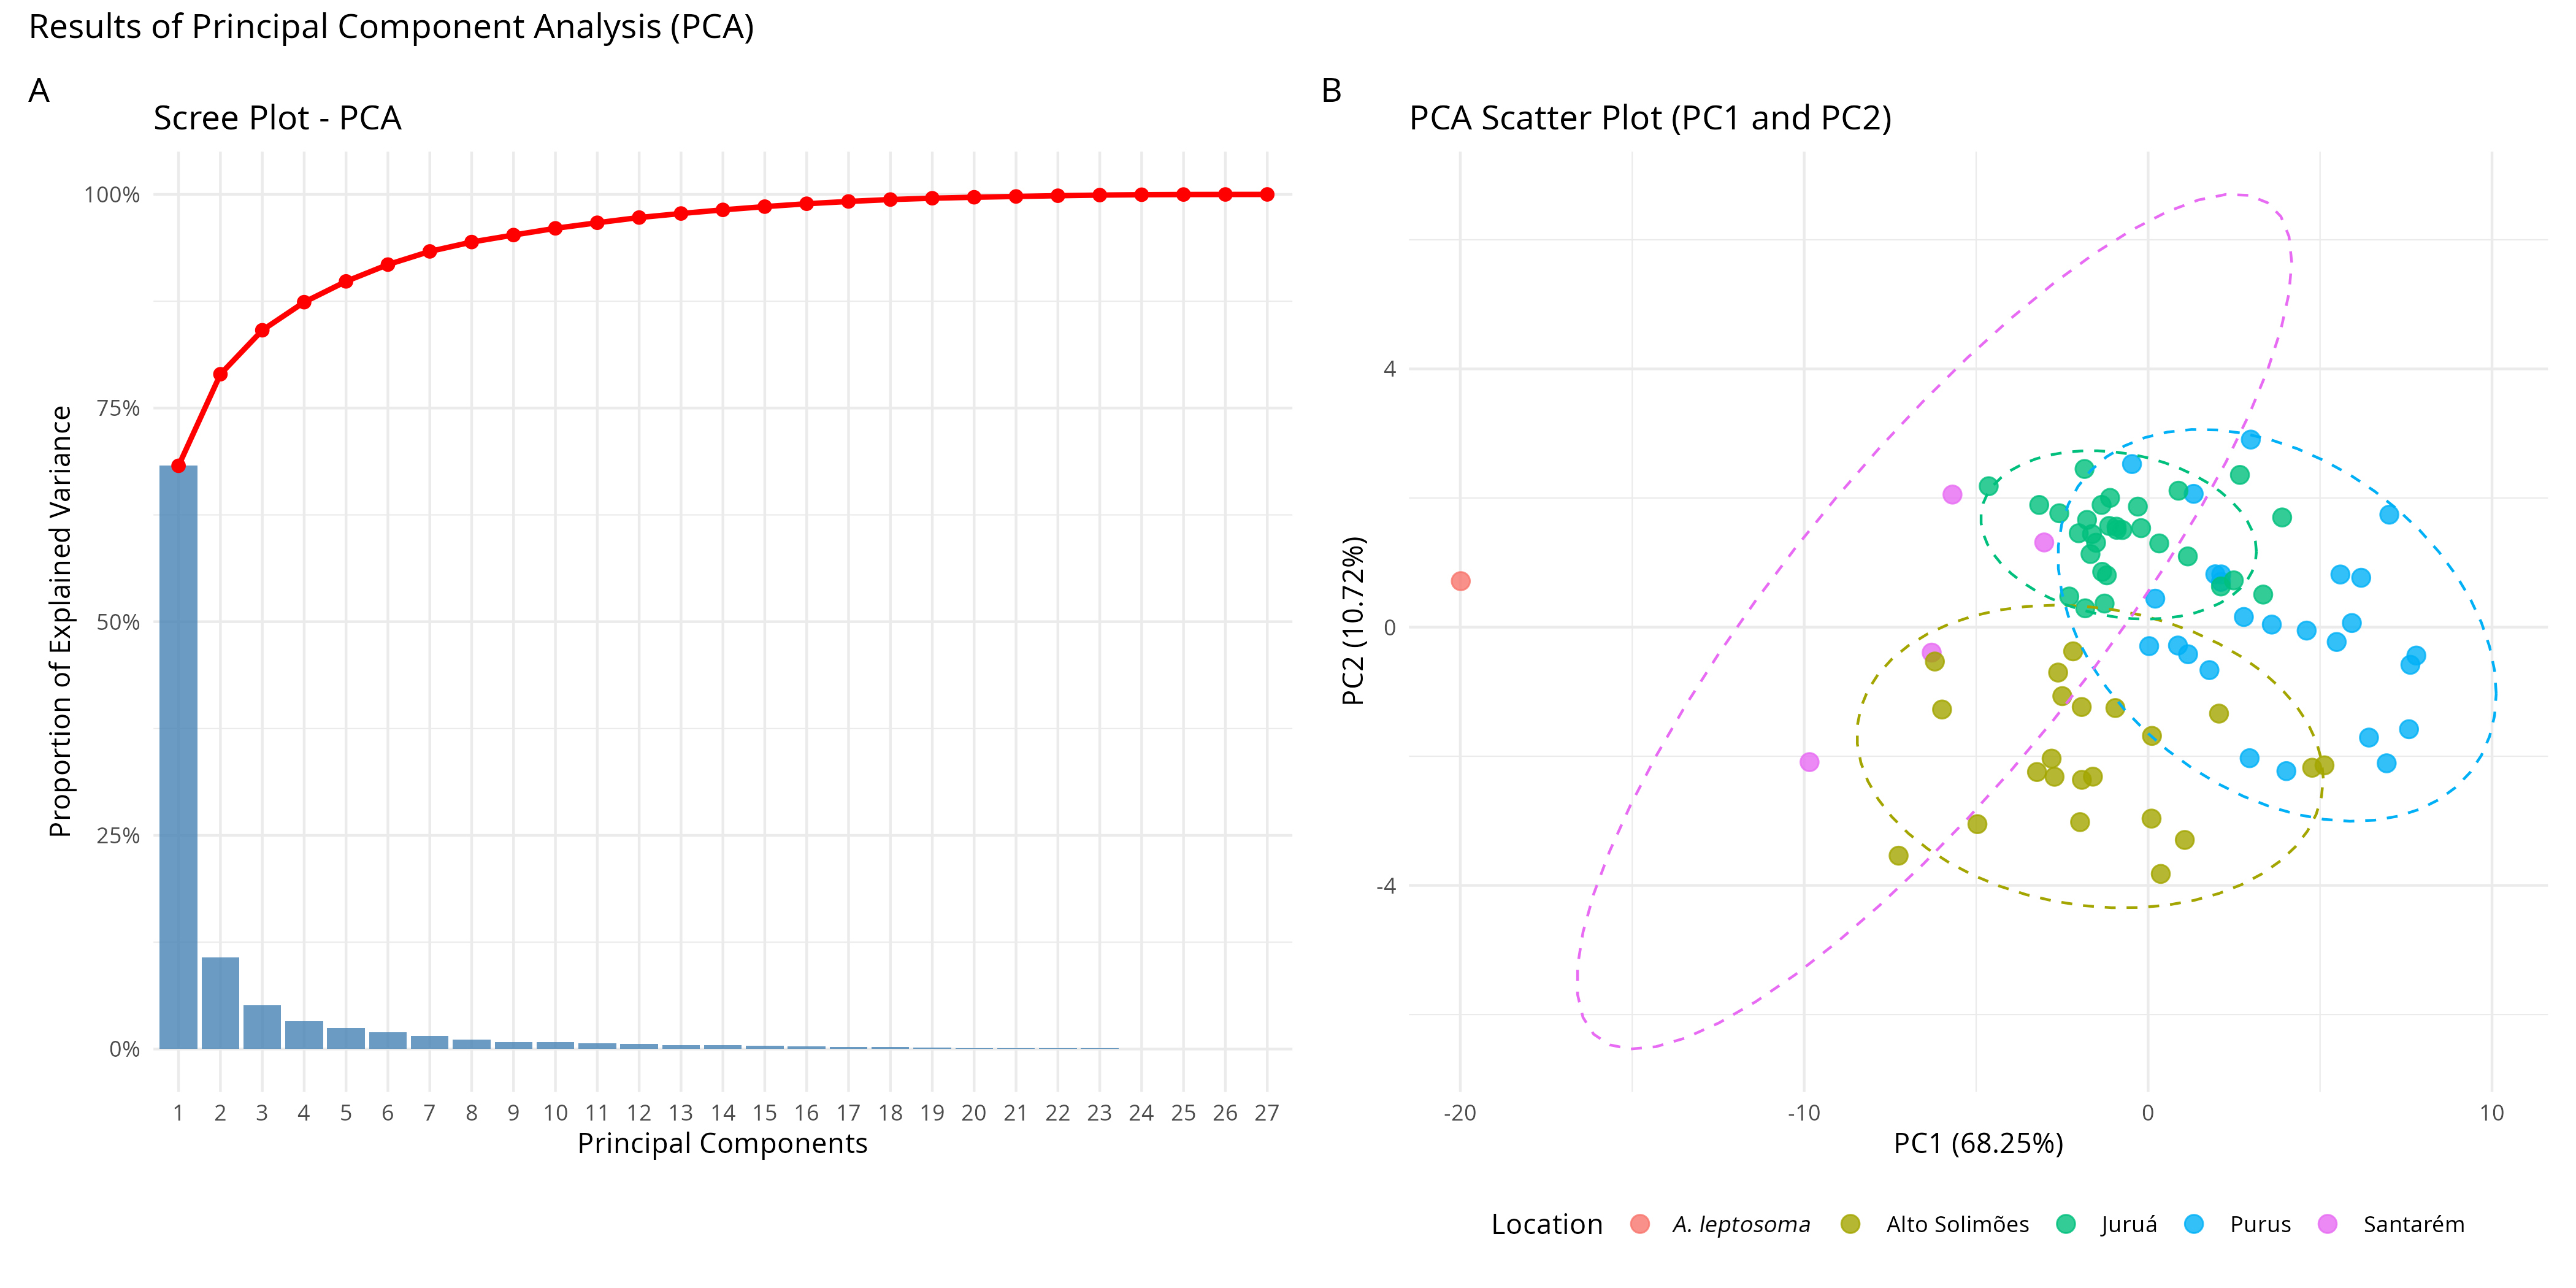
FIGURE 4| Principal Component Analysis using logarithmized raw measures, including the holotype of Arapaima leptosoma.
In this analysis, the measures that had a higher weight in the superior axis were related to the head, such as, orbital diameter, head depth, premaxillary length, and length of the 4th infraorbital. On the other hand, in the inferior axis, the more relevant measures were related to fins and the caudal peduncle. In the PC2 X PC3 analysis, however, all polygons clustered together, with A. leptosoma right in the center, demonstrating that the corporal measures of A. leptosoma, independent of size, performed similarly to the other specimens. In this case, the measurements with higher loads were similar to the raw percentage results, with a higher weight on measurements related to the head in the superior positive quadrant for the populations of rio Juruá, rio Purus, Santarém and A. leptosoma, whereas for the alto rio Solimões population, the eigenvectors were related to fins and the caudal peduncle. The most significant loads in PC1 were (PoL = 0.27), (HDOc = 0.23), (LDR = 0.23), (IO4L = 0.21), (CFD = 0.20) and (POL = 0.20), and (OD = 0.51), (UML = 0.47), (HDOr = 0.32), (CPL = -0.30), (LDR = -0.30) and (CPD = -0.23) for PC2.
Discriminant analysis. In the Linear Discriminant Analysis, the results with raw measurements transformed into logarithms showed that LD1 and LD2 explained more than 68% of the data variation (Fig. 5A), with the Santarém polygon being closer to the alto rio Solimões and rio Juruá polygons. The A. leptosoma holotype was very distant from the polygon of all locations, probably due to the size effect, since the smaller specimens stood out from the others (Fig. 5B). It is also possible to observe that some individuals from the rio Purus and the rio Juruá were outside the 95% confidence ellipse of their respective groups; this is certainly a reflection of the morphometric variations found in these populations.
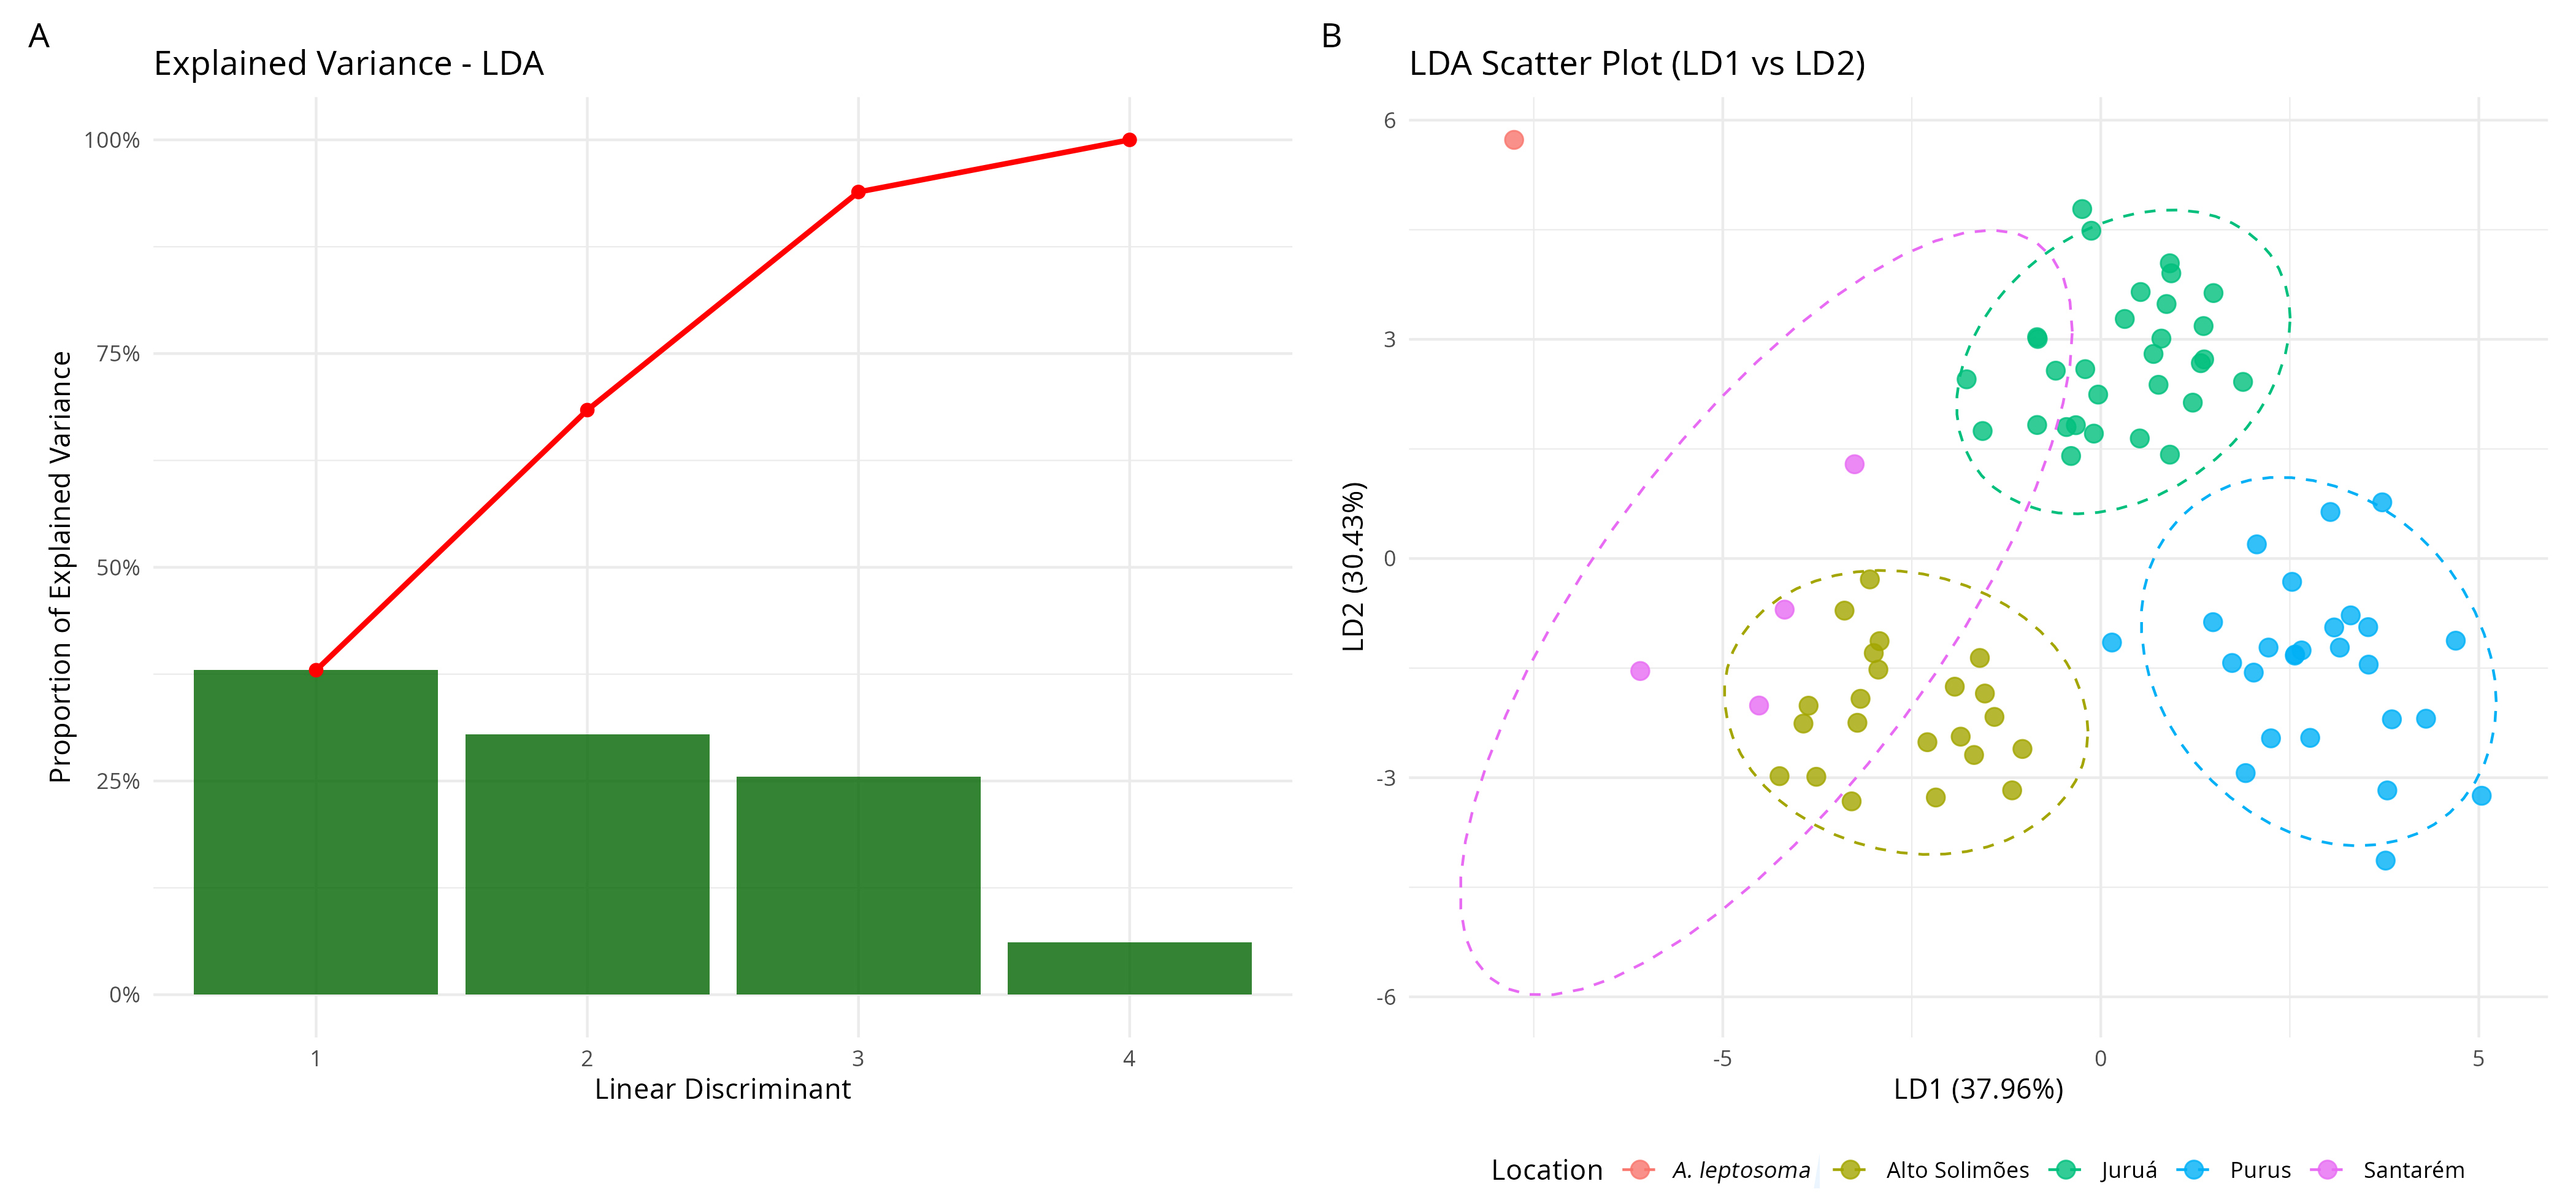
FIGURE 5| Linear discriminant analysis using raw data from Arapaima gigas specimens from the four localities, plus the holotype of A. leptosoma.
Analyses demonstrated that the polygons of the rios Juruá and Purus show similarities related to some body measurements. Although the Santarém polygon and A. leptosoma were closer to the other pirarucu populations in the PCA, in the LDA they were more distant. It was observed that certain measurements were relevant in all analyses, with measurements related to the head for the populations of the rios Purus and Juruá and measurements related to the caudal peduncle and fins for the population of the alto rio Solimões. For the Santarém population, in addition to the single specimen of A. leptosoma, the results were strongly dependent on its smaller sizes.
Meristic. Counts included the number of teeth (each hemimaxilla) of premaxillary, maxillar and dentary, the number of abdominal and caudal vertebrae, and the total number of dorsal, anal, and caudal fin rays. Values for A. leptosoma (Alpt) were included for comparison. Despite the limited number of specimens from some locations, the analyses showed a large range of variation that can also be related to ontogeny. Although fish lose teeth easily throughout their lives, the counts were conservative.
Counts of the number of teeth were mainly performed in the left dentary and maxillary (Tab. 6). The total number of teeth, considering both hemimaxilla, is shown in Tab. 8. Arapaima teeth have a peculiar triangular shape: very broad and robust proximally with pointed, incisive crowns. Teeth in the dentary varied from 27 (rio Purus) to 37 (rio Juruá) (Tab. 6), with a mode (MD) of 29. We were not able to observe two series of irregular teeth as mentioned by Stewart (2013a,b), but rather empty dental cups and the formation of new teeth in some specimens. In those articles, Stewart refers these counts to the dry and stuffed holotype of Vastres cuvieri Valenciennes [A.] in Cuvier & Valenciennes 1847, a specimen of 203 cm of standard length,synonymized to Arapaima gigas (Schinz, 1822), housed in the Museum National d`Historie Naturelle (MNHN, Paris). This material was not available for our analysis.
TABLE 6 | Frequency of teeth in the specimens of Arapaima in this study. ASL = Alto Solimões; PPR = rio Purus; JRA = rio Juruá; STM = Santarém, PA; Alpt = A. leptosoma holotype.
Number of dentary teeth | ||||||||||||||||||||
| 27 | 28 | 29 | 30 | 31 | 32 | 33 | 34 | 35 | 36 | 37 | 38 | 39 | 40 | 41 | 42 | 43 | 44 | 45 | 46 |
ASL |
|
|
|
|
|
| 1 | 1 |
|
|
|
|
|
|
|
|
|
|
|
|
JRA |
|
| 1 |
| 1 |
|
|
| 1 | 1 | 1 |
|
|
|
|
|
|
|
|
|
PPR | 2 | 1 | 2 |
|
| 1 |
|
|
| 1 |
|
|
|
|
|
|
|
|
|
|
STM |
|
|
|
|
|
|
| 1 |
|
|
|
|
|
|
|
|
|
|
|
|
Alpt |
|
|
|
|
| 1 |
|
|
|
|
|
|
|
|
|
|
|
|
|
|
Number of premaxillary teeth |
| |||||||||||||||||||
ASL |
|
|
|
|
|
|
|
| 1 |
|
| 1 |
|
|
|
|
|
|
|
|
JRA |
|
|
|
|
|
|
|
|
| 2 |
| 1 |
|
|
|
|
|
|
|
|
PPR |
|
|
|
|
|
|
|
| 1 | 2 |
| 2 | 2 |
|
|
|
|
|
|
|
STM |
|
|
|
|
|
|
|
|
|
|
| 1 |
|
|
|
|
|
|
|
|
Alpt |
|
|
|
|
| 1 |
|
|
|
|
|
|
|
|
|
|
|
|
|
|
Number of maxillary teeth | ||||||||||||||||||||
| 19 | 20 | 21 | 22 | 23 | 24 | 25 | 26 | 27 | 28 | 29 | 30 | 31 | 34 | 36 | 37 | 40 | 41 | 42 | 43 |
ASL |
|
|
|
|
|
|
|
|
|
| 1 |
|
| 1 |
|
|
|
|
|
|
JRA |
|
|
|
|
|
|
|
|
| 1 |
|
|
| 1 | 1 | 1 |
| 1 |
|
|
PPR | 1 |
| 1 | 2 | 1 |
|
| 1 |
|
|
|
| 1 |
|
|
|
|
|
|
|
STM |
|
|
|
|
|
|
|
|
|
|
|
|
|
|
| 1 |
|
|
|
|
Alpt |
|
|
|
|
|
|
|
|
| 1 |
|
|
|
|
|
|
|
|
|
|
The number of teeth on the premaxillary varied from 35 (rio Purus and alto rio Solimões) to 41 (rio Juruá). Rio Juruá was the locality with the largest range of variation (Tab. 6). The mode was 38, as five specimens showed the same value. The range of variation in maxillary counts was higher, with one specimen in Purus having 19 teeth and one from rio Juruá with 41 (Tab. 6). The higher ranges of variation in the number of maxillary teeth were in rio Purus (19–31) and rio Juruá (28–41).
TABLE. 7 | Frequency of the number of abdominal and caudal vertebrae of Arapaima in this study. ASL = Alto Solimões; PPR = rio Purus; JRA = rio Juruá; STM = Santarém, PA; Alpt = A. leptosoma holotype.
Number of vertebrae | |||||||||||||||||
| Abdominal | Caudal | |||||||||||||||
| 35 | 36 | 37 | 38 | 39 | 40 | 41 | 34 | 35 | 36 | 37 | 38 | 39 | 40 | 41 | 42 | 43 |
ASL |
|
|
| 1 | 1 |
|
|
|
|
|
|
|
|
|
| 2 |
|
JRA |
|
|
| 1 |
|
|
|
|
|
|
|
|
|
|
| 1 |
|
PPR |
|
| 1 | 2 | 3 | 1 |
|
|
|
|
|
|
|
| 1 | 4 | 2 |
STM |
|
|
|
| 1 |
|
|
|
|
|
|
|
|
| 1 |
|
|
Alpt |
|
|
|
|
|
| 1 |
|
|
|
|
|
|
|
|
| 1 |
Number of fin rays | |||||||||||||||||
| Dorsal | Anal | |||||||||||||||
ASL |
|
| 1 | 1 |
|
|
|
| 1 |
| 1 |
|
|
|
|
|
|
JRA |
|
| 1 |
|
|
|
|
|
| 1 |
|
|
|
|
|
|
|
PPR | 1 |
| 5 |
|
| 1 |
| 1 | 5 | 1 |
|
|
|
|
|
|
|
STM |
|
| 1 |
|
|
|
|
|
|
|
|
|
|
|
|
|
|
Alpt |
|
|
|
|
| 1 |
|
|
|
|
| 1 |
|
|
|
|
|
Concerning vertebrae counts, abdominal vertebrae showed a larger variation than caudal vertebrae. The rio Purus specimens varied from 37 to 40 abdominal vertebrae. Caudal vertebrae varied from 41 to 43, with mode of 42 (Tab. 7) with dominance of rio Purus values.
The number of dorsal fin rays varied from 35 to 38, with a mode of 37. The number of anal fin rays showed a slightly smaller range, with one specimen in rio Purus having 34 rays and another in alto rio Solimões having 37, a mode of 35 (Tab. 7). The number of caudal fin rays was more conservative, having three specimens having 32 and the remaining specimens having 33 rays (Tab. 7).
In Tab. 8 presents the total meristic counts for all specimens analyzed in this study, including the counts mentioned by Stewart (2013b) in the description of A. leptosoma (Alpt). Branchiostegal rays were also very conservative, with 11 pairs in specimens from rio Purus, rio Juruá and alto rio Solimões, and 12 pairs in the specimen from Santarém. One specimen from rio Juruá showed different counts: 11 on the left and 12 on the right.
TABLE 8 | Summary of counts for all analyzed specimens from all localities. SL = standard length; DT = sum of dentary teeth; PMX = sum of premaxillary teeth; MX = sum of maxillary teeth; Abd V = number of abdominal vertebrae; Cau V = number of caudal vertebrae; D = number of dorsal fin rays; A = number of anal fin rays; Pect = number of pectoral fin rays; C = number of caudal fin rays; BR = number of branchiostegal rays. ASL = Alto Solimões; PPR = rio Purus; JRA = rio Juruá; STM = Santarém, PA; Alpt = A. leptosoma holotype. *Total number of teeth, adding both sides of the dental arch. **Asymmetrical specimen.
Number of vertebrae | |||||||||||||||||
| Abdominal | Caudal | |||||||||||||||
| 35 | 36 | 37 | 38 | 39 | 40 | 41 | 34 | 35 | 36 | 37 | 38 | 39 | 40 | 41 | 42 | 43 |
ASL |
|
|
| 1 | 1 |
|
|
|
|
|
|
|
|
|
| 2 |
|
JRA |
|
|
| 1 |
|
|
|
|
|
|
|
|
|
|
| 1 |
|
PPR |
|
| 1 | 2 | 3 | 1 |
|
|
|
|
|
|
|
| 1 | 4 | 2 |
STM |
|
|
|
| 1 |
|
|
|
|
|
|
|
|
| 1 |
|
|
Alpt |
|
|
|
|
|
| 1 |
|
|
|
|
|
|
|
|
| 1 |
Number of fin rays | |||||||||||||||||
| Dorsal | Anal | |||||||||||||||
ASL |
|
| 1 | 1 |
|
|
|
| 1 |
| 1 |
|
|
|
|
|
|
JRA |
|
| 1 |
|
|
|
|
|
| 1 |
|
|
|
|
|
|
|
PPR | 1 |
| 5 |
|
| 1 |
| 1 | 5 | 1 |
|
|
|
|
|
|
|
STM |
|
| 1 |
|
|
|
|
|
|
|
|
|
|
|
|
|
|
Alpt |
|
|
|
|
| 1 |
|
|
|
|
| 1 |
|
|
|
|
|
Osteology and morphology. Osteological examination showed some asymmetries in the shape of the fourth infraorbital (IO-4). In the specimen from Santarém, the point of contact of the IO-4 to the orbit showed conspicuous differences in shape, being clearly larger on the left side than on the right side (Fig. 6A). Similarly, one specimen from the rio Purus showed the same asymmetry (Fig. 6B). The remaining specimens did not show this asymmetry (Fig. 6).
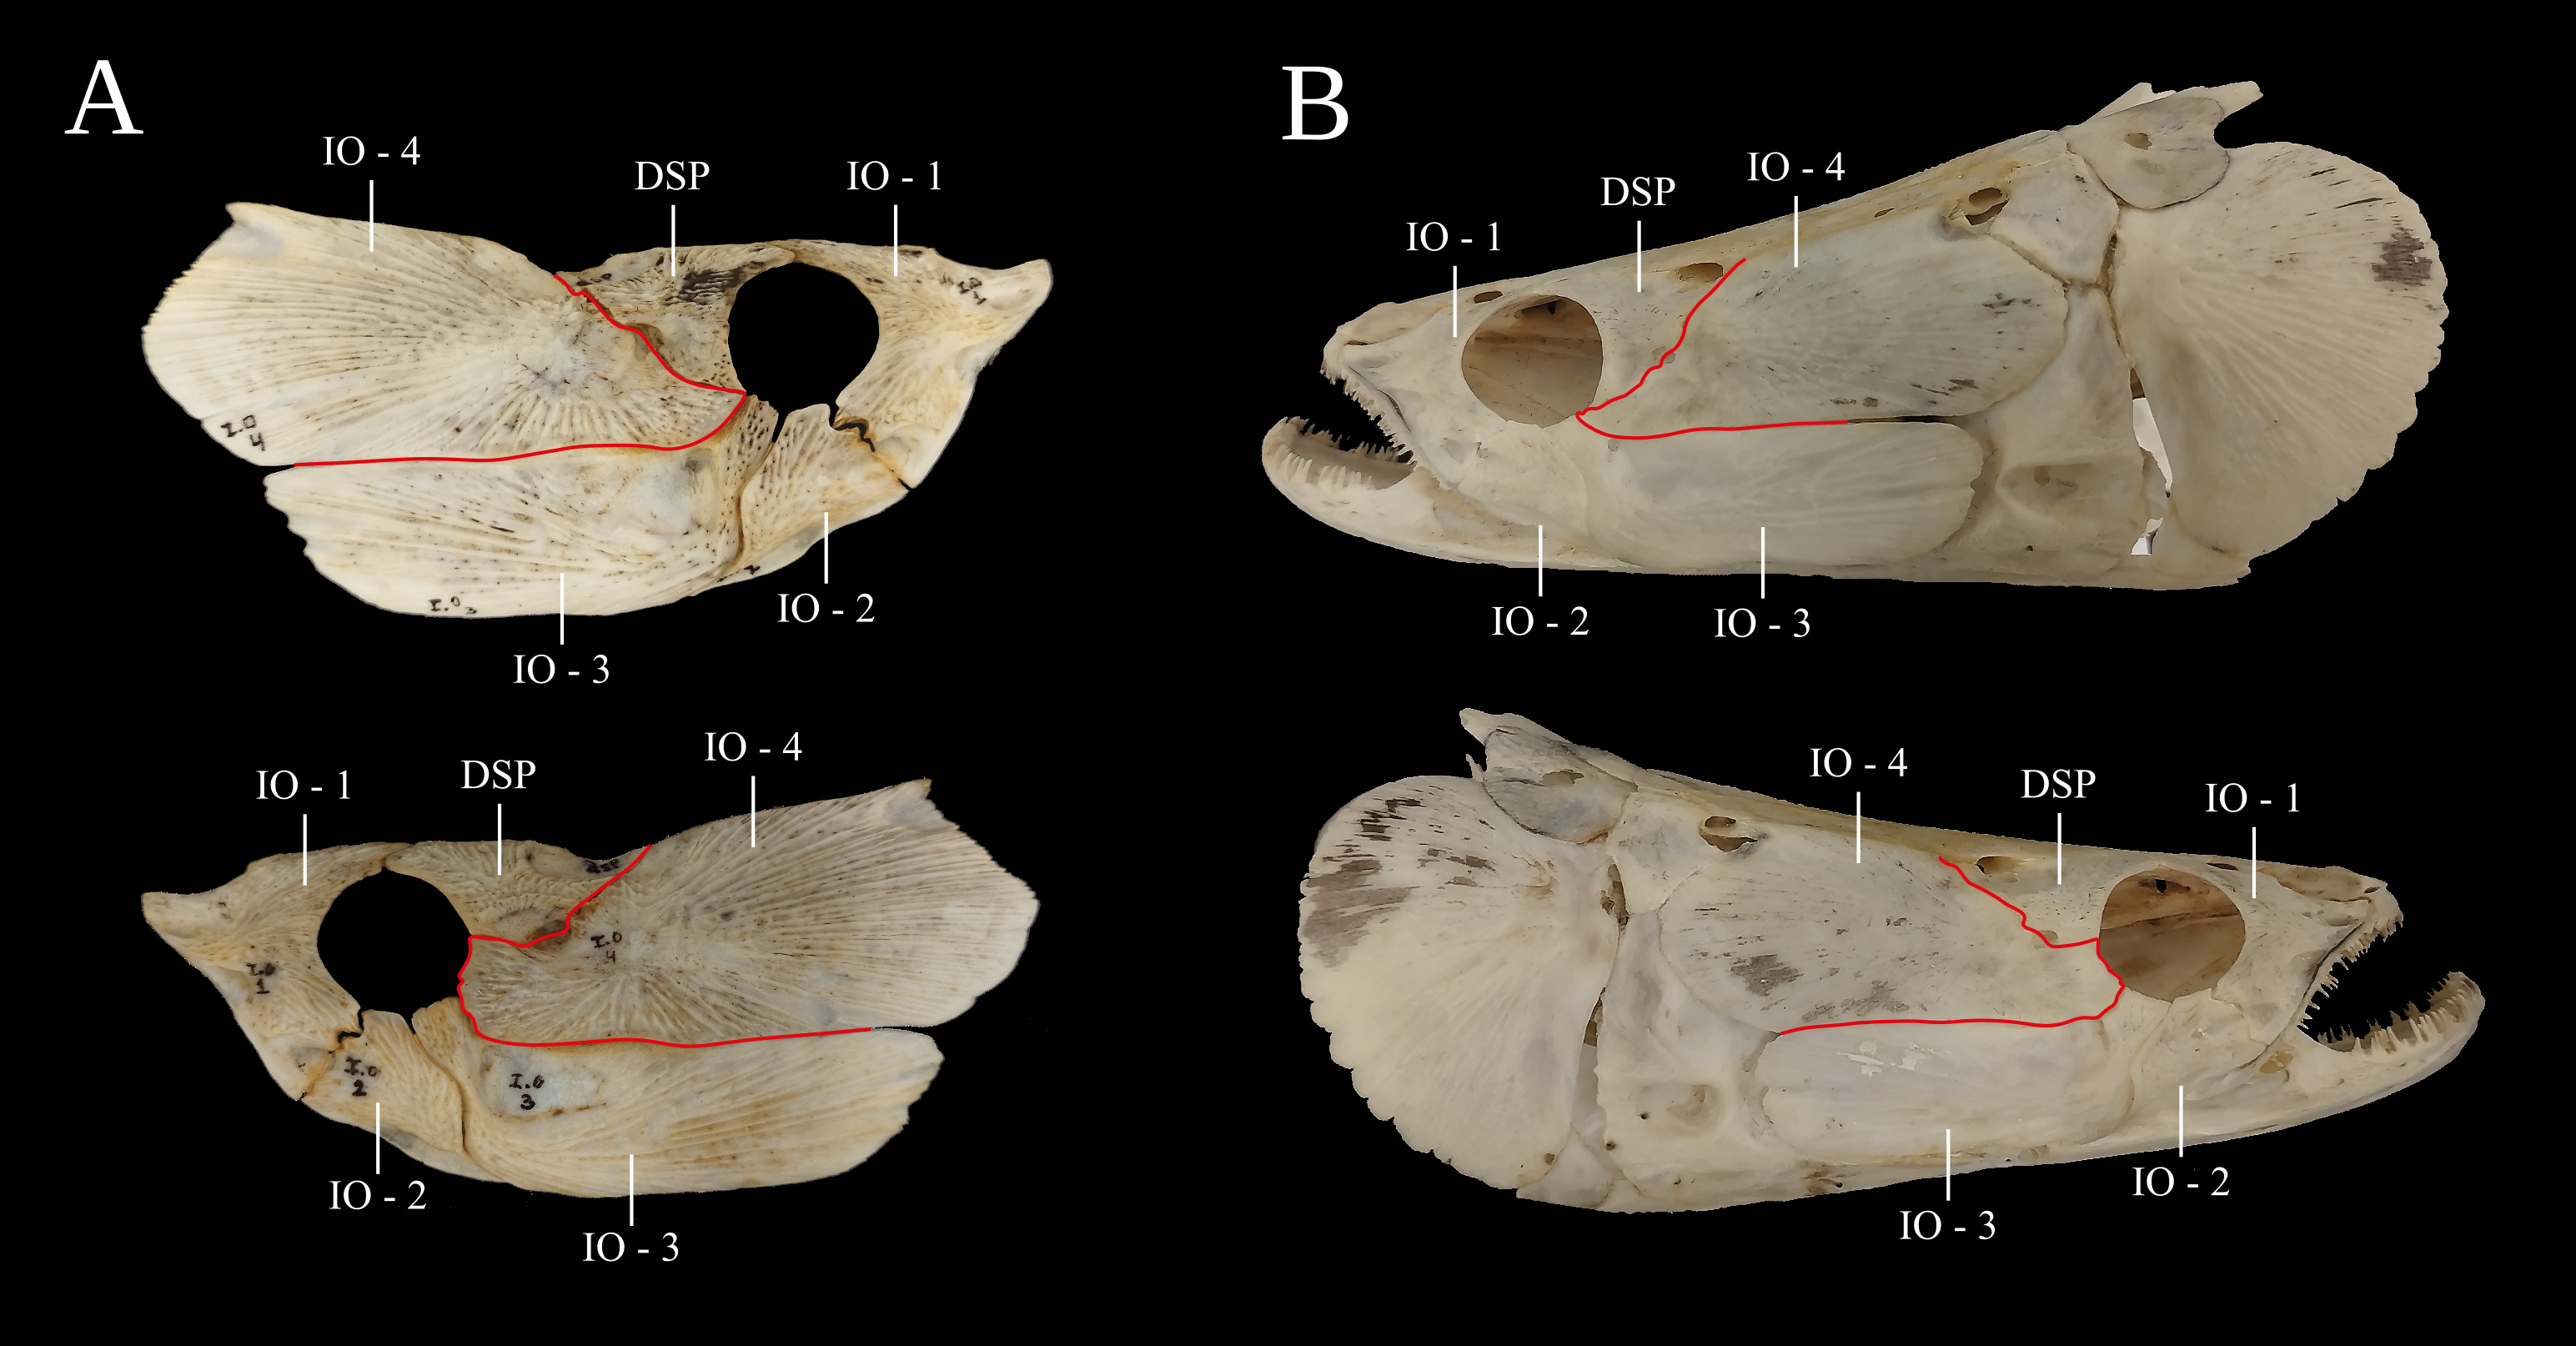
FIGURE. 6| Bones of the lateral region of the head of Arapaima gigas demonstrating the observed asymmetries. A. Specimen from Santarém- PA. B. Specimen from the rio Purus. The red arrows indicate the insertion point in the orbit and the lines indicate the shape and width of the IO-4 on both sides of the head.
We observed variation in the extension of the supraoccipital process. In the specimen from Santarém, the tip of the supraoccipital (SO) process is almost at the same level as the posterior tip of the epiocciptal (EPO) processes. These EPO processes are slightly curved towards the SO. All the remaining examined specimens showed the tip of the SO process extending clearly beyond the EPO processes (Fig. 7).
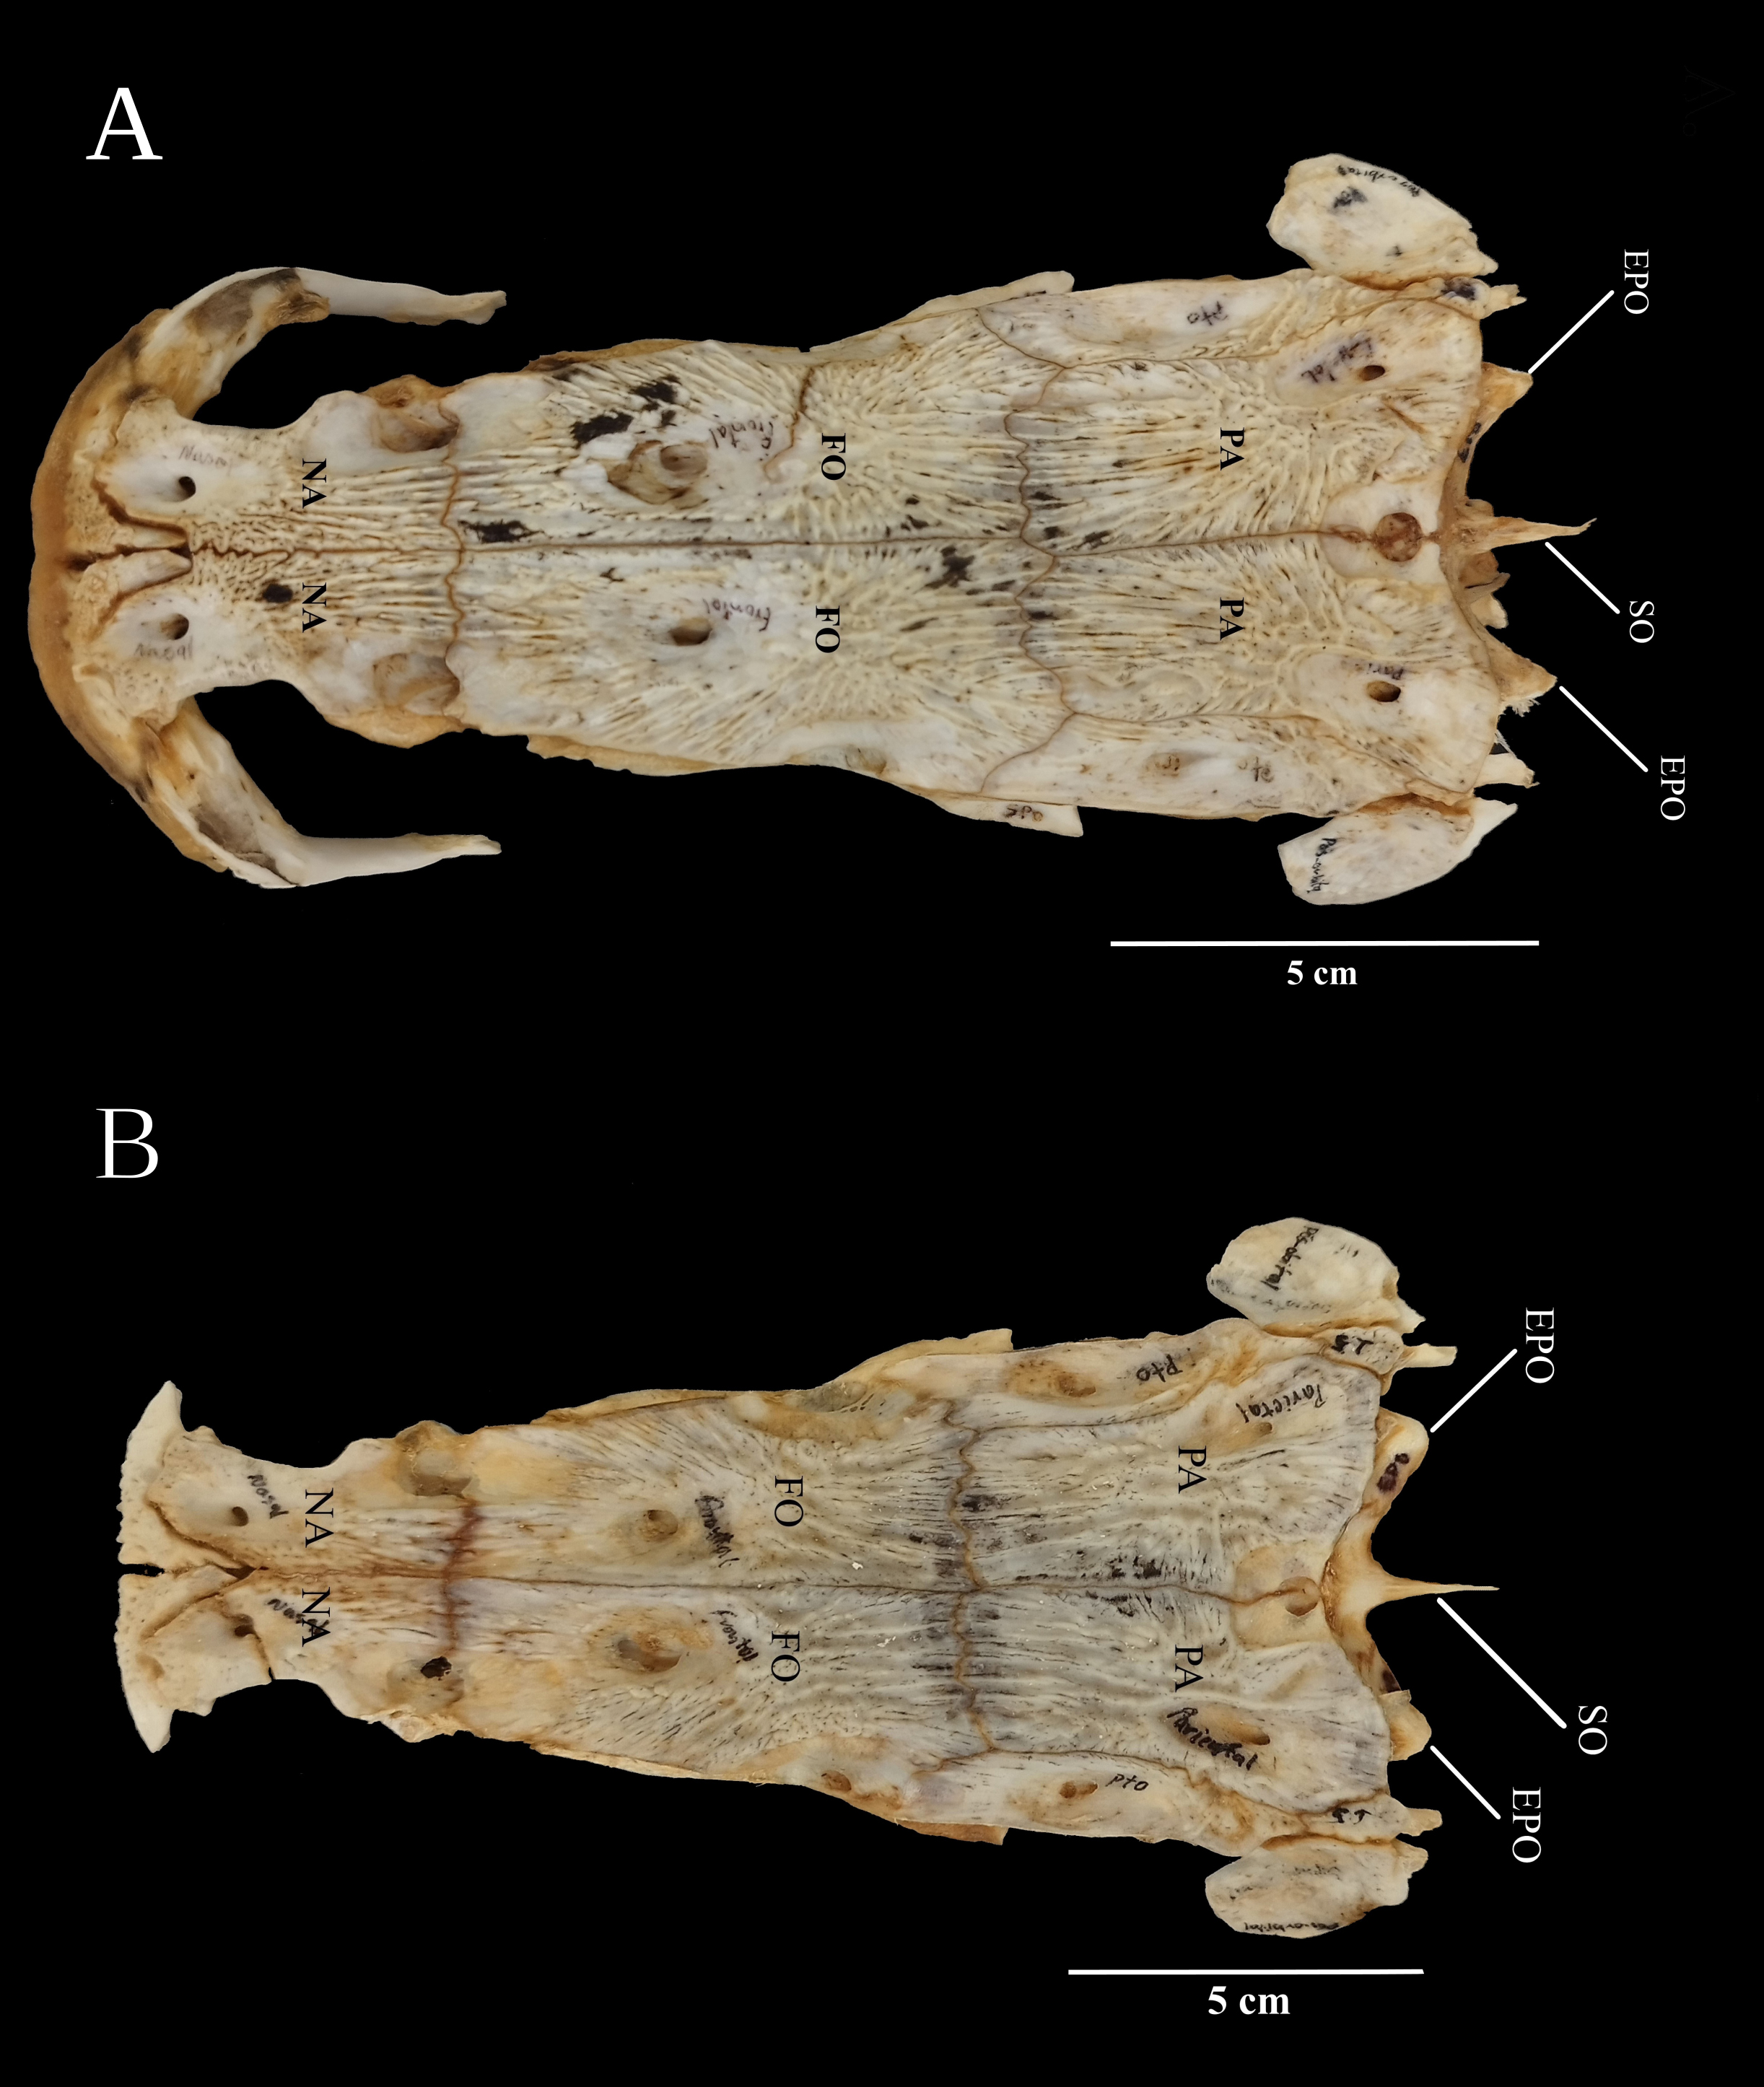
FIGURE 7| Neurocranium of Arapaima gigas, dorsal view. Extension of the supraocciptal (SO) process related to the epiocciptal (EPO) processes. A. Specimen from Santarém (INPA-ICT 60197), 118 cm SL; B. Specimen from Purus (INPA-ICT 60188), 112 cm SL.
Concerning general morphology, it was observed that some specimens showed a wide variation in the depth of the caudal fin, and the length and depth of the caudal peduncle. As cited above during the description of the morphometric results, these anatomical areas are quite subject to variation among these fishes. In the population from the rio Purus, we observed that some specimens showed a shallow caudal fin, with the depth of the caudal fin varying from 8.5% SL, and a long caudal peduncle (6.4% SL) to specimens with a deep caudal fin (14.2% SL) and a short caudal peduncle (4.4% SL). In the specimens from other localities, the variation was less conspicuous, although the variation in the depth of caudal peduncle was visually observed. Nevertheless, the round shape of the caudal fin seems to be generalized among all four populations. In some cases, depending on the size of the specimen, the posterior rays of the dorsal and anal fins can reach or go beyond the caudal fin base.
Besides, it was observed that in some individuals, from all the localities, there is a clear difference in the point of insertion of the dorsal fin in relation to the insertion of the anal fin, with the dorsal fin insertion being anterior to the anal fin. Also, the relationship between the heights of the dorsal fin and the anal fin can vary. The generalized pattern is that the dorsal fin is deeper than the anal fin.
The dorsalmost preopercular capsule shape was cited by Stewart (2013) as a diagnostic character for A. leptosoma. This structure showed a large variation in size, shape, and visibility among the specimens from all the localities, with the generalized pattern of being elongated and slightly expanded posteriorly.
Discussion
Comparison between the genetic analyses of pirarucu. The area of occurrence of the natural populations genetically analyzed in the present work expands to more than 1,200 km, from the west of the Amazon, in a region called alto Solimões, towards the east, lower Amazon, in the Santarém municipality, and it showed low genetic variability. Additional samples incorporated into the analysis also did not show any genetic structure to support the presence of more than one species. Thus, the present work represents an additional support to previous results (Hrbek et al., 2005; Farias et al., 2019; Nogueira et al., 2020a).
Previous analyses demonstrated distinct genetic structures in populations of pirarucu, located more than 1,500 km apart in the Amazonas-Solimões system, using different markers: microsatellites and mitochondrial (Hrbek et al.,2005); microsatellites in Araripe et al. (2013); mitochondrial DNA, NADH and ATPase in Farias et al. (2019); Cytochrome b (Cytb), the Control Region, Cytochrome Oxidase I (COI) and NADH dehydrogenase subunit 2 (ND2) in Nogueira et al. (2020b) and in populations from the Amazon and Tocantins-Araguaia basins (Hrbek et al., 2005; Farias et al., 2019; Nogueira et al. (2020a). Genetic differences between populations of the Amazon and Tocantins-Araguaia basins have already been demonstrated with freshwater dolphins, with the description of a new species of Inia (Hrbek et al., 2014).
The present work represents the first effort to consolidate genetic and morphological information from specimens of Arapaima gigas from different natural populations along the Amazonas-Solimões system. In the morphometric and meristic analyses, the holotype of A. leptosoma was included, the sole representative of the species collected in the rio Solimões, close to the mouth of the rio Purus. Our results pointed to a large morphological variation between the analyzed populations.
All the analyzed specimens were collected in ‘várzea’ lakes, meaning a similar kind of environment of white water or dark water strongly influenced by a main white-water river. As the pirarucu is a highly threatened species under the IUCN standards, our samples were obtained in management areas and they were restricted to a legally permitted size, that is, above 1.2 m of TL (except for the material from Santarém). The comparative table of the measured specimens revealed low indices of standard deviation, demonstrating the consistency of the corporal measurements.
PCA and LDA analyses, with A. leptosoma included, showed complementary results. In the PCA, the measures in percentages of SL showed a similar trend in the corporal proportion among all populations (Juruá, Purus, alto Solimões, Santarém and A. leptosoma), whereas the raw measures were more influenced by size, as expected. In the discriminant analysis, all populations were delimited by polygons, showing intrinsic morphological variation within each population and the clear separation of the Santarém specimens and A. leptosoma from the remaining specimens due to their smaller size.
All counts showed conservative results, with limited variation, and with A. leptosoma included in all intervals, except for the premaxillary number of teeth (32 in A. leptosoma vs. 34–41 in the others). We also tentatively included the counts available in Stewart (2013) for A. agassizii, but some measures showed low reliability. In all observed specimens, mandibular teeth were disposed in only one series, not in 2–2.5 irregular series of teeth, as cited by Stewart for A. gigas. Stewart (2013a,b) refers these counts to the dry and stuffed holotype of Vastres cuvieri Valenciennes [A.] in Cuvier & Valenciennes,1847, a specimen of 203 cm of standard length, synonymized to Arapaima gigas, housed in the Museum National d`Historie Naturelle (MNHN, Paris) and the only type material available of A. gigas. This material, probably from Santarém, was not available for our analysis. None of the specimens examined in the present work, even the specimens from Santarém, showed more than one series of teeth. As we examined smaller specimens, the irregularity of dentition observed by Stewart in the holotype of A. gigas could be related to size. Further observations are necessary.
The largest number of specimens available for skeleton analyses was from Purus and Juruá. Bilateral asymmetry was observed in the shape of the IO-4 in specimens from different populations. We observed some variation in the shape and height of the dorsal and anal fins, as well as the shape of the caudal peduncle. However, the observed variation was not supported by genetic results and it was, consequently, considered insufficient for delimiting different species. On the other hand, variation in the morphology was expected based on the number of specimens and the geographic distance of the analyzed populations.
Based on the morphometric, meristic, and genetic analyses with mitochondrial COI, no evidence was found to suggest a new taxonomic entity in the observed pool of natural populations of pirarucu. Thus, the present work supports the fact that we have been working with only one species, Arapaima gigas. It was not possible for our results to correlate with either A. agassizii (an iconotype) or A. leptosoma, due to the lack of reliable data for the former and the scarcity of information for the latter, both of which are known only from their type specimens, with no information available on morphological variation or molecular data. In the case of A. leptosoma,several specimens from the lower rio Purus were analyzed, with the expectation that we could recover any individual with the characteristics of this species, since its type locality is the rio Solimões, near the mouth of the rio Purus. In fact, we realized that many of A. leptosoma features are intermingled with the overall morphological variation observed among the specimens from the different populations. Furthermore, the A. leptosoma individual was the smallest specimen analyzed, and most of the differences observed in body proportions were due to its small size.
Among the five species included in Arapaima, the only ones with a holotype are A. leptosoma from rio Solimoes near mouth of rio Purus, A. mapae, from Amapá State, A. arapaima from rio Rupununi, Guyana, and A. gigas, probably from Santarém. The lack of more detailed information on the species of Arapaima recently validated by Stewart (2013), as well as the lack of specimens in collections or museums (due to the large size of the specimens), constrain our knowledge about the possible natural morphological variation within the different species assigned to Arapaima and how they compare with each other.
Although some genetic variance was detected in populations 500 to 600 km apart (Hrbek et al., 2005; Araripe et al.,2013), it was hypothesized that gene flow would be limited between populations more than 1,500 km of distance apart. However, more attention should be given to populations in Amapá State, Guyanean drainages and the Tocantins-Araguaia system, and to see how they compare to western and central Amazon populations, as genetic variation was detected in very distant populations.
As we have compared sequences of Arapaima representatives already available in genetic data banks (GenBank, BOLD) from previous works with our own, reaching similar results, and the morphological variation observed was consistent among the populations, we decided to assign our studied material to A. gigas for the sake of nomenclatural stability and conservation purposes.
Although some genetic variance was detected in populations 500 to 600 km apart (Hrbek et al., 2005; Araripe et al.,2013), it was hypothesized that gene flow would be limited between populations more than 1,500 km apart. However, more attention should be given to populations in Amapá State, Guyanean drainages and the Tocantins-Araguaia system, and to see how they compare to western and central Amazon populations, as genetic variation was detected in very distant populations.
History of Arapaima in the Amazon. The Amazon basin, beyond its continental dimensions, stretching for more than seven million km2, represents a giant mosaic of interconnected aquatic and forest environments (Goulding et al., 2003; Albert et al., 2020). Among the biogeographic patterns proposed by Dagosta, de Pinna (2017, 2019) and Albert et al. (2020), some species have continental areas of distribution, such as Arapaima gigas. However, these highly distributed taxa share features like an origin associated with the early Paleogene (if not of the species itself, but of closely related ones), large size, notable resilience to different environments, and limited vagility of adults (and also, passive dispersion of the young) (Dagosta, de Pinna, 2017; Albert et al., 2020) or active migration (Araujo-Lima, Ruffino, 2003; Barthem, Goulding, 2007; Barthem et al., 2017).
The only well-documented fossil record of Arapaima is from La Venta, rio Magdalena basin, in Colombia, with the distinct morphology of the base of the skull, basioccipital and anterior vertebrae very similar to the extent Arapaima (Lundberg, Chernoff, 1992). This record, dated to approximately 13 million years ago, reveals the longtime of existence and occurrence of this lineage in the north of the Amazon. Currently, Arapaima is extinct from the Magdalena basin. Thus, this record is presumably anterior to the last and final uplift of the eastern range of the Andes that isolated the Magdalena from the rest of the Amazon, around 11 Ma (Hoorn et al., 1995).
The process of colonization of taxa such as the pirarucu along the entire Amazon basin, although not yet fully understood, highlights the putative capacity for the establishment of successful populations of the taxon from an initial point of origin (cradle theory) and also indicates a low extinction rate over time (museum theory) (Rangel et al., 2018; Albert et al., 2020). The displacement capacity of Arapaima seems to be totally dependent on the hydrologic cycle of the waters of the basin, following the rising and lowering of the waters, entering large flooded areas during high waters (Araripe et al., 2013; Nogueira et al., 2020a,b), escaping from confined waters during the droughts, or even following large schools of fish (local fishermen, pers. comm.).
However, the extent of displacement of an individual pirarucu during its lifetime is unknown. Certainly, the pirarucu can survive in inhospitable environments, such as hypoxic waters, due to its obligatory air breathing. It has a long nesting period and parental care, is well adapted to survive in almost any environment, and is a long-lived fish, with a life expectancy exceeding 10 years (Queiroz, 2000). Furthermore, the pirarucu is a voracious predator, with a wide range of potential prey. Pirarucu populations have been successfully established in different Neotropical river basins, reaching as far south as the USA (Florida), likely introduced through escapes from aquariums or captive fish tanks. The pirarucu is eligible for the list of species that comprise the Biodiversity Conservation Paradox dilemma, proposed by Vellend (2017) and Markova et al. (2020), species that are threatened in their original distribution area and become dangerously successful outside of it, threatening local biodiversity. The presence of adult pirarucu (one of them a reproductive female) in Sumatra and Java, likely originating from the ornamental trade, has generated much concern and has been identified as a threat to natural fish populations in Indonesia (Markova et al., 2020). In Brazil, the pirarucu is present in practically all states of the country, except Rio Grande do Sul, and has become a threat mainly in the basins of the São Francisco and Paraná rivers (Souza et al., 2022). On the other hand, our natural pirarucu populations urgently need an assessment of their real conservation status, as well as a better understanding of the trade involving the species.
Thus, for conservation purposes, we are considering A. gigas as a workable taxonomic entity. Genetic variation within distinct populations should be analyzed in future studies. Besides, Arapaima populations from the Amapá, Tocantins-Araguaia and Essequibo drainages should be more thoroughly examined morphologically and genetically, as the reduction of gene flow between populations seems to be related to geographic distance.
Acknowledgments
Thanks to the Coleção de Peixes INPA for their support and assistance in registering the vouchers. To the PELD/DIVA project, which provided logistical support during collections in the rio Purus. To the Juruá Institute, which provided logistical support during collections in the rio Juruá. To Sapopema Brasil, Poliane Batista, and Cárlison Oliveira, who provided support in Santarém, Pará. To the Associação de Manejadores de Pirarucu e Preservação Ambiental (AMPPA) of Tonantins-AM, for their support in collections in the alto rio Solimões. To LEGAL/UFAM, which provided the infrastructure that enabled the molecular analyses. We would like to thank all the managers, fishermen, and members of the riverside communities who assisted during the fieldwork.
References
Albert JS, Tagliacollo VA, Dagosta F. Diversification of Neotropical freshwater fishes. Annu Rev Ecol Evol Syst. 2020; 51(1):27–53. https://doi.org/10.1146/annurev-ecolsys-011620-031032
Amaral ESR. O Manejo comunitário de pirarucu (Arapaima gigas) como alternativa econômica para os pescadores das RDS’s Amanã e Mamirauá, Amazonas, Brasil. [Master Thesis]. Santarém: Universidade Federal do Pará; 2009.
Amaral E, Sousa I, Gonçalves AC, Braga R, Ferraz P, Carvalho G. Manejo de pirarucus (Arapaima gigas) em lagos de várzea de uso exclusivo de pescadores urbanos: baseado na experiência do Instituto Mamirauá junto a Colônia de Pescadores Z-32 de Maraã na cogestão do complexo do Lago Preto, Reserva de Desenvolvimento Sustentável Mamirauá – RDSM. Tefé: IDSM. 2020; 1:76.
Arantes C, Garcez DS, Castello L. Population densities of pirarucu (Arapaima gigas, Teleostei, Osteoglossidae) in lakes in the Sustainable Development Reserves of Mamirauá and Amanã, Amazonas, Brazil. UAKARI. 2006; 2(1):37–43.
Arantes CC, Castello L, Stewart DJ, Cetra M, Queiroz HL. Effects of population density on growth and reproduction of arapaima in an Amazonian rio- floodplain. Ecol Freshw Fish. 2010; 19(3):455–65. https://doi.org/10.1111/j.1600-0633.2010.00431.x
Araripe J, Rêgo PSD, Queiroz H, Sampaio I, Schneider H. Dispersal capacity and genetic structure of Arapaima gigas on different geographic scales using microsatellite markers. PLoS ONE. 2013; 8(1):e54470. https://doi.org/10.1371/journal.pone.0054470
Araujo-Lima CARM, Ruffino ML. Migratory Fishes of the Brazilian Amazon. In: Carolsfeld J, Harvey B, Ross C, Baer A, editors. Migratory fishes of South America. Biology fisheries and conservation status; 2003. p.169–202.
Barthem R, Goulding M. An unexpected ecosystem: the Amazon as revealed by fisheries. Missouri Botanical Garden Press; 2007.
Barthem RB, Goulding M, Leite RG, Cañas C, Forsberg B, Venticinque E et al. Goliath catfish spawning in the far western Amazon confirmed by the distribution of mature adults, drifting larvae and migrating juveniles. Sci Rep. 2017; 7(1):41784. https://doi.org/10.1038/srep41784
Bookstein F, Chernoff B, Elder R, Humphries J, Smith JG, Strauss R. Morphometrics in evolutionary biology. The Academy of Natural Sciences of Philadelphia, Special Publication. 1985; 15(1):277.
Castello L. Lateral migration of Arapaima gigas in floodplains of the Amazon. Ecol Freshw Fish. 2008; 17(1):38–46. https://doi.org/10.1111/j.1600-0633.2007.00255.x
Castello L, Stewart DJ, Arantes CC. O que sabemos e precisamos fazer a respeito da conservação do pirarucu (Arapaima spp.) na Amazônia. In: Figueiredo ESA, editor. Biologia, conservação e manejo participativo de pirarucus na Pan-Amazônia, Tefé: IDSM. 2013; (1):17–32. Available from: https://www.researchgate.net/publication/280683192_O_que_sabemos_e_precisamos_fazer_a_respeito_da_conservacao_do_pirarucu_Arapaima_spp_na_Amazonia
Castro Paz FP, Batista JDS, Porto JIR. DNA barcodes of rosy tetras and allied species (Characiformes: Characidae: Hyphessobrycon) from the Brazilian Amazon basin. PLoS ONE. 2014; 9(5):e98603. https://doi.org/10.1371/journal.pone.0098603
Colatreli OP, Meliciano NV, Toffoli D, Farias IP, Hrbek T. Deep phylogenetic divergence and lack of taxonomic concordance in species of Astronotus (Cichlidae). Int J Evol Biol. 2012; (1):915265. https://doi.org/10.1155/2012/915265
Cuvier G, Valenciennes A. Histoire naturelle des poissons. Tome dixneuvième. Suite du livre dixneuvième. Brochets ou Lucioïdes. Livre vingtième. De quelques familles de Malacoptérygiens, intermédiaires entre les Brochets et les Clupes. Paris: P. Bertrand. 1847; 19:554–90. https://doi.org/10.5962/bhl.title.12283
Dagosta FCP, de Pinna MCC. Biogeography of Amazonian fishes: deconstructing rio basins as biogeographic units. Neotrop Ichthyol. 2017; 15(3):e170034. https://doi.org/10.1590/1982-0224-20170034
Dagosta FCP, de Pinna M. The fishes of the Amazon: distribution and biogeographical patterns, with a comprehensive list of species. Bull Am Mus Nat Hist. 2019; 2019(431):1–163. https://doi.org/10.1206/0003-0090.431.1.1
De La Torre L. A method for cleaning skulls of specimens preserved in alcohol. J Mammal. 1951; 32(2):231–32. https://doi.org/10.1093/jmammal/32.2.231
Excoffier L, Smouse PE, Quattro JM. Analysis of molecular variance inferred from metric distances among DNA haplotypes: application to human mitochondrial DNA restriction data. Genetics. 1992; 131(2):479–91. https://doi.org/10.1093/genetics/131.2.479
Excoffier L, Lischer HEL. Arlequin suite ver 3.5: an integrated software package for population genetics data analysis. Mol Ecol Resour. 2015; 10(3):564–67. https://doi.org/10.1111/j.1755-0998.2010.02847.x
Farias IP, Willis S, Leão A, Verba JT, Crossa AM, Foresti F et al. The largest fish in the world’s biggest rio: genetic connectivity and conservation of Arapaima gigas in the Amazon and Araguaia-Tocantins drainages. PLoS ONE. 2019; 14(8):e0220882. https://doi.org/10.1371/journal.pone.0220882
Fisher RA. The use of multiple measurements in taxonomic problems. Ann Eugen. 1936; 7(2):179 –88. https://doi.org/10.1111/j.1469-1809.1936.tb02137.x
Fricke R, Eschmeyer WN, Fong JD. Eschmeyer’s catalog of fishes: genera/species by family/subfamily. San Francisco: California Academy of Science; 2025. Available from: http://researcharchive.calacademy.org/research/ichthyology/catalog/SpeciesByFamily.asp
Goulding M, Barthem R, Ferreira E. The Smithsonian Atlas of the Amazon. Washington: Smithsonian Institute; 2003.
Hall T. BioEdit: a user-friendly biological sequence alignment editor and analysis program for Windows 95/98/NT. Nucleic Acids Symp Ser. 1999; 41(1):95–98.
Hall ER, Russel WC. Dermestid beetles as an aid in cleaning bones. J Mammal. 1933; 14(4):58–59. https://doi.org/10.1093/jmammal/14.4.372
Hammer O, Harper DAT, Ryan PD. PAST: Paleontological Statistics Software Package for Education and Data Analysis. Paleontol Electron. 2001; 4(1):1–09. Available from: https://palaeo-electronica.org/2001_1/past/past.pdf
Hilton EJ. Comparative osteology and phylogenetic systematics of fossil and living bony-tongue fishes (Actinopterygii, Teleostei, Osteoglossomorpha). Zool J Linn Soc. 2003; 137(1):1–100. https://doi.org/10.1046/j.1096-3642.2003.00032.x
Hilton EJ, Lavoué S. A review of the systematic biology of fossil and living bony-tongue fishes, Osteoglossomorpha (Actinopterygii: Teleostei). Neotrop Ichthyol. 2018; 16(3):e180031. https://doi.org/10.1590/1982-0224-20180031
Hoorn C, Guerrero J, Sarmiento GA, Lorente MA. Andean tectonics as a cause for changing drainage patterns in Miocene northern South America. Geology. 1995; 23(3):237–40. https://doi.org/10.1130/0091-7613(1995)023<0237:ATAACF>2.3.CO;2
Hrbek T, Farias IP. The complete mitochondrial genome of the pirarucu (Arapaima gigas, Arapaimidae, Osteoglossiformes). Gen Mol Biol. 2008; 31(1):293–302. https://doi.org/10.1590/S1415-47572008000200024
Hrbek T, Farias IP, Crossa M, Sampaio I, Porto JI, Meyer A. Population genetic analysis of Arapaima gigas, one of the largest freshwater fishes of the Amazon basin: implications for its conservation. Anim Conserv. 2005; 8(3):297–308. https://doi.org/10.1017/S1367943005002210
Hrbek T, Silva VMF, Dutra N, Gravena W, Martin AR, Farias IP. A new species of rio dolphin from Brazil or: how little do we know our biodiversity. PLoS ONE. 2014; 9(1):e83623. https://doi.org/10.1371/journal.pone.0083623
Instituto Brasileiro de Meio Ambiente e dos Recursos Naturais Renováveis (IBAMA). Instrução Normativa nº 34, de 18 de junho de 2004. Brasília, DF. 2004. Available from: https://www.ibama.gov.br/component/legislacao/?view=legislacao&legislacao=111150
Kumar S, Stecher G, Li M, Knyaz C, Tamura K. MEGA X: Molecular Evolutionary Genetics Analysis across computing platforms. Mol Biol Evol. 2018; 35(6):1547–49. https://doi.org/10.1093/molbev/msy096
Lundberg JGL, Chernoff B. A Miocene fossil of the Amazon fish Arapaima (Teleostei, Arapaimidae) from the Magdalena rio region of Colombia – Biogeography and evolutionary implications. Biotropica. 1992; 24(1):2–14. https://doi.org/10.2307/2388468
Machado VN, Collins RA, Ota RP, Andrade MC, Farias IP, Hrbek T. One thousand DNA barcodes of piranhas and pacus reveal geographic structure and unrecognised diversity in the Amazon. Sci Rep. 2018; 8(1):8387. https://doi.org/10.1038/s41598-018-26550-x
Mantel N. The detection of disease clustering and a generalized regression approach. Cancer Res. 1967; 27:209–20.
Markova V, Sandal GM, Pallesen S. Immigration, acculturation, and preferred help-seeking sources for depression: comparison of five ethnic groups. BMC Health Serv Res. 2020; 20:648. https://doi.org/10.1186/s12913-020-05478-x
Medrano JF, Aasen E, Sharrow L. DNA extraction from nucleated red blood cells. Biotechniques. 1990; 8(1):43.
Mueller O, Green A. Arapaima gigas – Market study: current status of Arapaima global trade and perspectives on the Swiss, French and UK markets. Cocha El Dorado: UNCTAD; 2006.
Nogueira F, Rêgo PS, Queiroz H, Venere P, Varela ES, Sampaio I et al. Genetic diversity and structuring in the arapaima (Osteoglossiformes, Osteoglossidae) population reveal differences between the Amazon and the Tocantins-Araguaia basins. An Acad Bras Ciênc. 2020a; 92(1):e20180496. https://doi.org/10.1590/0001-3765202020180496
Nogueira F, Amaral M, Malcher G, Reis N, Melo MA, Sampaio I et al. The arapaima, an emblematic fishery resource: Genetic diversity and structure reveal the presence of an isolated population in Amapá. Hydrobiologia. 2020b; 847(15):3169–83. https://doi.org/10.1007/s10750-020-04292-0
Ota RP, Machado VN, Andrade MC, Collins RA, Farias IP, Hrbek T. Integrative taxonomy reveals a new species of pacu (Characiformes: Serrasalmidae: Myloplus) from the Brazilian Amazon. Neotrop Ichthyol. 2020; 18(1):e190112. https://doi.org/10.1590/1982-0224-20190112
Paithankar KR, Prasad KSN. Precipitation of DNA by polyethylene glycol and etanol. Nucleic Acids Res. 1991; 19(6):1346. https://doi.org/10.1093/nar/19.6.1346
Pedersen TL. Patchwork: the composer of plots. R package version 1.3.2. CRAN: Contributed Packages; 2019. https://doi.org/10.32614/cran.package.patchwork
Queiroz HL. Natural history and conservation of pirarucu, Arapaima gigas, at the Amazonian várzea: red giants in muddy waters [PhD Dissertation]. Saint Andrews: University of Saint Andrews; 2000.
R Development Core Team. R: a language and environment for statistical computing. Version 4.5.0. Vienna, Austria: R Foundation for Statistical Computing; 2025. Available from: https://www.R-project.org/
Rangel TF, Edwards NR, Holden PB, Diniz-Filho JAF, Gosling WD, Coelho MTP et al. Modeling the ecology and evolution of biodiversity: biogeographical cradles, museums, and graves. Science. 2018; 361(6399):eaar5452. https://doi.org/10.1126/science.aar5452
RStudio Team. RStudio: integrated development environment for R. Versão 4.3.3. Boston: RStudio, PBC; 2025. Available from: https://www.posit.co/downloads/
Salzburger W, Ewing GB, Von Haeseler A. The performance of phylogenetic algorithms in estimating haplotype genealogies with migration. Mol Ecol. 2011; 20(9):1952–63. https://doi.org/10.1111/j.1365-294X.2011.05066.x
Schinz HR. Das Thierreich eingetheilt nach dem Bau der Thiere als Grundlage ihrer Naturgeschichte und der vergleichenden Anatomie. Mit vielen Zusätzen versehen von H. R. Schinz. Cotta, Stuttgart & Tübingen. 1822; 2(7):1–835.
Sousa RGC, Pereira LS, CintraMA, Freitas CEC, Mereles MA, Zacardi DM et al. Status of Arapaima spp. in Brazil: threatened in its places of origin, a rapidly spreading invader elsewhere. Manag Biol Invasion. 2022; 13(4):631–43.
Spix JBV, Agassiz L. Selecta genera et species piscium quos in itinere per Brasiliam annos MDCCCXVII–MDCCCXX jussu et auspiciis Maximiliani Josephi I. Bavariae regis augustissimi peracto. Selecta Piscium Brasiliam: Part 1:i–xvi + i–ii + 1–82, pls. 1–48, Part 2:83–138, pls. 49–101. [Part 1 published June 1829, Part 2 January 1831], 1829.
Stewart DJ. Re-description of Arapaima agassizii (Valenciennes), a rare fish from Brazil (Osteoglossomorpha, Osteoglossidae). Copeia. 2013a; 2013(1):38–51. https://doi.org/10.1643/CI-12-013
Stewart DJ. A new species of Arapaima (Osteoglossomorpha, Osteoglossidae) from the Solimões river, Amazonas State, Brazil. Copeia. 2013b; 2013(3):470–76. https://doi.org/10.1643/CI-12-017
Tagliacollo VA, Tan M, Reis RE, Gaia R, Carrijo V, Ranuzi M et al. Time-calibrated phylogeny of neotropical freshwater fishes. Front Bioinform. 2024; 4:1433995. https://doi.org/10.3389/fbinf.2024.1433995
Thompson JD, Higgins DG, Gibson TJ. CLUSTRAL W: Improving the sensitivity of progressive multiple sequence alignment through sequence weighting, position-specific gap penalties and weight matrix choice. Nucleic Acids Res. 1994; 22(22):4672–80.
Varella HR, Zuanon J, Kullander SO, López-Fernández H. Teleocichla preta, a new species of cichlid from the Rio Xingu Basin in Brazil (Teleostei: Cichlidae). J Fish Biol. 2016; 89(3):1551–69. https://doi.org/10.1111/jfb.13053
Vellend M. The biodiversity conservation paradox. American Scientist. 2017; 105:94. https://doi.org/10.1511/2017.105.2.94
Venables WN, Ripley BD. MASS – Modern Applied Statistics with S. Fourth Edition. New York: Springer Science & Business Media; 2002.
Veríssimo J. A pesca na Amazônia. Livraria clássica de Alves; 1895.
Viana JP, Castello L, Damasceno JMB, Amaral ES, Estupiñan GM, Arantes C et al. Manejo comunitário do pirarucu Arapaima gigas na Reserva de Desenvolvimento Sustentável Mamirauá-Amazonas, Brasil. Áreas aquáticas protegidas como instrumento de gestão pesqueira. Série Áreas Protegidas do Brasil. 2007; 4:239–61.
Watson LC, Stewart DJ, Teece MA. Trophic ecology of Arapaima in Guyana: giant omnivores in neotropical floodplains. Neotrop Ichthyol. 2016; 11(2):341–49. https://doi.org/10.1590/S1679-62252013000200012
Wickham H. dplyr: a grammar of data manipulation. R package version 1.1.4. 2015.
Wickham H, François R, Henry L, Müller K, Vaughan D. Dplyr: a grammar of data manipulation. R package version 1.1.4. 2023. https://doi.org/10.32614/CRAN.package.dplyr
Wright S. Evolution and the genetics of populations. The Theory of Gene Frequencies, Vol. 2. Chicago: University of Chicago Press; 1969.
Yuan Y, Horikoshi M, Li W. ggfortify: unified interface to visualize statistical results of popular R packages. The R Journal. 2016; 478–89. https://CRAN.R-project.org/package=ggfortify
Authors

Valdenor Magalhães1 Nasrah Muhammad Calderaro Handam2, Micael Cavalli3, Izeni Pires Farias2,4 and Lúcia Rapp Py-Daniel3
[1] Programa de Pós-Graduação em Biologia de Água Doce e Pesca Interior, Instituto Nacional de Pesquisas da Amazônia. Coleçãode Peixes. Av. André Araujo, 2936, 69067-375, Manaus, AM, Brazil. (VN) vvaldenorsilva@gmail.com (corresponding author).
[2] Laboratório de Evolução e Genética Animal, Universidade Federal do Amazonas, Av. Octávio Jordão Ramos, 6200, Coroado,69077-000, Manaus, AM, Brazil. (NMCH) nasrahhamdan@gmail.com, (IPF) izeni_farias@ufam.edu.br.
[3] Coleção de Peixes, Instituto Nacional de Pesquisas da Amazônia, Av. André Araujo, 2936, 69067-375, Manaus, AM, Brazil. (MC) micaelcavalli@gmail.com, (LRPD) luciarpd60@gmail.com.
[4] Instituto de Ciências Biológicas, Departamento de Genética – Laboratório de Evolução e Genética Animal, Universidade Federaldo Amazonas, Av. Octávio Jordão Ramos, 6200, Coroado, 69077-000, Manaus, AM, Brazil.
Authors’ Contribution 

Valdenor Magalhães: Conceptualization, Data curation, Formal analysis, Funding acquisition, Investigation, Methodology, Project administration, Resources, Software, Supervision, Validation, Visualization, Writing-original draft, Writing-review and editing.
Nasrah Calderaro Handam: Conceptualization, Data curation, Formal analysis, Funding acquisition, Investigation, Methodology, Project administration, Resources, Software, Supervision, Validation, Visualization, Writing-original draft, Writing-review and editing.
Micael Cavalli: Conceptualization, Data curation, Formal analysis, Funding acquisition, Investigation, Methodology, Project administration, Resources, Software, Supervision, Validation, Visualization, Writing-original draft, Writing-review and editing.
Izeni Pires Farias: Conceptualization, Data curation, Formal analysis, Funding acquisition, Investigation, Methodology, Project administration, Resources, Software, Supervision, Validation, Visualization, Writing-original draft, Writing-review and editing.
Lúcia Rapp Py-Daniel: Conceptualization, Data curation, Formal analysis, Funding acquisition, Investigation, Methodology, Project administration, Resources, Software, Supervision, Validation, Visualization, Writing-original draft, Writing-review and editing.
Ethical Statement
Due to regulations concerning pirarucu fisheries, the first phase of sampling occurred in already established management areas under license SISBIO Nº 84762–1.
Competing Interests
The author declares no competing interests.
Data availability statement
The authors confirm that the data supporting the findings of this study are available within the article.
AI statement
The authors did not use any AI-assisted technologies in the creation of this manuscript or its figures.
Funding
This work was supported by Coordenação de Aperfeiçoamento de Pessoal de Nível Superior – Brasil (CAPES) Financing Code 001, Fundação de Amparo à Pesquisa do Estado do Amazonas – FAPEAM/POSGRAD.
Supplementary Material
Supplementary material SUP
Peer Review
How to cite this article
Magalhães V, Handam NMC, Cavalli M, Farias IP, Rapp Py-Daniel L. Integrative taxonomy data are reconciled around Arapaima gigas (Osteoglossiformes: Arapaimidae) for the Brazilian Amazon. Neotrop Ichthyol. 2026; 24(2):e250191. https://doi.org/10.1590/1982-0224-2025-0191
Copyright
This is an open access article under the terms of the Creative Commons Attribution License, which permits use, distribution and reproduction in any medium, provided the original work is properly cited.
Distributed under
Creative Commons CC-BY 4.0

© 2025 The Authors.
Diversity and Distributions Published by SBI
 Accepted February 2, 2026
Submitted November 19, 2025
Epub July 03, 2026