
 Túlio Freire Xavier1,2
  , Luísa Valentim Melo de Vasconcelos Queiroz Véras1,2 and João Lucas Leão Feitosa1
PDF: Download Here | Supplementary: Sup | Cite this article
Section Editor: Osmar Luiz
Editor-in-chief: José Birindelli
Abstract
Os peixes contribuem para a biofonia dos recifes de coral, produzindo sons associados à corte, alimentação e defesa territorial. O ruído relacionado ao turismo pode se sobrepor à faixa de frequência desses sinais, afetando a comunicação acústica e os comportamentos associados. Avaliamos os efeitos do ruído induzido pelo turismo na biofonia de peixes recifais em duas áreas marinhas protegidas no nordeste do Brasil, incluindo locais com diferentes intensidades de uso turístico e exposição a fontes sonoras antrópicas. Nove tipos de sons de peixes foram identificados, e sua ocorrência diminuiu em áreas mais ruidosas. A análise de densidade espectral de potência (PSD) revelou perfis biofônicos com dois principais picos de energia, enquanto locais mais ruidosos apresentaram espectros mais achatados e de maior energia, nos quais o pico de baixa frequência deixou de ser evidente. Nesses locais, sons antrópicos coincidiram com maiores níveis de ruído e menor ocorrência de sons de peixes. A poluição sonora também esteve associada à redução nos valores do Índice de Complexidade Acústica (ACI), sendo a exposição às fontes de ruído a variável mais fortemente relacionada à diminuição da complexidade acústica. Esses resultados indicam que o ruído turístico está associado à redução da ocorrência de sons de peixes e a alterações na estrutura da paisagem sonora, destacando a necessidade de estratégias de mitigação em áreas marinhas protegidas recifais.
Palavras-chave: Biofonia, Monitoramento acústico passivo, Peixes recifais, Poluição sonora, Recifes de coral.
Introduction
The soundscape in reef environments is a crucial component of ecosystem functioning, as the sounds produced by marine organisms mediate key biological processes, such as mate location and larval recruitment (Salas et al., 2022; Amorim, 2023; Hawkins et al., 2025). A high complexity of biological sounds is often associated with healthier reef environments, reflecting the integrity of their community structure (Bolgan et al., 2018). Reef fish sounds are representative components in the soundscapes of reef environments, often comprising, along with marine invertebrates, the majority of detectable biophony, especially in low-frequency bands of less than 5 kHz (Kim et al., 2023; Song et al., 2023). These animals produce different sounds in various behavioral contexts, including territorial defense, courtship, mating, feeding, predation, and predator detection (Bertucci et al., 2014; Van Oosterom et al., 2016; Ladich, 2019; Amorim, 2023; Banse et al., 2024a; Azofeifa-Solano et al., 2025).
Fish sounds exhibit distinct sound characteristics that vary in temporal, frequency, and intensity parameters. General characteristics include a duration of less than one second and a frequency range typically between 0.05 and 2 kHz (Picciulin et al., 2013; Carriço et al., 2019; McCordic et al., 2021). A variety of fish sound types have been described as pulse series, long tonal calls with little or no frequency modulation, fast pulse trains, fast pulse sequences with very short intervals, and ultrafast pulse series characterized by short pulse periods, among others (Kasumyan, 2009; Desiderà et al., 2019). This variability can arise from multiple factors, including species-specific traits and morphological structures involved in sound production (Fine, Parmentier, 2015; Parmentier, Fine, 2016). The diversity of sound characteristics suggests that different sound types may vary in their detectability or expression under different external conditions. In reef environments, sound pollution sources are key factors that alter sound characteristics and, consequently, the behavioral activities associated with these sounds, as well as the emission and detection of acoustic signals by fishes (Popper, 2003).
Sources of sound pollution, such as recreational vessels, coastal development, and tourism activities, produce noise characterized by broad frequency bands, high amplitudes, and continuous temporal patterns (Hildebrand, 2009; Duarte et al., 2021). These noises often overlap with the frequencies used by reef fishes, creating potential for direct interference, such as acoustic masking and changes in behaviors associated with sound production and communication (Fonseca, Amorim, 2019; Popper, Hawkins, 2019). Acoustic masking, for example, can reduce the detectability and effectiveness of communication signals, while noise-induced stress may result in decreased sound production or changes in the temporal and frequency properties of sounds (De Jong et al., 2018; Ladich, 2019). Consequently, these acoustic disturbances can compromise essential behaviors, potentially affecting the health, abundance, and diversity of reef fish populations and, consequently, the functioning of reef ecosystems (Popper, Hawkins, 2019; De Jong et al., 2020).
The northeastern coast of Brazil harbors coral reefs that are frequently exposed to tourism-related activities (Ferreira, Maida, 2006). Due to the presence of coral formations near the shoreline, sometimes just a few meters from the beach (Leão et al., 2016), these reefs are susceptible to noise generated by tourism activities. This proximity encourages the use of reefs for recreational activities, such as boat traffic, jet ski use, and high visitor numbers, all of which are potential sources of sound pollution. In other coastal reef systems, sound pollution arising from anthropogenic pressures has been shown to contribute to sound pollution that can interfere with the sounds produced by reef fishes (Simpson et al., 2016; Duarte et al., 2021; Ferrier-Pagès et al., 2021). Reefs along the northeastern coast of Brazil support over 180 reef fish species (Araújo et al., 2020), distributed in several known soniferous fish families. Reef fishes are known to contribute to essential ecological functions, including nutrient cycling through excretion and sediment resuspension, prey population control, maintenance of trophic balance, contribution to reef bioerosion and sediment production, and influence on coral recruitment and benthic community structure (Allgeier et al., 2016; Morais et al., 2017; Feitosa et al., 2023; Sura et al., 2025). Therefore, the alteration or masking of sounds produced by reef fishes may disrupt their biological activities and, in turn, compromise the ecological functions they support within reef ecosystems.
Despite this ecological importance, research on the influence of tourism-related sound pollution on reef fish sound signals remains scarce in the Brazilian province. While previous studies have identified fish choruses and their association with protected areas (Borie et al., 2021), the effects of sound pollution on reef fish biophony are still to be investigated. Given this gap, our study aims to provide a baseline assessment of how tourism-related sound pollution is associated with patterns of reef fish sound production in northeastern Brazil. Specifically, in the present study, we aimed to (1) identify fish sounds and noises occurring at the monitored sampling sites; (2) differentiate the types of fish sounds occurring at these sites, and; (3) examine patterns of reef fish sound activity across gradients of tourism-related sound pollution.
Material and methods
Study area and sampling. The research was conducted in two distinct Marine Protected Areas (MPAs) situated along the northeastern coast of Brazil. One of them, the Costa dos Corais Marine Protection Area (APACC), extends approximately 135 km (08°45’36”S 35°06’45”W). The other, the Guadalupe Marine Protection Area (APAG), encompasses a total of 44,799 hectares, including 12,664 hectares of marine ecosystems (Fig. 1). The reef systems in both MPAs are aligned parallel to the coastline and are located in nearshore zones (Fig. 1). The regional climate is predominantly humid and tropical, with a marked division between a rainy season, occurring from April to August, and a dry season, from September through March (Maida, Ferreira, 1997).

FIGURE 1| Location of coral reefs in the study area at Carneiros and Tamandaré beaches, northeastern Brazil. Selected sampling sites (brown diamond): exposed – 1 and sheltered – 2 in an area with year-round tourism, and exposed – 3 and sheltered – 4 in an area with seasonal tourism, respectively. The dashed and solid lines represent the boundaries of APAG and APACC, respectively.
To evaluate which tourism-related factors can influence the acoustic complexity of reef fish sounds, two distinct reef areas with high tourist activity were selected, each differing in tourism dynamics. Carneiros Beach, situated within the boundaries of the APAG, is a popular tourist destination year-round, and will hereafter be referred to as the “year-round tourism area”. In contrast, Tamandaré Beach, situated within the APACC, experiences a more seasonal tourism, with fluctuations in demand throughout the year, and will henceforward be treated as the “seasonal tourism area”. In both areas, data collection was conducted during peak (high-demand) and shoulder (intermediate-demand) tourism seasons to capture seasonal variations in human presence and the associated influences of sound pollution. The peak tourism season typically occurs during the summer months (December to March). Additionally, to appraise potential spatial variation related to reef position relative tosound pollution sources, sampling was conducted at reef sites that differed in exposure to tourism-related sound pollution within each area: exposed sites are located in shallow lagoon areas near the shoreline that are putatively more influenced by human activity and can experience higher sound pressure levels. In contrast, sheltered sites were located in the fore-reef zone, where the reef structure could serve as a potential barrier to sounds produced by tourism activities. Previous analyses conducted in the same study area have already indicated reductions in soundscape-related metrics associated with these three variables (Xavier et al., 2026).
Data collection. Data collection occurred between January and February 2022 for samples characterizing the peak season, and in April 2023 for those representing the shoulder season, both of which fell within the dry climate season of the austral summer. Acoustic data were obtained using a Zoom H2N recorder (16-bit stereo, WAV format, 44.1 kHz sampling rate) paired with an Aquarian Audio H2A hydrophone (sensitive from 10 Hz to 100 kHz; -180 dB re; 1 V/μPa). This setup was housed within a “sonobuoy” system (adapted from Borie et al., 2021; see Fig. S1). The sonobuoy structure featured a waterproof PVC box mounted at the top to protect the recorder approximately 0.5 m above the waterline, safeguarding it against accidental immersion. The hydrophone was mounted at the lower end of the unit and submerged to approximately 0.5 m. The midsection of each sonobuoy consisted of a square flotation frame (0.5 m per side) made from PVC tubing, which was kept stable by four anchoring weights (15 kg each) connected via 3-meter-long tensioned ropes. This configuration minimized lateral drift and tilting, ensuring steady, consistent positioning during recordings and reducing the potential for acoustic distortion from movement. Recordings were conducted at each of the four sampling sites in both tourism seasons, with one session per season and site, totaling eight sessions. Each session consisted of continuous sound monitoring for 10 h, from 7:00 to 17:00, totaling 80 recording hours that spanned the entire daily tourism activity period. At the surface, an observer continuously monitored anthropogenic activities capable of generating underwater noise, thereby facilitating the precise attribution of detected sounds to their sources.
To compare fish diversity and distribution patterns across the different sound recording contexts, the fish community was assessed using underwater visual censuses employing the belt transect method simultaneously with the sound recordings. In this approach, divers estimated fish abundance along a 10 x 5 m transect, established with a measuring tape, identifying species and categorizing individual sizes into 2 cm classes. Five censuses were conducted at each acoustic sampling point and were randomly distributed within each sampling site. Temperature and depth were also measured at the sampling sites every half hour during the recording sessions to investigate their potential relationship with ACI. Temperature was recorded with a precision thermometer (0.1°C) and depth with a measuring tape (0.1 cm).
Data and statistical analyses. Recordings were first screened using Audacity software (v. 2.2) to exclude segments potentially affected by noise generated during sonobuoy installation and underwater visual censuses. Segments affected by geophonic events were excluded due to their potential to interfere with the detection of fish sounds. The geophonic sources identified during monitoring were wind, rainfall, and wave action, and their exclusion ensured that subsequent analyses reflected only the biophonic and anthropophonic contributions relevant to the study. After the screening, the remaining recording time was divided into ten-minute intervals, from which two-minute excerpts were extracted for further analysis. To achieve the first objective, sound components associated with sound pollution were manually analyzed using Raven Pro v. 1.6.5 (Bioacoustics Research Program, 2014). Fish sounds were manually analyzed in Raven Pro through visual screening of oscillograms, spectrograms, and power spectra. Fish sound identification was based on their distinctive acoustic properties, such as low-frequency components, tonal or pulsed patterns, rhythmic structures, and often the presence of short-duration harmonics. Each fish sound event was counted individually, with each distinct emission treated as a single unit for analysis. As part of their general description, the identified fish sound types were also categorized according to Desiderà et al. (2019). In parallel, sound pollution sources were identified from contextual field data collected during the recordings, with each sound event attributed to a specific human activity and treated as an individual component. For sources producing multiple, closely spaced emissions (e.g., bathers), sequences were grouped as a single unit when intervals between sounds did not exceed two seconds. This procedure aimed to quantify and classify sound pollution events, focusing on their general acoustic properties.
Unlike sound pollution sources, fish sounds lacked a confirmed visual source, and their identification relied solely on acoustic properties. Thus, to achieve the second objective of this study, an analysis of sound parameters was conducted to assess the reliability of fish sound type classification, ensuring consistent identification across all recordings. Both temporal and frequency parameters of fish sounds were analyzed, which included sound duration (ms), number of pulses, pulse period (ms), peak frequency (kHz), lowest frequency (kHz), and highest frequency (kHz) (based on Borie et al., 2021). The temporal parameters, sound duration, number of pulses, and pulse period, were obtained from oscillograms. Sound duration was measured as the time between the beginning and end of the waveform of each sound; pulse period was calculated as the mean interval between consecutive pulses within the same sound. The number of pulses was determined by manually counting the individual pulse peaks visible in the oscillogram for each sound. Frequency parameters, including peak frequency, lowest frequency, and highest frequency, were extracted from the power spectrum of each sound. Peak frequency refers to the frequency at which the highest energy concentration occurs within the sound signal. The lowest frequency is defined as the point at which the signal amplitude first exceeds the background noise, while the highest frequency marks the point at which the amplitude returns to background levels, delimiting the upper boundary of the signal.
To achieve the third objective, analyses of Root-Mean-Square (RMS) values of Power Spectral Density (PSD), the Acoustic Complexity Index (ACI), and underwater visual census data were conducted. Power Spectral Densities were obtained to visualize the distribution of sound energy across different frequency bands over time, allowing characterization of overall sound energy levels, identification of dominant frequency peaks, and comparisons among recording sites. The PSDs were performed using the PAMGuide tool in MATLAB 2016 (Merchant et al., 2013). A sampling rate of 44.1 kHz with 16-bit stereo was used, employing a Hann window, 2048-point FFT, a frequency resolution of 21.5 Hz, a temporal resolution of 0.5 s, and 50% window overlap (based on Ceraulo et al., 2018). The analyzed frequency range was set from 0.05 to 2.5 kHz. Although most reef fish species typically produce sounds within 0.05–2.0 kHz, the upper limit was extended to 2.5 kHz to allow broader visualization of peak distributions and potential variations in sound energy. A few fish sound types may extend beyond this range; however, restricting the analysis to low frequencies avoids the influence of high-frequency biological components from other taxa, particularly crustaceans, which tend to dominate those frequency bands. Accordingly, interpretations are restricted to low-frequency biophony, where the majority of reef fish sound production occurs (Erbe et al., 2016; Ceraulo et al., 2018). Calibration data for this analysis were based on hydrophone sensitivity (-180 dB), a gain of 39 dB, and an ADC voltage range of 3.535 V, with PSD values expressed in dB re 1 μPa²/Hz⁻¹. The PSD obtained in this study represents RMS values over the analyzed periods, which smooth short-term fluctuations and provide a more stable representation of overall energy distribution across frequency bands.
The Acoustic Complexity Index (ACI) (Pieretti et al., 2011) was applied to evaluate how tourism-related sound pollution factors (tourism season, tourism type, and exposure) relate to variations in acoustic patterns relevant to reef-fish biophony at the sampling sites. The ACI was selected because it measures the temporal variability of signal amplitude within frequency bands (Farina et al., 2011), making it suitable for comparing differences in reef-fish acoustic complexity across the analyzed factors. The index responds differently to continuous and intermittent sound sources: continuous anthropogenic sounds, such as boat engine noise, tend to exhibit low temporal variation and are generally bypassed in ACI calculation, whereas intermittent biological signals show greater temporal modulation and increase index values (Pieretti et al., 2011). In this study, the ACI was employed as a soundscape-level metric to investigate patterns associated with reef-fish biophony, rather than to isolate or quantify sound production of individual species mechanically; therefore, interpretations derived from it remain restricted to low-frequency biophony, where most sound production in reef fish is concentrated. The ACI was obtained using Kaleidoscope Pro v. 4.5.5 software (Wildlife Acoustics, 2019), with a sampling rate of 44.1 kHz, 16-bit stereo audio, an FFT size of 2048 points, and a frequency resolution of 21.5 Hz (continuous temporal step). The analysis spanned the frequency range from 0.05 to 2 kHz, encompassing both fish sounds and sound pollution sources within this frequency range (Au, Hastings, 2008; Erbe et al., 2016). Based on the sampling conducted in the study, of the total 10 h of recordings, two hours were analyzed by calculating ACI in half-hour segments. Six min of audio were selected within each of the 30 min segments, specifically the first two-minute excerpt from each 10 min interval. These six min selections were then subdivided into 36 sec audio windows, yielding 200 audio segments across the entire recording period at each sampling site and each tourism season. This approach enabled a more detailed analysis while maintaining temporal resolution over a prolonged recording duration.
Regarding the data from underwater visual censuses, the observed fish community was classified distinguishing between soniferous and non-soniferous species. For fish species without direct records or confirmed evidence of sound production, we used information from closely related taxa, such as species within the same genus or family documented in the literature as capable of producing sounds (based on Dobrin, 1947; Fish, Mowbray, 1970; Green, 1971; Tavolga et al., 2012; Tricas, Boyle, 2014; Buscaino et al., 2025; Dantzker et al., 2025). This classification was applied to estimate richness and diversity of species attributed as soniferous, which were based on true diversity measures (respectively based on 0Dα and 1Dα from Jost, 2006).
To evaluate whether water temperature and depth were correlated with ACI values, linear regression analyses were performed. As models adjusted for both metrics indicated no significant correlation (p < 0.05), abiotic factors were disregarded in the following analyses. The temperature and depth data are presented in the supplementary material (Tab. S2).
To compare individual sound parameters among the different fish sound types, a Kruskal-Wallis test was applied using the ‘kruskal.test’ function, followed by Dunn’s post hoc test implemented with the ‘dunnTest’ function from the FSA package (Ogle et al., 2025), as the data did not conform to normality assumptions based on Q-Q plots and the Shapiro-Wilk test, and log-transformation of raw data did not yield normal distributions. Sounds with single pulses were excluded from the analysis of ‘number of pulses’ and ‘pulse period’, as these parameters are inapplicable to single-pulse sounds. To visualize patterns of similarity and separation among fish sound types, a non-metric multidimensional scaling (NMDS) analysis was performed using the ‘metaMDS’ function from the vegan package (Oksanen et al., 2025). Differences among groups were then tested with a PERMANOVA using the ‘adonis2’ function (vegan package), followed by pairwise comparisons using the ‘pairwise.adonis2’ function from the pairwiseAdonis package (Martinez, 2020), based on the four parameters shared by all fish sound types: sound duration, peak frequency, lowest frequency, and highest frequency. Since ACI values conformed to a normal distribution, we applied a nested ANOVA using the aov function from the stats package. This analysis was required because the predictors were not orthogonal: ‘Tourism type’ (seasonal or year-round) was nested within ‘Tourism season’ (peak or shoulder), and ‘Exposure’ (exposed or sheltered) was nested within ‘Tourism type’. In the context of the ‘Exposure’ categories (exposed and sheltered), both an NMDS analysis and statistical comparisons of the sound parameters were conducted. The NMDS was performed to explore overall differences between the categories, and Mann-Whitney U tests using the ‘wilcox.test’ function from the stats package were used to investigate potential differences in sound parameter values. Reef fish richness and diversity were estimated from underwater visual census data using the true diversity expressed as Hill numbers (qD) (Hill, 1973). Diversity of order 0 was used to estimate species richness, disregarding species abundance, while q = 1 values were used to assess diversity, equivalent to Shannon entropy and based on the occurrence of common fish species, using the entropart package (Marcon, Hérault, 2015). Linear regressions were performed using the ‘lm’ function from the stats package. All statistical analyses were performed in R v. 4.1.3 (R Development Core Team, 2022).
Results
Sound sources and fish sound differentiation. Nine types of fish sounds were identified within the analyzed sampling sites (Fig. 2). Fish sounds were classified as pulse series (sounds 1, 4, 6, 8, and 9), fast pulse trains (sound 5), single pulses (sounds 3 and 7), and short sequences of 2–3 pulses (sound 2), with all nine sound types exhibiting durations of less than 1 second. Sound 1 exhibited the broadest bandwidth, ranging from 0.2 to 3.8 kHz. In contrast, sound 4 showed the narrowest bandwidth, ranging from 0.0–0.4 kHz. Sounds 2 and 3 also spanned a wide frequency range (0.1–2.4 kHz and 0.1–2.1 kHz, respectively), though narrower than sound 1. These were followed by sounds 5 (0.9–2.0 kHz), 6 (0.1–1.9 kHz), and 7 (0.2–2.0 kHz), which had intermediate ranges. Sounds 8 and 9 had narrower ranges, between 0.2–1.5 kHz and 0.2–0.9 kHz, respectively. Regarding the analyzed fish sound parameters, significant differences were detected across all variables according to the Kruskal–Wallis test (p < 0.001). Means, standard deviations and significance levels for the pairwise comparisons are provided in Tab. S3. In general, sound duration was longest in sound 4 (62.1 ± 18.5 ms) and shortest in sound 7 (8.0 ± 0.6 ms). The number of pulses was highest in sound 5 (25.3 ± 3.1) and lowest in sound 2 (2.5 ± 0.5). Pulse period was longest in sound 4 (6.2 ± 0.3 ms) and shortest in sound 5 (0.7 ± 0.1 ms). Peak frequency was highest in sound 5 (1.5 ± 0.2 kHz) and lowest in sound 4 (0.2 ± 0.0 kHz). The lowest frequency was highest in sound 5 (0.9 ± 0.1 kHz), while most other types remained close to 0.1 ± 0.0 kHz. The highest frequency was greatest in sound 1 (3.8 ± 0.3 kHz) and lowest in sound 4 (0.4 ± 0.0 kHz) (Fig. 3; Tab. S4).

FIGURE 2| A summary of the five tourism-related sound pollution sources recorded in the studied reef environments: jet skis, speedboats, powered paragliding, recreational activities by beachgoers, and fishing boats. The number of occurrences is shown separately for exposed and sheltered sites. Frequency bands of each sound pollution source are shown in blue, representing their overall frequency ranges, whereas reef fish sounds are shown in green, representing the frequency bands around the dominant frequencies reported for reef fishes.
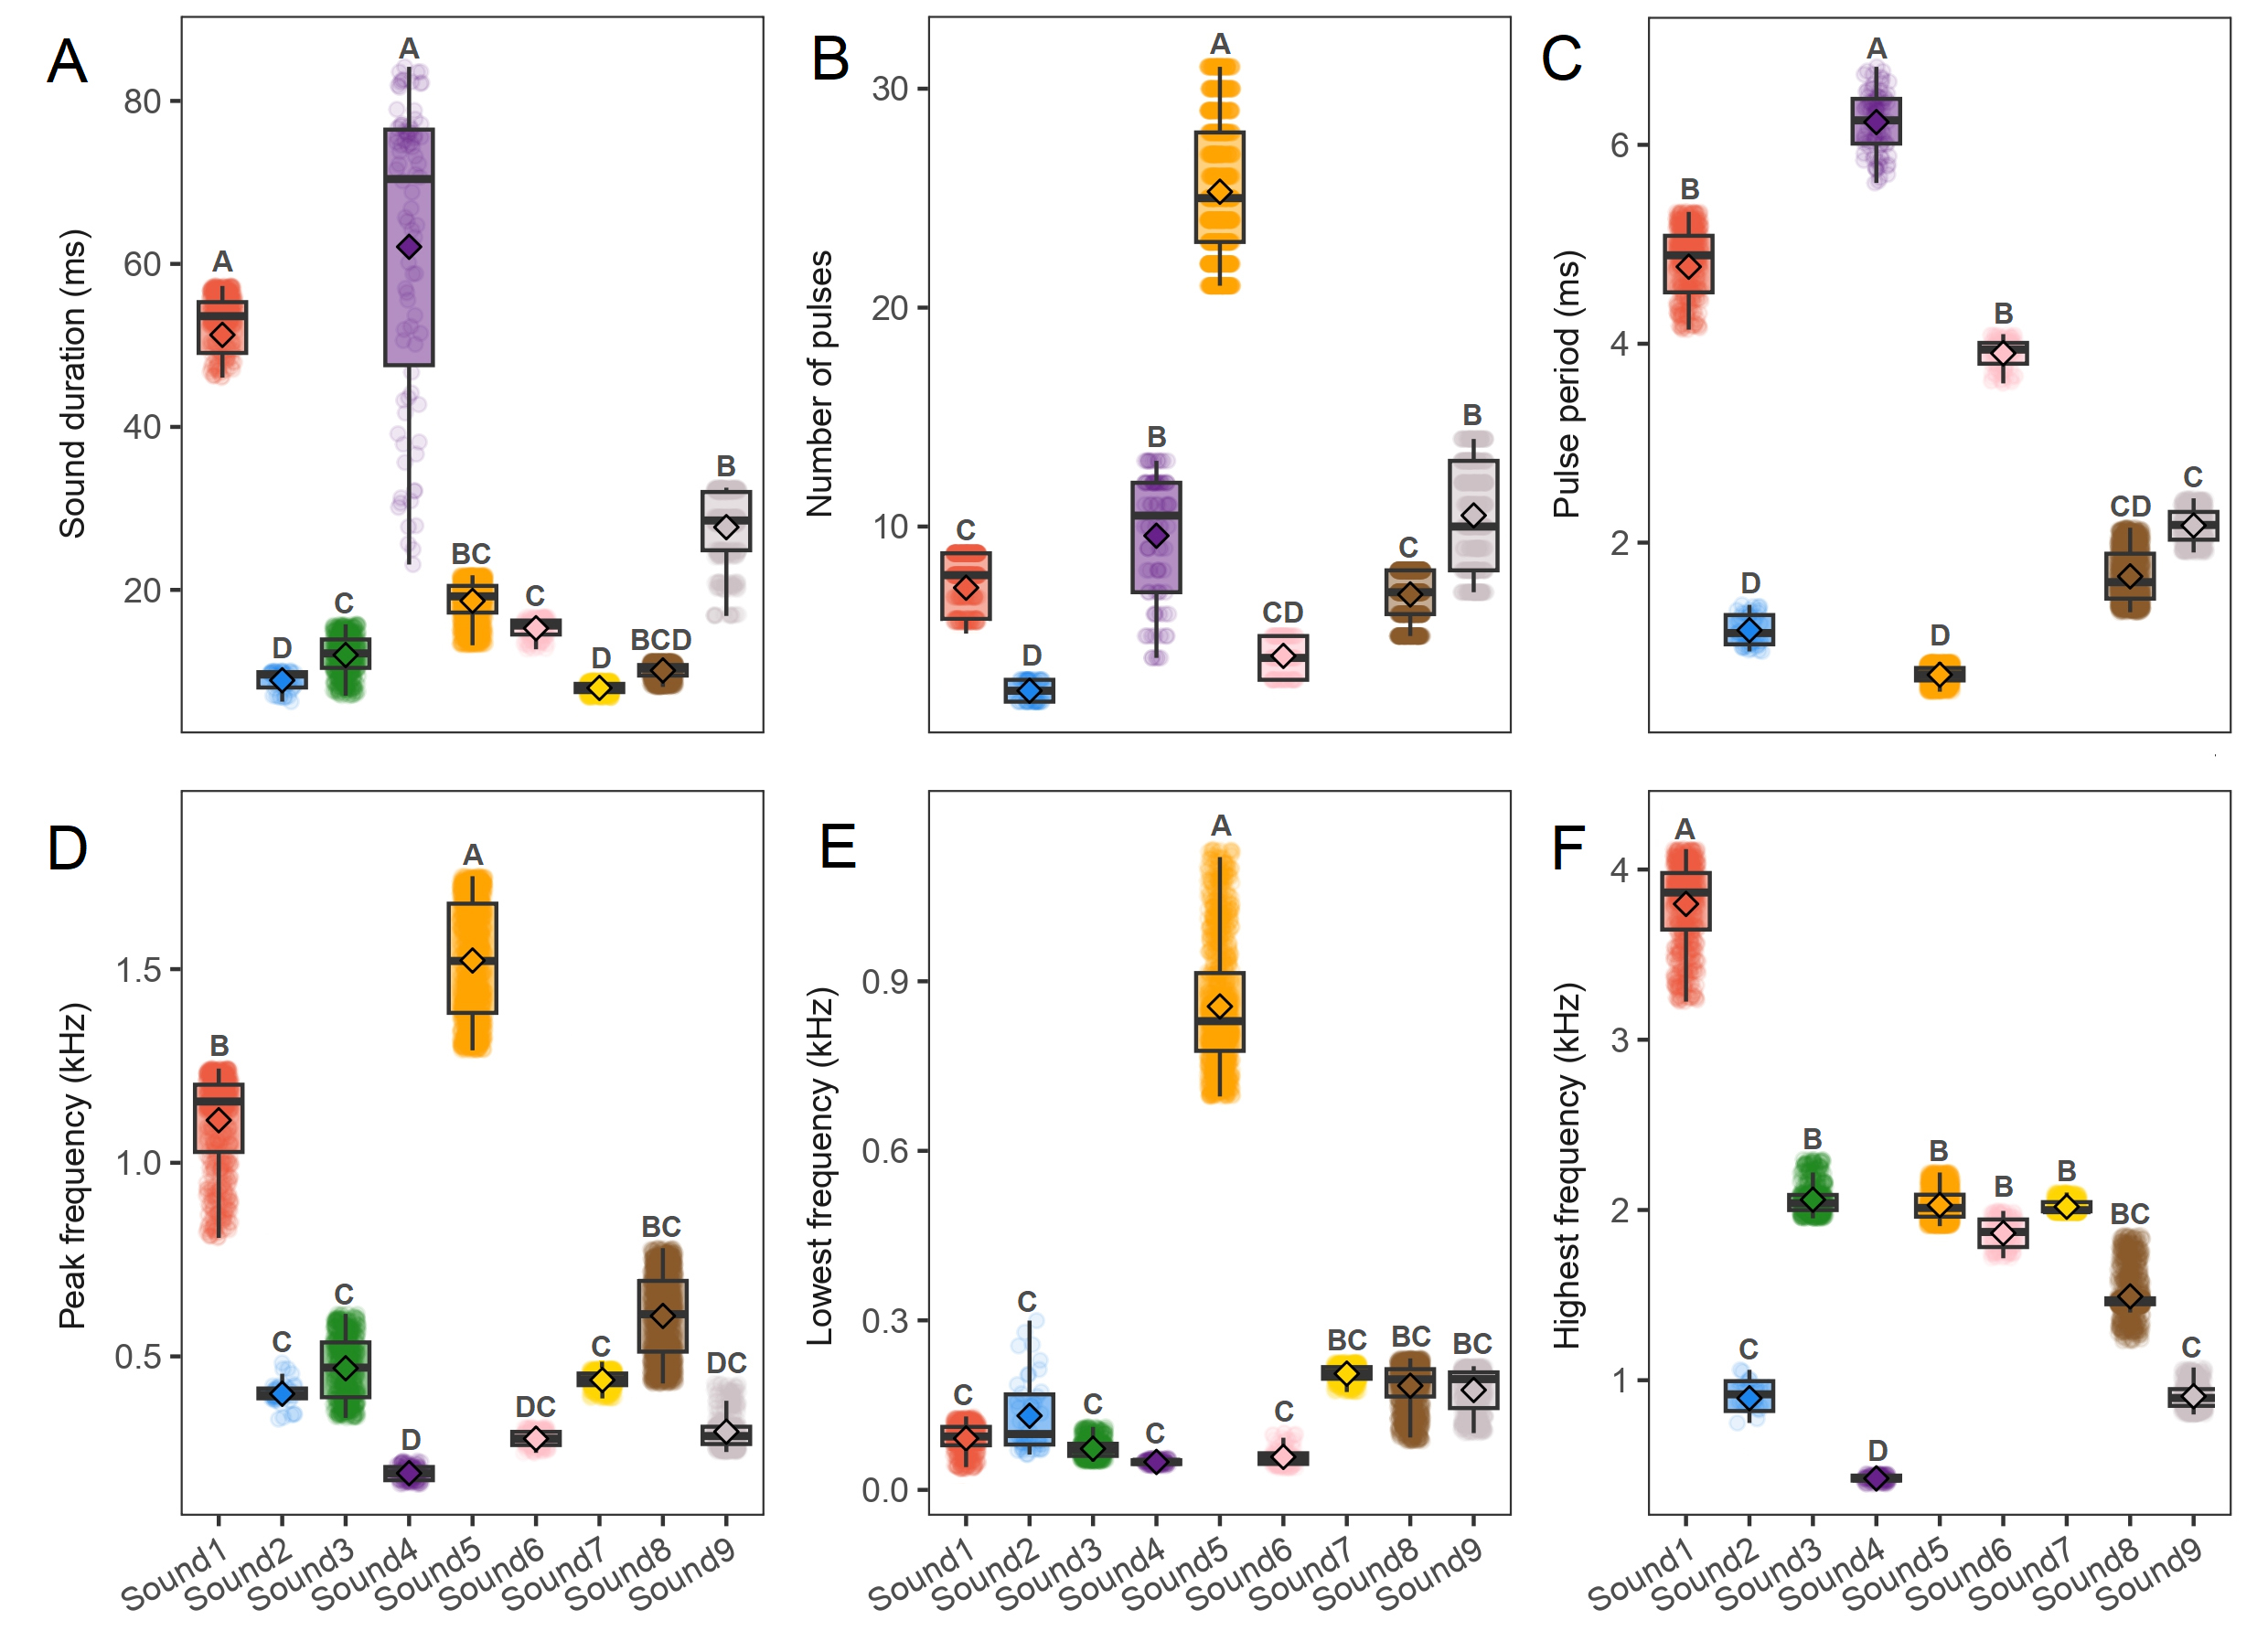
FIGURE 3| Oscillograms and spectrograms of fish sounds. A. Sound 1; B. Sound 2; C. Sound 3; D. Sound 4; E. Sound 5; F. Sound 6; G. Sound 7; H. Sound 8; I. Sound 9. For each sound type, an oscillogram with a series of sounds emitted is shown, from which a selected portion (indicated by a rectangle) is magnified to highlight the time structure of the signal.
Five tourism-related sound pollution sources were identified in the analyzed sampling sites: jet skis, speedboats, powered paragliding, recreational activities by beachgoers, and fishing boats. All of these sources produced sounds with frequency ranges that overlapped the dominant frequency components of fish sounds, which typically occurred between 0.05 and 2 kHz. Jet skis and speedboats extended to the highest frequency bands, reaching from 0.05 up to 8 kHz and 5 kHz, respectively. Powered paragliding, recreational activities by beachgoers, and fishing boats, with frequencies extending up to 4 kHz (Fig. 4).
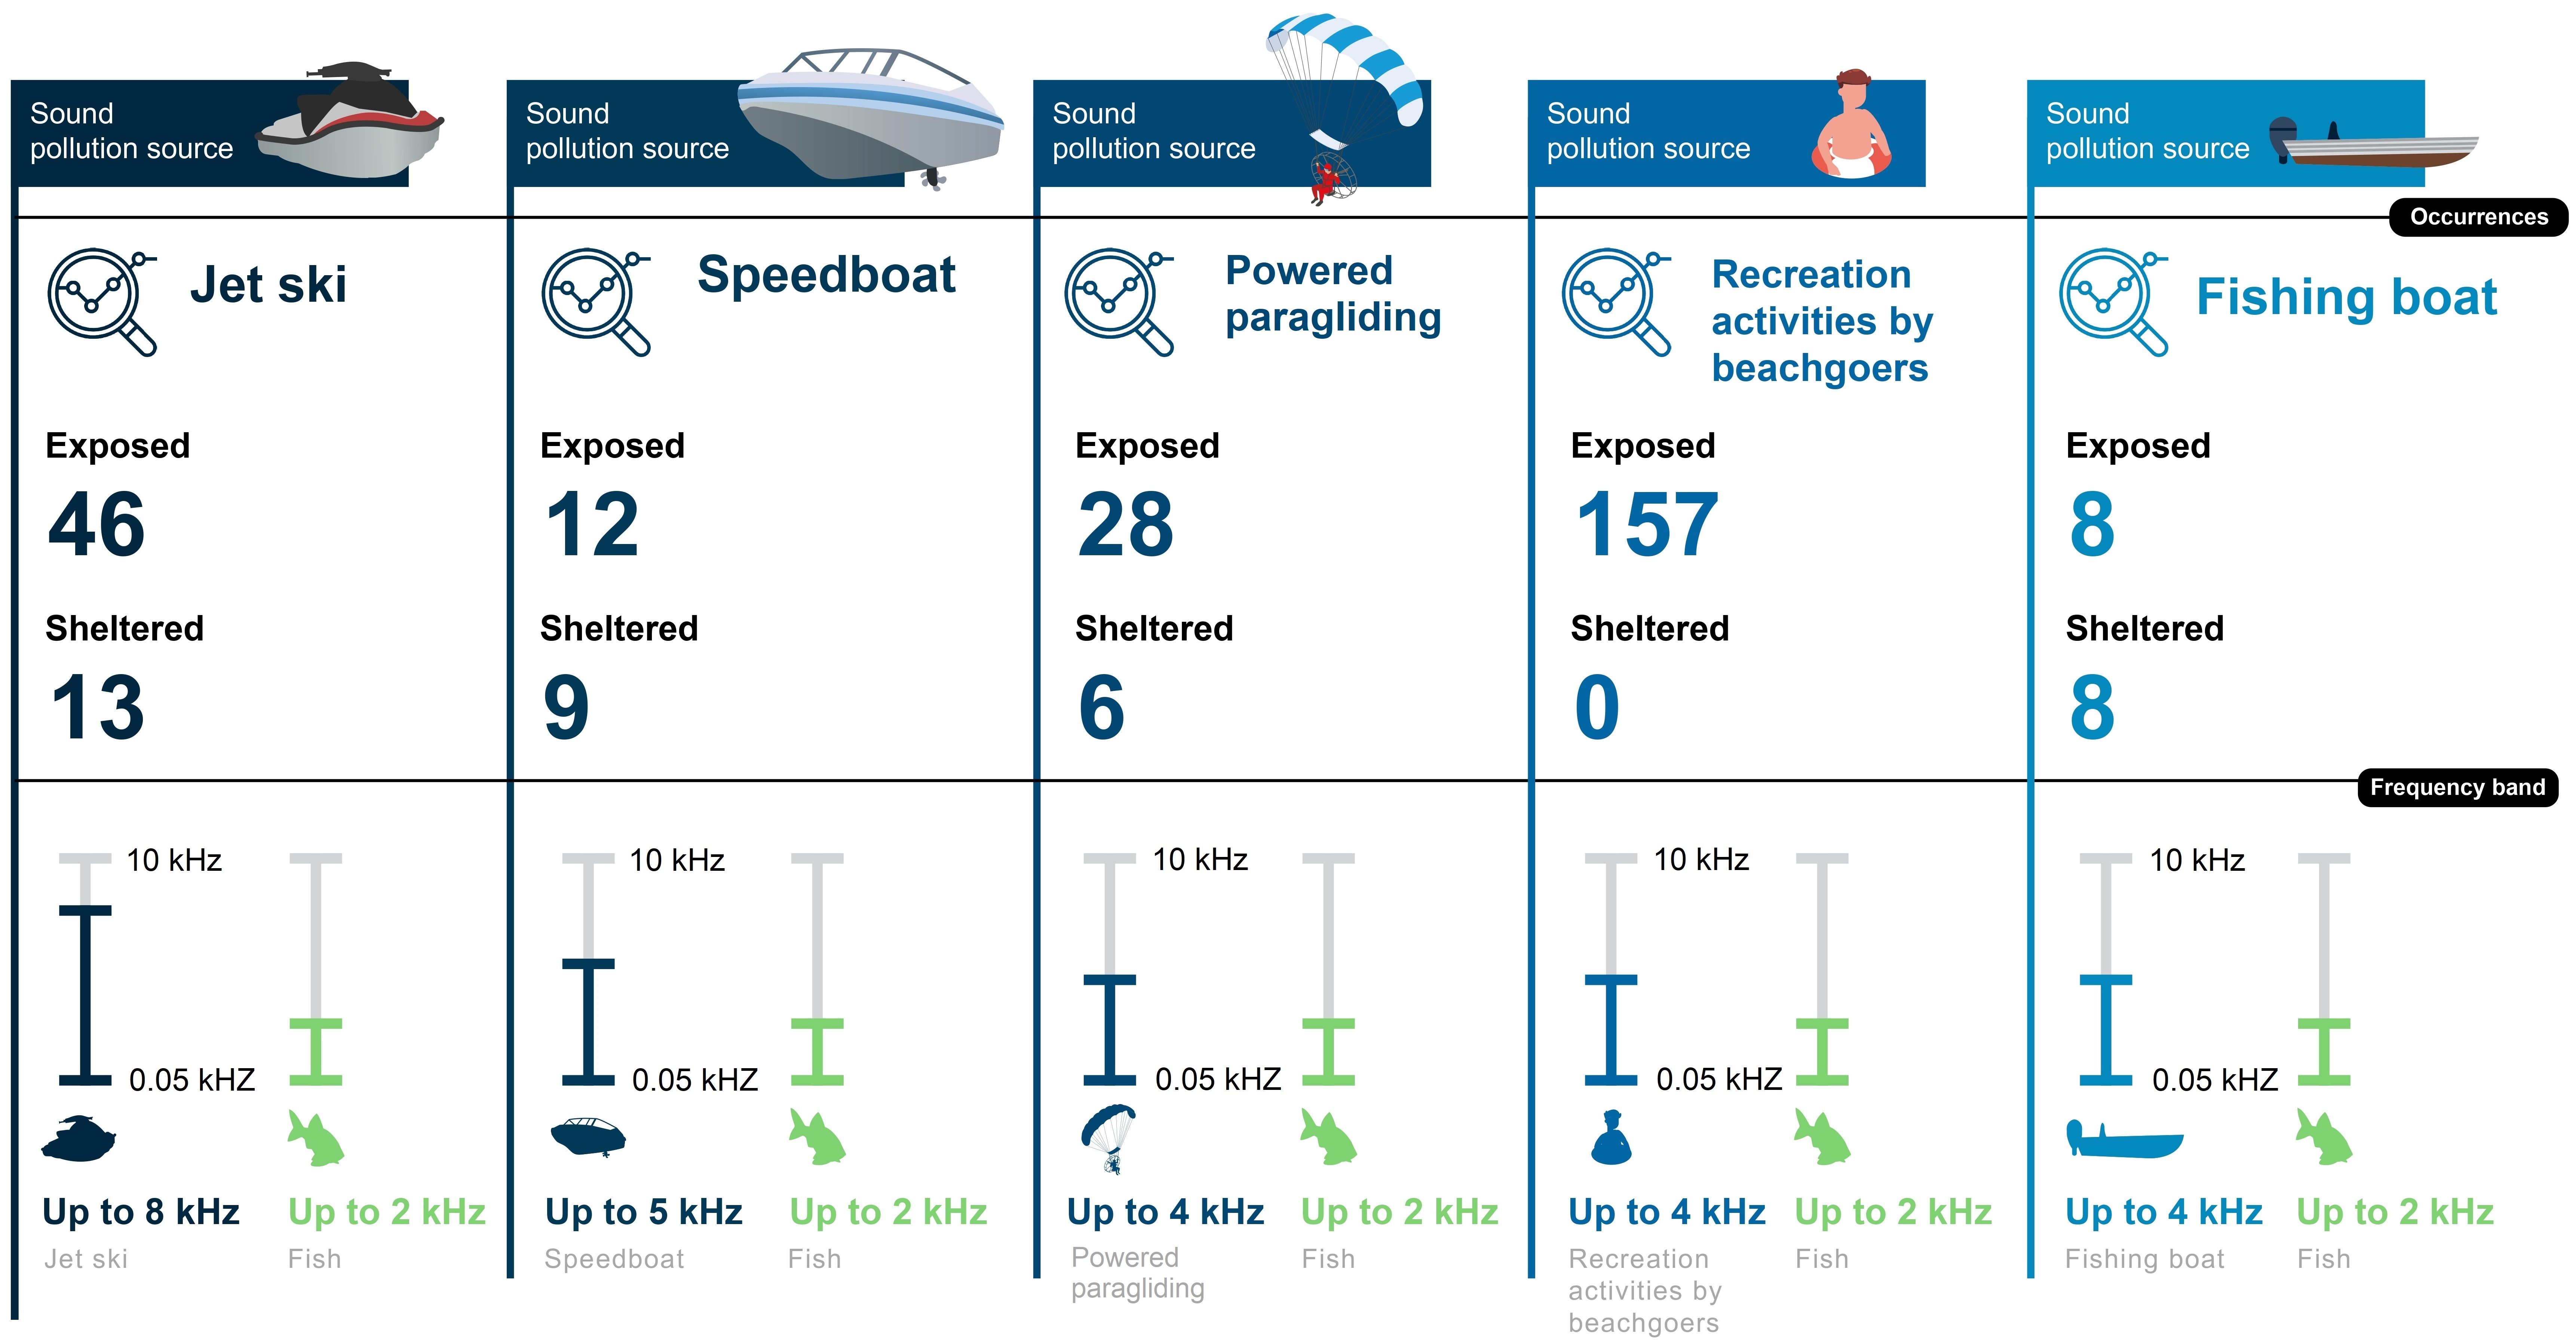
FIGURE 4| Distribution of sound parameters measured across nine distinct fish sound types. Boxplots represent the median (line), interquartile range (box), and range excluding outliers (whiskers), with individual data points overlaid and mean values indicated by diamonds. Parameters shown are: (A) sound duration (ms), (B) number of pulses, (C) pulse period (ms), (D) peak frequency (kHz), (E) lowest frequency (kHz), and (F) highest frequency (kHz). Superscript letters indicate statistically significant differences among sound types for each parameter. For sound types 3 and 7, which consist of a single pulse, the parameters “number of pulses” and “pulse period” are not measurable.
Overall, sites that had higher numbers of fish sounds had fewer instances of sound pollution records. This was more evident in the sheltered sites, where fish sounds were the most frequent, whereas exposed sites showed greater occurrence of sound pollution sources (Fig. 4; Tab. 1). Among the identified fish sound types, sound 8 was the most frequently recorded, with a total of 560 occurrences, whereas sound 2 was the least frequent, with 42 occurrences. Regarding sound pollution sources, recreational activities by beachgoers were the most common, with 157 occurrences in exposed sites, while fishing boats were the least frequent, with 16 occurrences across exposed and sheltered sites.
TABLE 1 | Classification of fish sound types and their occurrences at exposed and sheltered sites, considering year-round and seasonal tourism areas during peak and shoulder seasons.
Sound types | Peak | Shoulder | ||||||
Year-round | Seasonal | Year-round | Seasonal | |||||
Exposed | Sheltered | Exposed | Sheltered | Exposed | Sheltered | Exposed | Sheltered | |
Sound 1 | 108 | 16 | 63 |
| 59 |
|
| 55 |
Sound 2 |
| 15 |
| 11 | 4 | 8 |
| 4 |
Sound 3 |
| 113 |
| 40 |
| 200 |
| 96 |
Sound 4 |
| 44 |
| 17 |
| 14 |
| 11 |
Sound 5 |
| 85 | 14 | 61 | 24 | 83 | 79 | 170 |
Sound 6 |
|
|
| 36 |
| 26 |
| 69 |
Sound 7 |
| 75 |
| 54 |
| 29 | 42 | 119 |
Sound 8 |
| 107 | 7 | 84 | 12 | 142 | 93 | 117 |
Sound 9 |
| 58 |
| 37 |
| 45 | 44 | 57 |
The NMDS of sound parameters showed a clear separation of the nine sound types, suggesting individualization among these sounds according to their sound parameters (Fig. 5). These patterns were corroborated by the PERMANOVA results (main test R² = 0.899, Pseudo-F = 4819.36, and p = 0.001), which showed on pairwise comparisons that all sound types differed significantly from one another (Tab. S5).
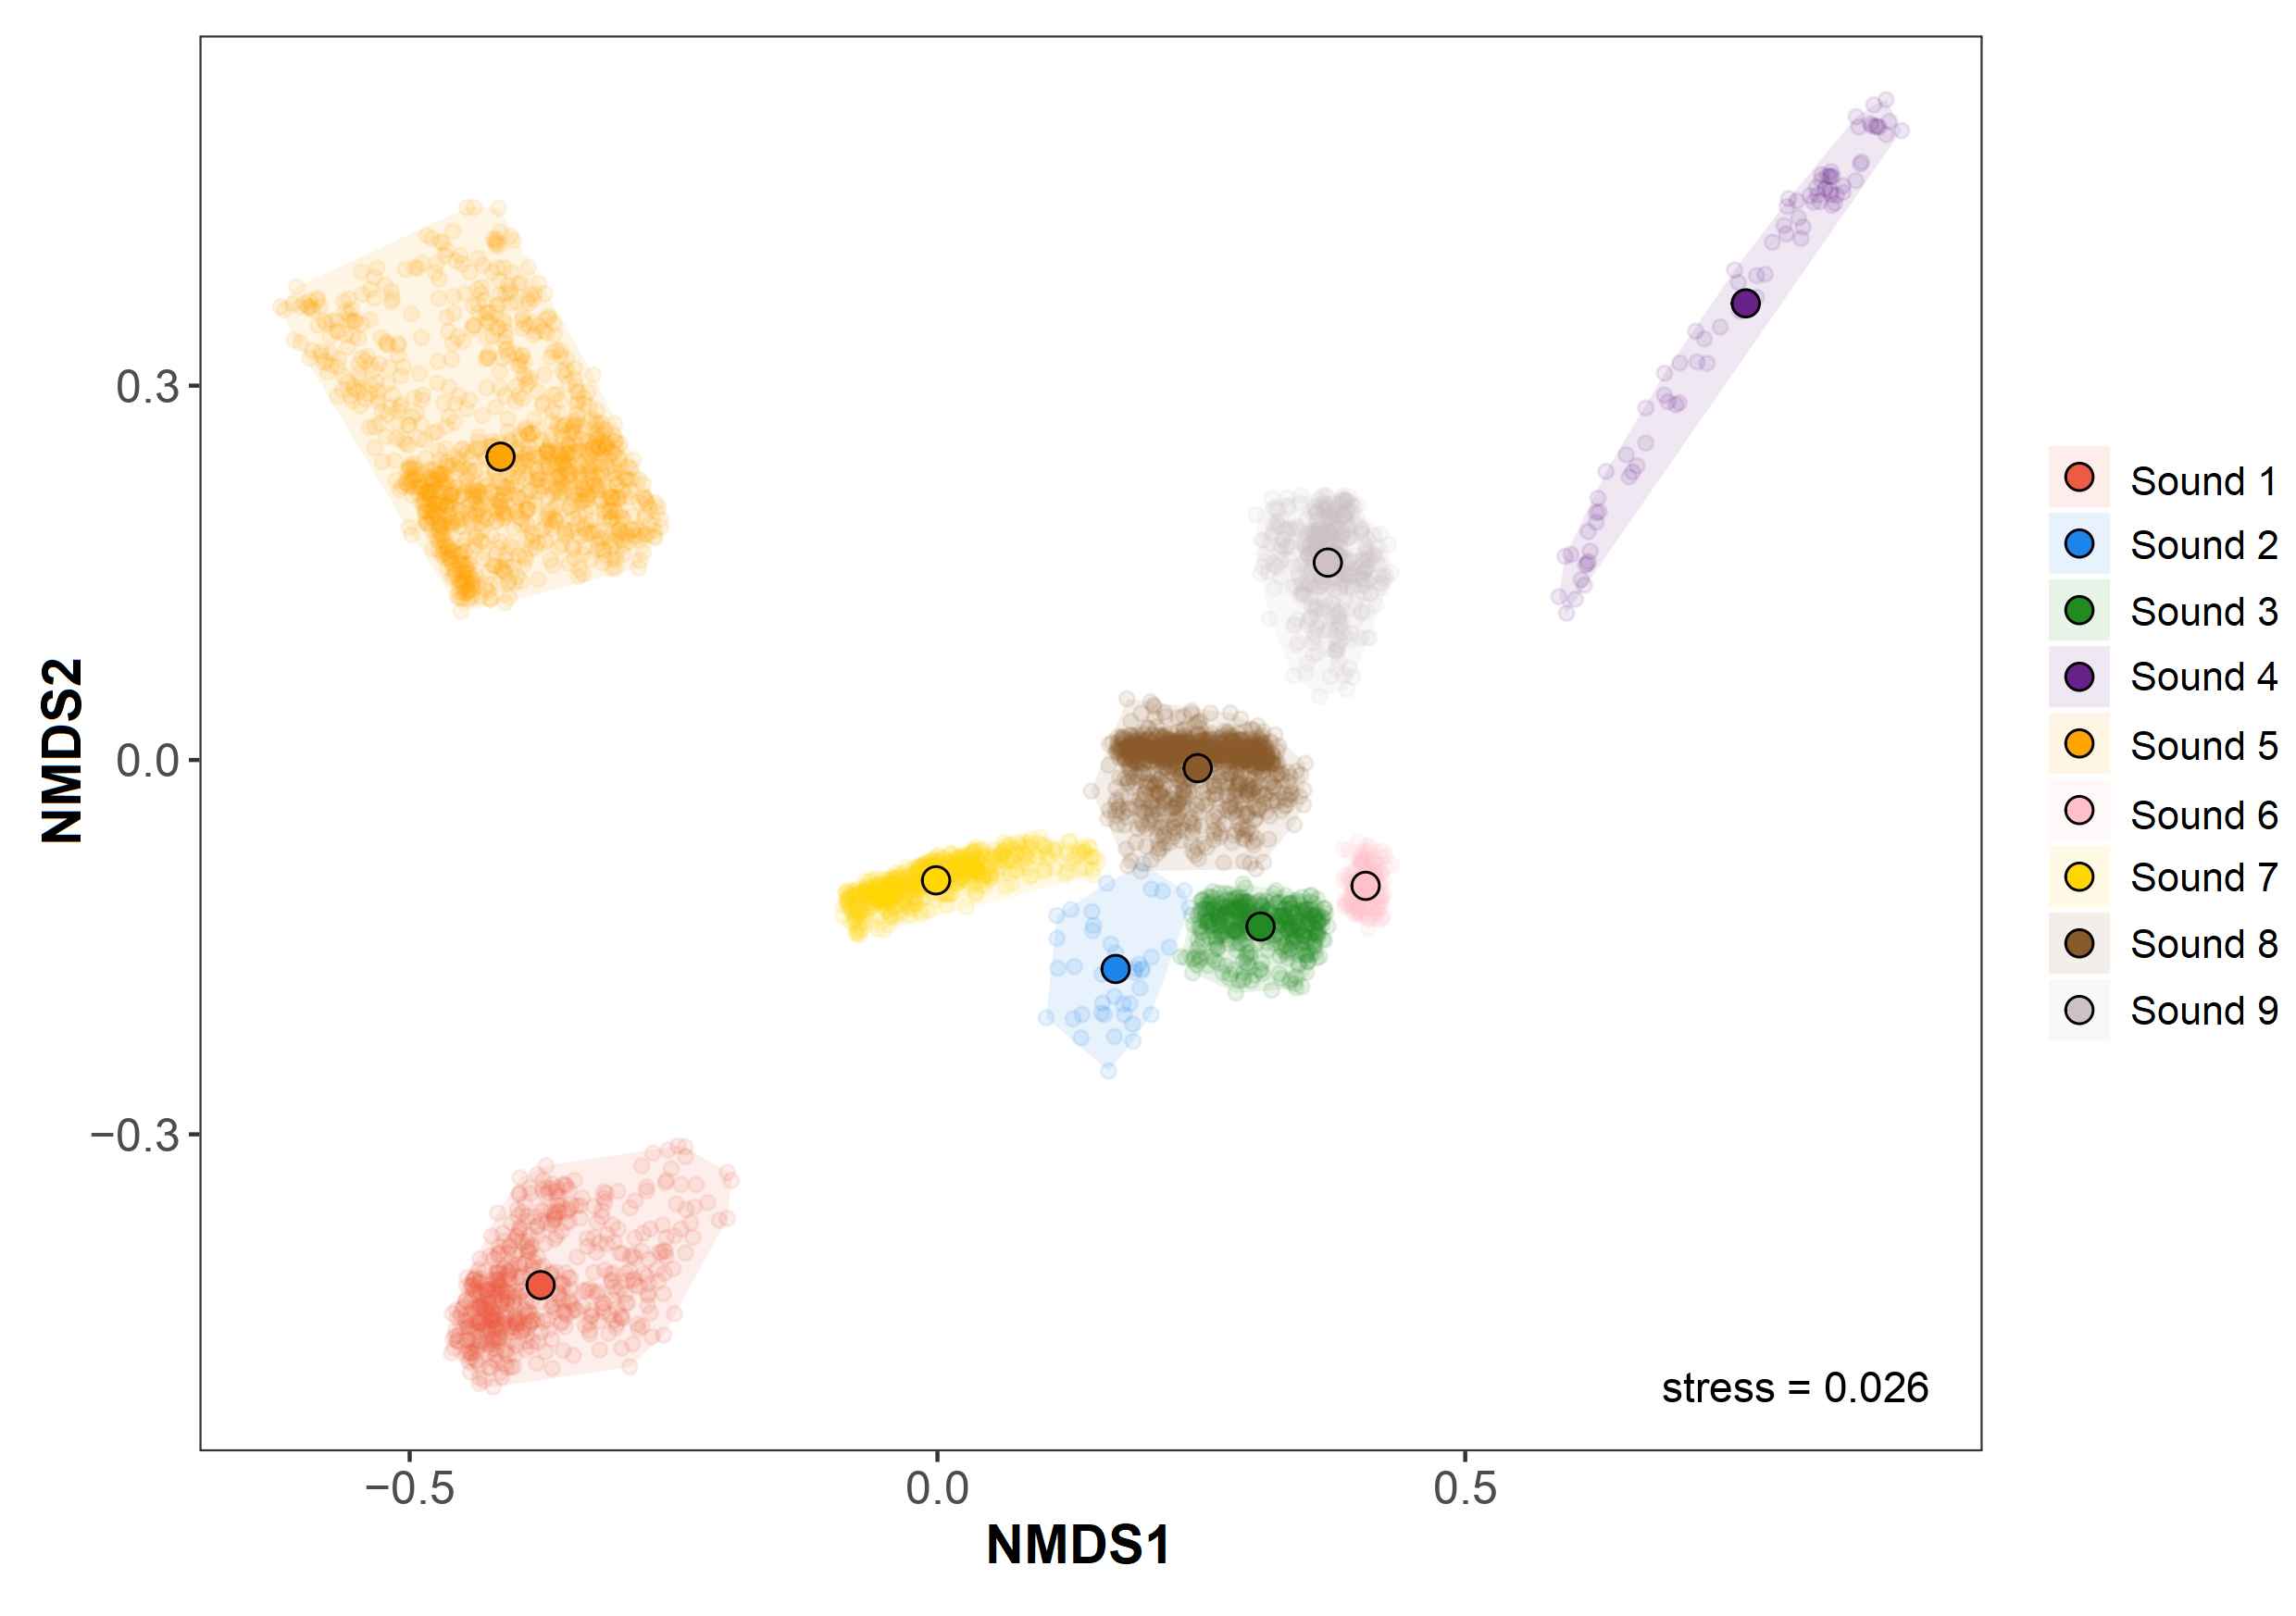
FIGURE 5| Non-metric multidimensional scaling ordination based on sound parameters of the nine identified fish sound types. Small colored dots represent individual sounds, grouped within polygons that outline the multivariate space occupied by each sound type. Large black-edged circles indicate the centroids of each group.
Reef fish acoustic responses to tourism noise. Across the sampled sites, two main sound energy peaks were observed in the RMS PSD analyses, between 0.4–0.5 kHz and 1.6–2 kHz, both associated with fish sounds (Fig. 6). These sound energy peaks were more prominent during the shoulder tourism season, particularly at sheltered sites in both the year-round and seasonal tourism areas. In contrast, the exposed site in the seasonal area showed lower energy levels with some fluctuations at lower frequencies. During the peak tourism season, both energy peaks occurred only at the sheltered site in the seasonal area, while the other sites showed only the higher-frequency energy peak. In this context, the RMS-PSD values showed flatter spectral shapes and higher energy levels at 0.05–0.3 kHz., suggesting the influence of sound pollution. At the exposed site in the year-round area, PSD started at ~110 dB re 1 µPa²/kHz⁻¹ and decreased to ~100 dB (0.05–0.3 kHz), lacking the lower-frequency peak but showing a mild rise to 95 dB at higher frequencies. Conversely, at the sheltered site during the shoulder season, values began at ~75 dB, with two well-defined peaks at 95 and 100 dB, consistent with fish sound activity.

FIGURE 6| Power spectral density (root-mean-square values) denoting the spectral distribution of sound energy across different frequencies at the analyzed sites, in peak and shoulder tourism seasons. P1 and P2 represent the most prominent frequency peaks identified in the recordings.
The nested ANOVA results indicated that exposure was the only factor with a statistically significant effect on the ACI within the 0.05–2 kHz frequency range (F = 804.33, p < 0.001). In contrast, tourism season and tourism type did not significantly influence ACI values (Tab. 2). Overall, ACI values were consistently lower in exposed sites and during the peak season, particularly in year-round tourism area, with the lowest mean recorded at exposed sites within year-round tourism area during the peak season and the highest at sheltered sites within seasonal tourism area during the shoulder season (Tab. 3).
TABLE 2 | Results of the nested ANOVA assessing the effects of tourism season, tourism type (nested within tourism season), and exposure (nested within tourism type) on the Acoustic Complexity Index within the 0.05–2 kHz frequency range. Reported values include degrees of freedom (Df), sum of squares, mean squares, F statistics, and significance levels (p ≤ 0.05).
Factor | Df | Sum Sq | Mean Sq | F value | p-value |
Tourism season | 1 | 551116.52 | 551116.52 | 6.64 | 0.12 |
Tourism type (within tourism season) | 2 | 165881.96 | 82940.98 | 0.37 | 0.71 |
Exposure (within tourism type) | 4 | 906564.89 | 226641.22 | 804.33 | < 0.001 |
Residual | 1592 | 448585.73 | 281.77 |
|
|
TABLE 3 | Mean, standard deviation, minimum, and maximum values of the Acoustic Complexity Index within the 0.05–2 kHz frequency range, obtained from each sampling site during peak and shoulder tourism seasons.
Tourism seasons | Tourism type | Exposure | ACI values (0.05–2 kHz) | |
Mean ± Standard deviation | Minimum – maximum | |||
Peak | Year-round | Exposed | 104.2 ± 4.4 | 96–117.3 |
Sheltered | 152.3 ± 11.2 | 164.2–182.8 | ||
Seasonal | Exposed | 122.9 ± 13.3 | 105.1–182.6 | |
Sheltered | 161.5 ± 10.1 | 115.3–217.5 | ||
Shoulder | Year-round | Exposed | 128.6 ± 3.6 | 120.7–138.5 |
Sheltered | 190.9 ± 31.3 | 131–250 | ||
Seasonal | Exposed | 161.5 ± 28.3 | 133.2–188.6 | |
Sheltered | 203.4 ± 5.4 | 173.2–217.7 | ||
When evaluating the potential effects of exposure on the sound parameters of fish sounds, no statistically significant differences were found between sheltered and exposed sites (Mann-Whitney U test, p > 0.05 for all sound parameters; Tab. S6). However, differences were observed in the composition and occurrence of fish sound types between these two exposure categories. Considering that exposure was the only factor influencing ACI values, the NMDS analyses also revealed differences in the composition of fish sounds between levels of this factor (Fig. 7). All nine sound types occurred in sheltered sites, whereas sounds 3, 4, and 6 were absent in exposed sites. Sound 3 is characterized by a single short-duration pulse, with a low peak frequency and a broad frequency bandwidth. Sound 4 consists of a long pulse series, with a high number of pulses and a narrow frequency bandwidth restricted to low frequencies. Sound 6 corresponds to a short pulse series, with few pulses and a broad frequency bandwidth. Among these, sounds 4 (86 occurrences) and 6 (131 occurrences) were among the rarest in the dataset, whereas a similar pattern was not observed for sound 3, which was relatively frequent (449 occurrences). A decline in the occurrence of other sound types was also observed at exposed sites. However, sound 1 had the highest number of occurrences in these exposed sites. This sound corresponds to a long-duration pulse series, with an intermediate number of pulses and the broadest frequency bandwidth among the recorded sounds. In the total dataset, sound 1 was among the most frequent sound types, with 301 occurrences.
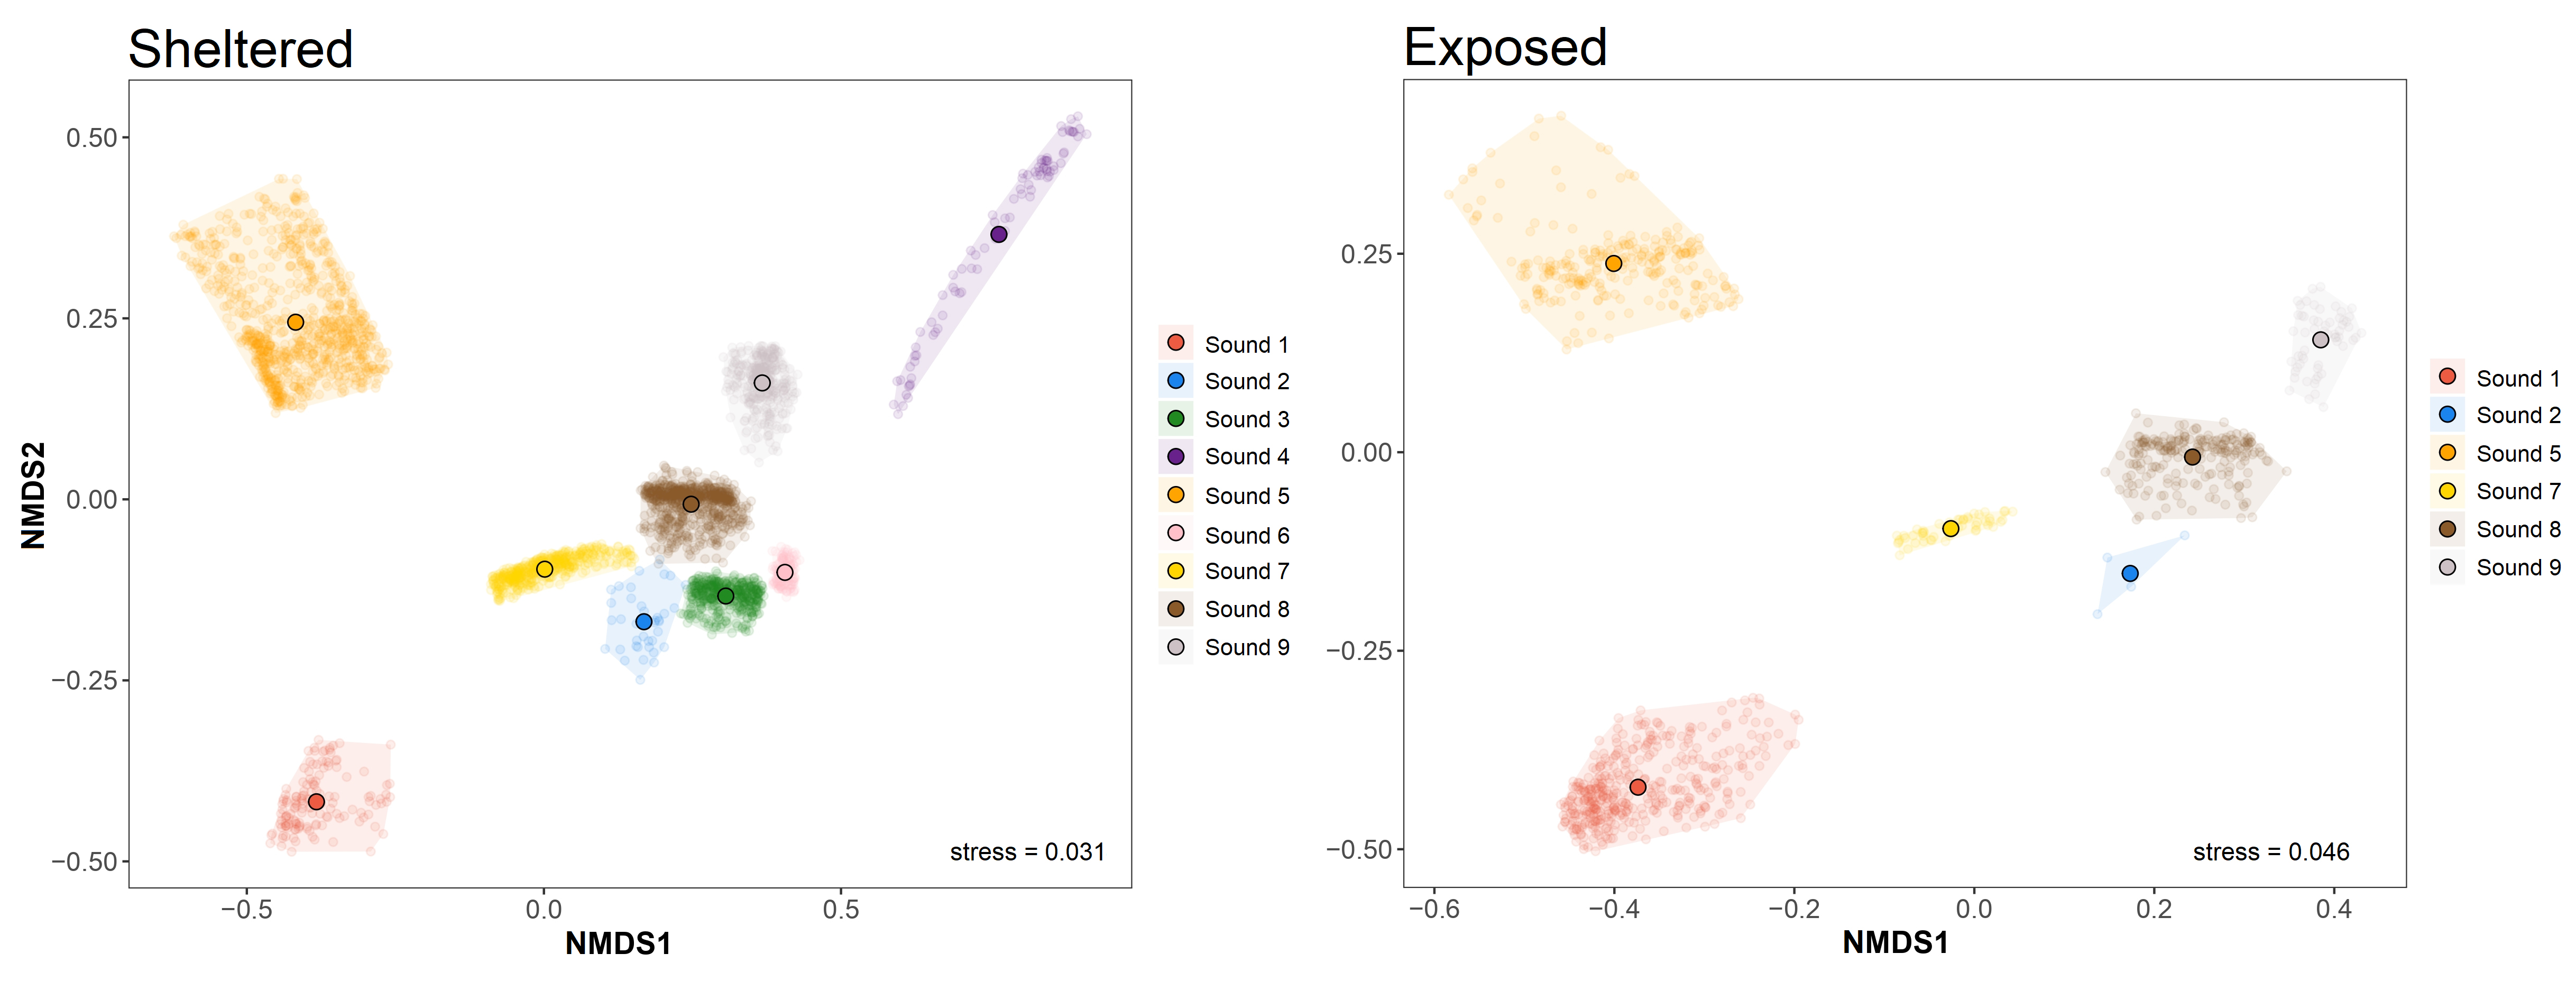
FIGURE 7| Non-metric multidimensional scaling (NMDS) ordinations of the nine identified fish sound types at sheltered and exposed sites. Small colored dots represent individual sounds, grouped within polygons that outline the multivariate space occupied by each sound type. Large black-edged circles indicate the centroids of each group. Stress values were 0.031 for sheltered sites and 0.046 for exposed sites.
Underwater visual censuses revealed similar patterns between total and soniferous fish assemblages, as most observed species were soniferous. The total species richness across sites ranged from 18 to 23, while the number of soniferous species ranged from 17 to 21 (Tab. S7). A spatial divergence in soniferous fishes total richness and abundance was observed, with the highest number of species (21) and individuals (1,368) being registered at the exposed site of the year-round tourism area. Richness (⁰Dα) of soniferous fishes was also higher in the year-round tourism area, at the exposed site (13 ± 2.7). In contrast, diversity (¹Dα) varied little across sites, ranging from 5.0 ± 3.2 to 6.4 ± 1. A descriptive comparison with ACI values shows patterns that did not correspond with the distribution of soniferous fish among sites; despite presenting the highest richness of soniferous species, the year-round tourism area at the exposed site showed the lowest mean ACI values in both peak and shoulder seasons. Oppositely, the seasonal tourism area at the sheltered site showed the highest ACI values in both seasons while having intermediate richness of soniferous species (Fig. 8).
FIGURE 8| Boxplots of the Acoustic Complexity Index (ACI) at each sampling site during peak and shoulder tourism seasons. Boxplots show the median (line), interquartile range (box), whiskers excluding outliers, and individual data points; diamonds indicate mean values. Species richness (⁰D) and true diversity (¹D) of soniferous fishes obtained from underwater visual censuses are also shown as mean ± SD.
Discussion
Our results revealed nine distinct fish sound types in coastal reefs of northeastern Brazil, and tourism-related sound pollution showed indications of overlap with the frequency bands in which these sounds occur, suggesting potential interference with their detectability and with soundscape-level patterns of biophony. Fish sounds generally have dominant frequencies between 0.05 and 2 kHz (Carriço et al., 2019; McCordic et al., 2021; this study), and tourism-related sound pollution occurs within similar frequency bands, which may influence their detectability or expression within the soundscape. Behaviorally, fish produce sounds in various contexts, including territorial defense, courtship, mating, feeding, predation, and predator detection (Bertucci et al., 2014; Van Oosterom et al., 2016; Ladich, 2019; Amorim, 2023; Banse et al., 2024a; Azofeifa-Solano et al., 2025), and their suppression may result in alterations in these behaviors, potentially affecting their population dynamics (Fonseca, Amorim, 2019; Popper, Hawkins, 2019). Our results also showed that, although areas under greater influence of tourism-related sound pollution supported a high diversity of soniferous reef fishes, the frequency of their acoustic records was reduced, and some sound types were not detected in the soundscape, suggesting reduced detectability under noisier conditions. Fish sounds that were still recorded in these more impacted environments did not show changes in the characteristics of their sound parameters; still, their occurrence was substantially reduced. Future studies quantifying signal-to-noise ratios, noise levels within relevant frequency bands, detectability thresholds, and sound presence under controlled noise conditions would help elucidate the mechanisms driving reduced biophony in noisy environments.
Among the nine distinct types of fish sounds, sound 1 exhibited similarities with the grunts produced by the family Haemulidae (3 to 9 pulses, duration between 28 and 100 ms, peak frequency between 0.2 and 1.9 kHz; Xavier et al., 2024). Sound 2 was consistent with the pop sounds emitted by the family Pempheridae (1 to 7 pulses, duration between 7 and 9 ms, peak frequency of approximately 405 Hz; Radford et al., 2015). Sounds 3 and 8 had characteristics that corresponded with two sound patterns of the family Pomacentridae: single-pulse pops (duration < 50 ms, peak frequency near 0.5 kHz) associated with agonistic and territorial defense behaviors (sound 3), or multi-pulse chirps (sound 8), with duration ranging from less than 50 ms to over 100 ms, and peak frequency below 1 kHz, which is produced during courtship and territory maintenance (Fish, Mowbray, 1970; Santiago, Castro, 1997; Maruska et al., 2007; Parmentier et al., 2016). Sound 4 exhibited characteristics typical of grunts from the family Batrachoididae, presenting 8 to 15 pulses, a duration of 50 to 150 ms, and a peak frequency of 0.1 to 0.2 kHz (Bohnenstiehl, 2023). Sounds 7 and 9 showed attributes similar to two sound types produced by the family Holocentridae: single-pulse knocks (duration between 7 and 12 ms, peak frequency 340 to 410 Hz; sound 7), or multi-pulse grunts (3 to 9 pulses, duration between 17 and 60 ms, peak frequency 271 to 342 Hz; sound 9), both associated with conspecific chasing (Banse et al., 2024b). Sounds 5 and 6 did not show strong affinities with the characteristic sounds of specific groups, but can feasibly be associated with the families Ophidiidae and Batrachoididae, respectively, based on pulse count and acoustic characteristics, although further investigation is needed (Parmentier et al., 2010; Fine, Waybright, 2015). Overall, these associations are tentative and reflect plausible acoustic affinities based on available bioacoustic descriptions and phylogenetic proximity. Other taxa with poorly characterized acoustic repertoires may also contribute to these sound types, and species-specific measures would be necessary for definitive attribution of sounds to fish species.
Most of the reef fish sounds recorded in this study can be associated withthose produced by damselfishes (sounds 3 and 8, with 449 and 560 records, respectively), one of the most abundant families registered in the visual censuses. This predominance reflects both their abundance in reef habitats and their strong contribution to the marine biophony (Chaves et al., 2021; Lessa et al., 2025). Their high number of detections may also be related to recurrent diurnal behaviors, such as territory defense and algal garden maintenance, which often involve acoustic signaling (Parmentier et al., 2016; Weimann et al., 2018). Conversely, sounds similar to those generated by pempherids (sound 2, with only 42 records) showed the fewest detections, possibly reflecting their nocturnal habits and a tendency to remain sheltered and less active during the day (Radford et al., 2015). Intermediate numbers of records were observed for other groups, such as those associated with Haemulidae (sound 1, with 301 records), which are sounds normally emitted during social contact, disturbance, or feeding events (Moulton, 1958; Tavolga, 1965; Bertucci et al., 2014), and with Holocentridae (sounds 7 and 9, with 319 and 241 records, respectively). The latter, although primarily nocturnal, also engage in diurnal social spacing interactions that may favor sound detection (Banse et al., 2024a,b). Sounds associated with Batrachoididae (sound 4, with 86 records) were detected even though no individual was registered in visual censuses, showing that passive acoustic monitoring can reveal the presence of cryptic species with sporadic vocal activity (Picciulin et al., 2019; Wirth, Warren, 2020). Although these behavioral and ecological aspects partly explain the variation in sound occurrence among groups, environmental factors, particularly those related to sound pollution sources, may also influence the detectability and temporal dynamics of reef fish sounds.
In this context, when evaluating how sound pollution sources relate to the sounds emitted by reef fishes, differences were observed between exposed and sheltered sites: sounds 3, 4, and 6 were absent in exposed areas, and sound occurrences were generally lower. Although naturally low occurrences of particular species or differences in acoustic activity periods cannot be completely ruled out, the consistency of the results among sites suggests that noise associated with tourism activities may contribute to these patterns.. In this context,, three main mechanisms may explain the absence of some fish sounds: (1) masking, in which emitted sounds are covered by sound pollution sources (Popper, Hawkins, 2019), reducing their detectability both for natural receivers and for passive acoustic monitoring; (2) temporary suppression of sound emission, when fishes reduce or cease their vocalizations under high levels of sound pollution sources, such as that produced by boat engines (Alves et al., 2021); and (3) displacement of individuals to acoustically more favorable habitats, as previously reported for larger fishes leaving noisy areas (Weilgart, 2018). The latter mechanism, however, seems less likely in the context of this study, since sites more exposed to noise showed greater richness and abundance of soniferous species. Thus, the first two mechanisms are the most plausible and may act simultaneously; nevertheless, additional studies, especially those employing species-specific approaches, are needed to elucidate better the effects of sound pollution on the sound emissions of reef fishes.
Analyses of the effects of sound pollution sources on reef fish sounds, using PSD and ACI metrics, supported the influence of tourism and site exposure at the sampled locations. PSD analyses revealed two main peaks of sound energy at frequencies typically associated with fish sounds, between 0.4–0.5 kHz and 1.6–2 kHz, as also reported by Jarriel et al. (2024). Still, these peaks may have been distorted in contexts with high levels of tourism-related sound pollution. During peak tourism season, the lower-frequency peak was absent at most sites, and RMS PSD values were comparably elevated and flattened at low frequencies (0.05–0.3 kHz), a range commonly dominated by sound pollution sources such as boat traffic (Kaplan, Mooney, 2015). Conversely, at sites with lower noise conditions (e.g., sheltered sites during the shoulder season), both energy peaks were more prominent, indicating higher fish acoustic activity in the soundscape. Similarly, ACI values were lower at exposed sites, reflecting reduced acoustic complexity under higher noise conditions. These patterns collectively indicate an association between tourism-related sound pollution and reduced detectability and acoustic complexity of fish sounds (Bertucci et al., 2016; Picciulin et al., 2022; Duane et al., 2024).
Although the results obtained are relevant, it is important to consider certain limitations. The application of ACI, for example, may pose constraints for monitoring reef fish communities, as its calculation can vary depending on the software, parameters, and analysis protocols used, leading to differences between studies and study areas (Bolgan et al., 2018). In addition, this index is sensitive to the specific characteristics of each reef soundscape; factors such as habitat complexity, reef morphology, seasonal variability, and the intensity of biological and anthropogenic sound sources can influence its values (Lindseth, Lobel, 2018). Importantly, the effects of anthropogenic noise on ACI are not uniform, as this metric responds differently to sound sources depending on their temporal structure. As ACI appraises changes in modulation across time snippets, continuous sounds with low variability, such as those produced by boat engines and motors, the most common component of sound impacts in our study area, tend to reduce ACI values. Conversely, temporally more modulated sounds, such as biologically produced sounds, tend to increase them (Pieretti et al., 2011). This distinction aligns with the conceptual basis of ACI and with classical distinctions between hi-fi and lo-fi soundscapes (Schafer, 1977), in which the nature of anthropogenic inputs determines whether acoustic complexity increases or decreases. Despite this potential bidirectionality, our results showed an consistent decrease in ACI values in more exposed sites, supporting a scenario in which continuous noise overlaps with and masks lower-frequency biophonic components. The monitoring period employed in this study was adequate to evaluate associations between tourism-related sound pollution and variation in reef fish biophony; however, long-term monitoring could provide a deeper understanding of such dynamics, revealing temporal trends and cumulative effects that may complement and expand the evidence presented here. Nevertheless, the patterns observed represent an important foundation for understanding how tourism-associated noise may influence reef fish sound production and the structure of marine reef soundscapes.
Building on these findings, assessing the influence of tourism-related sound pollution on reef fish biophony is essential to understanding and protecting the ecological functions associated with these signals. Measuring how such disturbances affect the communication and sound production of these fish is vital for maintaining vital processes, such as reproduction, territorial defense, and social interactions (Van Oosterom et al., 2016; Ladich, 2019; Amorim, 2023; Azofeifa-Solano et al., 2025). These evaluations are even more critical in areas such as the northeastern coast of Brazil, where coral reefs are often located just a few meters from the shoreline (Leão et al., 2016) and are therefore particularly vulnerable to human activities, especially tourism (Ferreira, Maida, 2006). In this context, our results highlight the need to integrate data on reef fish sounds into the management plans of marine protected areas, thereby supporting the creation of measures such as regulating visitation schedules, defining acceptable noise levels, identifying the most harmful sound sources, and restricting activities that generate these impacts. Such actions could help mitigate the effects of tourism-related sound pollution and support the ecological functions sustained by reef fish sounds.In addition, the incorporation of new techniques, such as high-sensitivity hydrophones, real-time remote monitoring systems (Noble et al., 2024; Indeck et al., 2025), and machine learning approaches for the classification of fish sounds (Minier et al., 2025), may further expand the monitoring capacity in the future. This will provide even more robust information to support management measures, such as the creation of acoustic protection zones, the limitation of vessel traffic during critical reproductive periods, and the implementation of guidelines for low-impact recreational activities (McCloskey et al., 2020; Bosi et al., 2023). Such initiatives are vital to increase the resilience of reef ecosystems in the face of growing sound pollution sources pressures.
References
Allgeier JE, Valdivia A, Cox C, Layman CA. Fishing down nutrients on coral reefs. Nat Commun. 2016; 7(1):12461. https://doi.org/10.1038/ncomms12461
Alves D, Vieira M, Amorim MCP, Fonseca PJ. Boat noise interferes with Lusitanian toadfish acoustic communication. J Exp Biol. 2021; 224(11):jeb234849. https://doi.org/10.1242/jeb.234849
Amorim MCP. The role of acoustic signals in fish reproduction. J Acoust Soc Am. 2023; 154(5):2959–73. https://doi.org/10.1121/10.0022353
Araújo ME, Mattos FMG, Melo FPL, Chaves LDCT, Feitosa CV, Lippi DL et al. Diversity patterns of reef fish along the Brazilian tropical coast. Mar Environ Res. 2020; 160:105038. https://doi.org/10.1016/j.marenvres.2020.105038
Au WW, Hastings MC. Principles of marine bioacoustics. New York: Springer; 2008. https://doi.org/10.1007/978-0-387-78365-9
Azofeifa-Solano JC, Parsons MJ, Brooker R, McCauley R, Pygas D, Feeney W. Soundscape analysis reveals fine ecological differences among coral reef habitats. Ecol Indic. 2025; 171:113120. https://doi.org/10.1121/10.0017432
Banse M, Hanssen N, Sabbe J, Lecchini D, Donaldson TJ, Iwankow G. Same calls, different meanings: acoustic communication of Holocentridae. PLoS ONE. 2024b; 19(11):e0312191. https://doi.org/10.1371/journal.pone.0312191
Banse M, Minier L, Lecchini D. Acoustic mobbing behaviour: vocal fish responses to predation risk through sound communication. Mar Biol. 2024a; 171:141. https://doi.org/10.1007/s00227-024-04455-w
Bertucci F, Parmentier E, Lecellier G, Hawkins AD, Lecchini D. Acoustic indices provide information on the status of coral reefs: an example from Moorea Island in the South Pacific. Sci Rep. 2016; 6:33326. https://doi.org/10.1038/srep33326
Bertucci F, Ruppé L, Van Wassenbergh S, Compère P, Parmentier E. New insights into the role of the pharyngeal jaw apparatus in the sound-producing mechanism of Haemulon flavolineatum (Haemulidae). J Exp Biol. 2014; 217(21):3862–69. https://doi.org/10.1242/jeb.109025
Bioacoustics Research Program. Raven Pro: interactive sound analysis software, version 1.6.5. Ithaca, NY: The Cornell Lab of Ornithology; 2014.
Bohnenstiehl DR. Automated cataloging of oyster toadfish (Opsanus tau) boatwhistle calls using template matching and machine learning. Ecol Inform. 2023; 77:102268. https://doi.org/10.1016/j.ecoinf.2023.102268.
Bolgan M, Amorim MCP, Fonseca PJ, Di Iorio L, Parmentier E. Acoustic complexity of vocal fish communities: a field and controlled validation. Sci Rep. 2018; 8(1):10559. https://doi.org/10.1038/s41598-018-28771-6
Borie A, Rezende SM, Ferreira BP, Maida M, Radford C, Travassos P. Soundscape of protected and unprotected tropical Atlantic coastal coral reefs. Sci Mar. 2021; 85(1):5–14. https://doi.org/10.3989/scimar.05052.001
Bosi S, Ramieri E, Picciulin M, Menegon S, Ghezzo M, Petrizzo A et al. Is maritime spatial planning a tool to mitigate the impacts of underwater noise? A review of adopted and upcoming maritime spatial plans in Europe. Mar Policy. 2023; 155:105725. https://doi.org/10.1016/j.marpol.2023.105725
Buscaino G, Coppolaro VLM, Papale E, Gabetti A, Pelagatti M, Aguzzi J et al. Integrated video and acoustic monitoring of coastal fish biodiversity using a cabled observatory. Ecol Indic. 2025; 178:114025. https://doi.org/10.1016/j.ecolind.2025.114025
Carriço R, Silva MA, Menezes GM, Fonseca PJ, Amorim MCP. Characterization of the acoustic community of vocal fishes in the Azores. PeerJ. 2019; 7:e7772. https://doi.org/10.7717/peerj.7772
Ceraulo M, Papale E, Caruso F, Filiciotto F, Grammauta R, Parisi I et al. Acoustic comparison of a patchy Mediterranean shallow water seascape: posidonia oceanica meadow and sandy bottom habitats. Ecol Indic. 2018; 85:1030–43. https://doi.org/10.1016/j.ecolind.2017.08.066
Chaves LDC, Feitosa JL, Xavier TF, Ferreira BP, Ferreira CE. Drivers of damselfishes distribution patterns in the southwestern Atlantic: tropical and subtropical reefs compared. Neotrop Ichthyol. 2021; 19(4):e210010. https://doi.org/10.1590/1982-0224-2021-0010
Dantzker MS, Duggan MT, Berlik E, Delikaris-Manias S, Bountourakis V, Pulkki V et al. Deciphering complex coral reef soundscapes with spatial audio and 360 video. Methods Ecol Evol. 2025; 16(11):2622–37. https://doi.org/10.1111/2041-210X.70149
Desiderà E, Guidetti P, Panzalis P, Navone A, Valentini-Poirrier CA, Boissery P et al. Acoustic fish communities: sound diversity of rocky habitats reflects fish species diversity. Mar Ecol Prog Ser. 2019; 608:183–97. https://doi.org/10.3354/meps12812
Dobrin MB. Measurements of underwater noise produced by marine life. Science. 1947; 105(2714):19–23.
Duane D, Freeman S, Freeman L. Moonlight-driven biological choruses in Hawaiian coral reefs. PLoS ONE. 2024; 19(3):e0299916. https://doi.org/10.1371/journal.pone.0299916
Duarte CM, Chapuis L, Collin SP, Costa DP, Devassy RP, Eguiluz VM. The soundscape of the Anthropocene ocean. Science. 2021; 371(6529):eaba4658. https://doi.org/10.1126/science.aba4658
Erbe C, McCauley R, Gavrilov A, Madhusudhana SK, Verma A. The underwater soundscape around Australia. Proc Acoust. 2016; 1:8–17.
Farina A, Pieretti N, Piccioli L. The soundscape methodology for long-term bird monitoring: a Mediterranean Europe case-study. Ecol Inform. 2011; 6(6):354–63. https://doi.org/10.1016/j.ecoinf.2011.07.004
Feitosa JLL, Queiroz-Véras LVMV, Maida M, Ferreira BP. Going further on herbivore fishing: the removal of smaller fishes from algal-dominated reefs. Mar Ecol Prog Ser. 2023; 713:117–32. https://doi.org/10.3354/meps14335
Ferrier-Pagès C, Leal MC, Calado R, Schmid DW, Bertucci F, Lecchini D et al. Noise pollution on coral reefs? A yet underestimated threat to coral reef communities. Mar Pollut Bull. 2021; 165:112129. https://doi.org/10.1016/j.marpolbul.2021.112129
Fine ML, Parmentier E. Mechanisms of fish sound production. In: Ladich F, editor. Sound communication in fishes. Animal signals and communication, vol 4. Vienna: Springer; 2015. p.77–126. https://doi.org/10.1007/978-3-7091-1846-7_3
Fine ML, Waybright TD. Grunt variation in the oyster toadfish Opsanus tau: effect of size and sex. PeerJ. 2015; 3:e1330. https://doi.org/10.7717/peerj.1330
Fish MP, Mowbray WH. Sounds of western North Atlantic fishes: a reference file of biological underwater sounds. Baltimore: Johns Hopkins Press; 1970.
Fonseca PJ, Amorim MCP. Impacto do ruído de barcos em peixes. Rev Ciênc Elem. 2019; 7(2):019. http://doi.org/10.24927/rce2019.019
Green JM. Studies on the swim bladders of Eucinostomus gula and E. argenteus (Pisces: Gerridae). Bull Mar Sci. 1971; 21(2):567–90.
Hawkins LA, Parsons MJ, McCauley RD, Parnum IM, Erbe C. Passive acoustic monitoring of fish choruses: a review to inform the development of a monitoring and management tool. Rev Fish Biol Fish. 2025; 35:847–74. https://doi.org/10.1007/s11160-025-09936-9
Hildebrand JA. Anthropogenic and natural sources of ambient noise in the ocean. Mar Ecol Prog Ser. 2009; 395:5–20. https://doi.org/10.3354/meps
Hill MO. Diversity and evenness: a unifying notation and its consequences. Ecology. 1973; 54(2):427–32.
Indeck KL, Baumgartner MF, Lecavalier L, Whoriskey F, Durette-Morin D, Pettigrew NR et al. Glider surveillance for near-real-time detection and spatial management of North Atlantic right whales. Oceanography. 2025; 38(1):13–21. Available from: https://www.jstor.org/stable/27374560
Jarriel SD, Formel N, Ferguson SR, Jensen FH, Apprill A, Mooney TA. Unidentified fish sounds as indicators of coral reef health and comparison to other acoustic methods. Front Remote Sens. 2024; 5:1338586. https://doi.org/10.3389/frsen.2024.1338586
De Jong K, Amorim MCP, Fonseca PJ, Fox CJ, Heubel KU. Noise can affect acoustic communication and subsequent spawning success in fish. Environ Pollut. 2018; 237:814–23. https://doi.org/10.1016/j.envpol.2017.11.003
De Jong K, Forland TN, Amorim MCP. Predicting the effects of anthropogenic noise on fish reproduction. Rev Fish Biol Fish. 2020; 30:245–68. https://doi.org/10.1007/s11160-020-09598-9
Jost L. Entropy and diversity. Oikos. 2006; 113(2):363–75.
Kaplan MB, Mooney TA. Ambient noise and temporal patterns of boat activity in the US Virgin Islands National Park. Mar Pollut Bull. 2015; 98(1–2):221–28. https://doi.org/10.1016/j.marpolbul.2015.06.047
Kasumyan AO. Acoustic signaling in fish. J Ichthyol. 2009; 49:963–1020. https://doi.org/10.1134/S0032945209110010
Kim EB, Frasier KE, McKenna MF, Kok A, Reeves LEP, Oestreich WK. SoundScape learning: an automatic method for separating fish chorus in marine soundscapes. J Acoust Soc Am. 2023; 153(3):1710–22. https://doi.org/10.1121/10.0017432
Ladich F. Ecology of sound communication in fishes. Fish Fish. 2019; 20(3):552–63. https://doi.org/10.1111/faf.12368
Leão ZM, Kikuchi RK, Ferreira BP, Neves EG, Sovierzoski HH, Oliveira MD et al. Brazilian coral reefs in a period of global change: a synthesis. Braz J Oceanogr. 2016; 64:97–116. https://doi.org/10.1590/S1679-875920160916064sp2
Lessa AA, Xavier FC, Barroso VR, Cordeiro CA, Ferreira CE. Exposure to anthropogenic noise affects feeding but not territory defence in damselfishes. Anim Behav. 2025; 123:123130. https://doi.org/10.1016/j.anbehav.2025.123130
Lindseth AV, Lobel PS. Underwater soundscape monitoring and fish bioacoustics: a review. Fishes. 2018; 3(3):36. https://doi.org/10.3390/fishes3030036
Maida M, Ferreira BP. Coral reefs of Brazil: an overview. Proc 8th Int Coral Reef Symp. 1997; 1:263–74.
Marcon E, Hérault B. entropart: an R package to compute and partition diversity. J Stat Softw. 2015; 67(8):1–26. https://doi.org/10.18637/jss.v067.i08
Martinez P. pairwiseAdonis: pairwise multilevel comparison using adonis, R package version 0.4; 2020.
Maruska KP, Boyle KS, Dewan LR, Tricas TC. Sound production and spectral hearing sensitivity in the Hawaiian sergeant damselfish, Abudefduf abdominalis. J Exp Biol. 2007; 210(22):3990–4004. https://doi.org/10.1242/jeb.004390
McCloskey KP, Chapman KE, Chapuis L, McCormick MI, Radford AN, Simpson SD. Assessing and mitigating impacts of motorboat noise on nesting damselfish. Environ Pollut. 2020; 266:115376. https://doi.org/10.1016/j.envpol.2020.115376
McCordic JA, DeAngelis AI, Kline LR, McBride C, Rodgers GG, Rowell TJ. Biological sound sources drive soundscape characteristics of two australian marine parks. Front Mar Sci. 2021; 8:669412. https://doi.org/10.3389/fmars.2021.669412
Merchant ND, Barton TR, Thompson PM, Pirotta E, Dakin DT, Dorocicz J. Spectral probability density as a tool for ambient noise analysis. J Acoust Soc Am. 2013; 133(4):262–67. https://doi.org/10.1121/1.4794934
Minier L, Rouch J, Sabbagh B, Bertucci F, Parmentier E, Lecchini D et al. Visualization and quantification of coral reef soundscapes using CoralSoundExplorer software. In: PLoS Comput Biol. 2025; 21(4):e1012050. https://doi.org/10.1371/journal.pcbi.1012050
Morais RA, Ferreira CEL, Floeter SR. Spatial patterns of fish standing biomass across Brazilian reefs. J Fish Biol. 2017; 91(6):1642–67. https://doi.org/10.1111/jfb.13482
Moulton JM. The acoustical behavior of some fishes in the Bimini area. Biol Bull. 1958; 114(3):357–74. https://doi.org/10.2307/1538991
Noble AE, Jensen FH, Jarriel SD, Aoki N, Ferguson SR, Hyer MD et al. Unsupervised clustering reveals acoustic diversity and niche differentiation in pulsed calls from a coral reef ecosystem. Front Remote Sens. 2024; 5:1429227. https://doi.org/10.3389/frsen.2024.1429227
Ogle DH, Doll JC, Wheeler AP, Dinno A. FSA: simple fisheries stock assessment methods. 2025. https://doi.org/10.32614/CRAN.package.FSA
Oksanen J, Simpson G, Blanchet F, Kindt R, Legendre P, Minchin P et al. vegan: community ecology package. R package version 2.8-0; 2025. https://doi.org/10.32614/CRAN.package.vegan
Van Oosterom L, Montgomery JC, Jeffs AG, Radford CA. Evidence for contact calls in fish: conspecific vocalisations and ambient soundscape influence group cohesion in a nocturnal species. Sci Rep. 2016; 6(1):19098. https://doi.org/10.1038/srep19098
Parmentier E, Bouillac G, Dragičević B, Dulčić J, Fine M. Call properties and morphology of the sound-producing organ in Ophidion rochei (Ophidiidae). J Exp Biol. 2010; 213(18):3230–36. https://doi.org/10.1242/jeb.044701
Parmentier E, Fine ML. Fish sound production: insights. In: Suthers R, Fitch W, Fay R, Popper A, editors. Vertebrate sound production and acoustic communication. Springer handbook of auditory research, vol. 53. Cham: Springer; 2016. p.19–49. https://doi.org/10.1007/978-3-319-27721-9_2
Parmentier E, Lecchini D, Mann DA. Sound production in damselfishes. In: Frédérich B, Parmentier E, editors. Biology of damselfishes. Boca Raton: CRC Press; 2016. p.204–28.
Picciulin M, Bolgan M, Codarin A, Fiorin R, Zucchetta M, Malavasi S. Passive acoustic monitoring of Sciaena umbra on rocky habitats in the Venetian littoral zone. Fish Res. 2013; 145:76–81. https://doi.org/10.1016/j.fishres.2013.02.008
Picciulin M, Bolgan M, Rako-Gospić N, Petrizzo A, Radulović M, Falkner R. A fish and dolphin biophony in the boat noise-dominated soundscape of the Cres-Lošinj archipelago (Croatia). J Mar Sci Eng. 2022; 10(2):300. https://doi.org/10.3390/jmse10020300
Picciulin M, Kéver L, Parmentier E, Bolgan M. Listening to the unseen: passive acoustic monitoring reveals the presence of a cryptic fish species. Aquat Conserv Mar Freshw Ecosyst. 2019; 29(2):202–10. https://doi.org/10.1002/aqc.2973
Pieretti N, Farina A, Morri D. A new methodology to infer the singing activity of an avian community: the Acoustic Complexity Index (ACI). Ecol Indic. 2011; 11(3):868–73. https://doi.org/10.1016/j.ecolind.2010.11.005
Popper AN, Hawkins AD. An overview of fish bioacoustics and the impacts of anthropogenic sounds on fishes. J Fish Biol. 2019; 94(5):692–713. https://doi.org/10.1111/jfb.13948
Popper AN. Effects of anthropogenic sounds on fishes. Fisheries. 2003; 28(10):24–31. https://doi.org/10.1577/1548-8446(2003)28[24:EOASOF]2.0.CO;2
R Development Core Team. R: a language and environment for statistical computing. Vienna, Austria: R Foundation for Statistical Computing; 2020. Available from: https://www.r-project.org/
Radford CA, Ghazali S, Jeffs AG, Montgomery JC. Vocalisations of the bigeye Pempheris adspersa: characteristics, source level and active space. J Exp Biol. 2015; 218(6):940–48. https://doi.org/10.1242/jeb.115295
Salas AK, Ballard MS, Mooney TA, Wilson PS. Effects of frequency-dependent spatial variation in soundscape settlement cues for reef fish larvae. Mar Ecol Prog Ser. 2022; 687:1–21. https://doi.org/10.3354/meps14012
Santiago JA, Castro JJ. Acoustic behaviour of Abudefduf luridus. J Fish Biol. 1997; 51(5):952–59. https://doi.org/10.1111/j.1095-8649.1997.tb01534.x
Schafer RM. The soundscape: our sonic environment and the tuning of the world. 1st ed. Rochester: Destiny Books; 1977.
Simpson SD, Radford AN, Holles S, Ferarri MCO, Chivers DP, McCormick MI et al. Small-boat noise impacts natural settlement behavior of coral reef fish larvae. In: Popper AN, Hawkins A, editors. The effects of noise on aquatic life II. New York: Springer; 2016. p.1041–48. https://doi.org/10.1007/978-1-4939-2981-8_129
Song Z, Ou W, Su Y, Li H, Fan W, Sun S. Sounds of snapping shrimp (Alpheidae) as important input to the soundscape in the southeast China coastal sea. Front Mar Sci. 2023; 10:1029003. https://doi.org/10.3389/fmars.2023.1029003
Sura SA, Lloyd-Smith JO, Fong P. Herbivore community function shapes resilience and bistability of coral reefs. PLoS Comput Biol. 2025; 21(7):e1013221. https://doi.org/10.1371/journal.pcbi.1013221
Tavolga WN, Popper AN, Fay RR, editors. Hearing and sound communication in fishes. New York: Springer Science & Business Media; 2012.
Tavolga WN. Review of marine bio-acoustics: report 1212-1. Port Washington, NY: US Naval Training Device Center; 1965.
Tricas TC, Boyle KS. Acoustic behaviors in Hawaiian coral reef fish communities. Mar Ecol Prog Ser. 2014; 511:1–16. https://doi.org/10.3354/meps10930
Weilgart L. The impact of ocean noise pollution on fish and invertebrates. Switzerland: OceanCare; 2018.
Weimann SR, Black AN, Leese J, Richter ML, Itzkowitz M, Burger RM. Territorial vocalization in sympatric damselfish: acoustic characteristics and intruder discrimination. Bioacoustics. 2018; 27(1):87–102. https://doi.org/10.1080/09524622.2017.1286263
Wildlife Acoustics. Kaleidoscope pro analysis software, version 5.1.0. Maynard, MA: Wildlife Acoustics, Inc.; 2019. Available from: https://www.wildlifeacoustics.com/release-notes/kaleidoscope-pro
Wirth C, Warren JD. Spatial and temporal variation in toadfish (Opsanus tau) and cusk eel (Ophidion marginatum) mating choruses in eelgrass (Zostera marina) beds in a shallow, temperate estuary. Bioacoustics. 2020; 29(1):61–78. https://doi.org/10.1080/09524622.2018.1563863
Xavier TF, Costa BFB, Bezerra BM, Feitosa JLL. Reef fish species discrimination through acoustics: sound characteristics of three Haemulon species (Perciformes: Haemulidae) in the Southwestern Atlantic. Bioacoustics. 2024; 33(6):545–61. https://doi.org/10.1080/09524622.2024.2422583
Xavier TF, Véras LVMVQ, Sousa TH, Feitosa JLL. Baseline assessment of tourism-related sound pollution effects on the marine soundscapes of the largest coastal marine protected area in Brazil. Bioacoustics. 2026. https://doi.org/10.1080/09524622.2026.2647300
Authors

Túlio Freire Xavier1,2 , Luísa Valentim Melo de Vasconcelos Queiroz Véras1,2 and João Lucas Leão Feitosa1
[1] Universidade Federal de Pernambuco (UFPE), Campus Recife, Laboratório de Pesquisa em Ictiologia e Ecologia de Recifes (LABPIER), Centro de Biociências (CB), Departamento de Zoologia, Av. Professor Moraes Rego, s/n, Cidade Universitária, 50670 420, Recife, PE, Brazil. (TFX) tuliofreire982@gmail.com (corresponding author), (LVMVQV) luisamqueiroz@gmail.com, (JLLF) feitosajll@gmail.com.
[2] Programa de Pós-Graduação em Biologia Animal (PPGBA), Universidade Federal de Pernambuco (UFPE), Campus Recife, Centro de Biociências (CB), Av. Professor Moraes Rego, s/n, Cidade Universitária, 50670-420, Recife, PE, Brazil.
Authors’ Contribution 

Túlio Freire Xavier: Conceptualization, Data curation, Formal analysis, Funding acquisition, Investigation, Methodology, Project administration, Writing-original draft, Writing-review and editing.
Luísa Valentim Melo de Vasconcelos Queiroz Véras: Data curation, Methodology, Supervision, Writing-original draft, Writing-review and editing.
João Lucas Leão Feitosa: Conceptualization, Formal analysis, Funding acquisition, Investigation, Methodology, Supervision, Validation, Visualization, Writing-original draft, Writing-review and editing.
Ethical Statement
The recordings of the marine reef soundscapes were conducted in accordance with ethical standards and were authorized under the number 82961–1 MMA/ICMBio, issued by the Government of Brazil.
Competing Interests
The author declares no competing interests.
Data availability statement
The data supporting the findings of this study are available from the corresponding author, upon reasonable request.
AI statement
The ChatGPT (OpenAI) model was used to assist with grammatical correction and editing of the English text.
Funding
The authors would like to express their gratitude to the Rufford Foundation for the financial support provided under grant code 38537–1, and to Coordenação de Aperfeiçoamento de Pessoal de Nível Superior (CAPES) – Finance Code 001 for the scholarships that enabled the execution of this project.
Supplementary Material
Supplementary material SUP
Peer Review
How to cite this article
Xavier TF, Véras LVMVQ, Feitosa JLL. Reef fish biophony under tourism-driven sound pollution in Northeastern Brazil. Neotrop Ichthyol. 2026; 24(2):e260010. https://doi.org/10.1590/1982-0224-2026-0010
Copyright
This is an open access article under the terms of the Creative Commons Attribution License, which permits use, distribution and reproduction in any medium, provided the original work is properly cited.
Distributed under
Creative Commons CC-BY 4.0

© 2025 The Authors.
Diversity and Distributions Published by SBI
 Accepted February 16, 2026
Submitted November 6, 2025
Epub July 20, 2026