
 Marina Gomes Leonardo1, Éder Cristian Malta de Lanes1, Felipe Arian de Andrade Araújo1
  , Vanessa Paes da Cruz2, Silvia Eliza Pavan3, Iann Leonardo Pinheiro Monteiro1, Tânia Fontes Quaresma1, Claudio Oliveira3 and Alberto Akama1,4
PDF: Download Here | Supplementary: Sup | Cite this article
Associate Editor: Marcelo Cioffi
Section Editor: Izeni Farias
Editor-in-chief: José Birindelli
Abstract
A bacia Araguaia-Tocantins é um hotspot de endemismo de peixes no bioma Amazônico, porém encontra-se ameaçada pela fragmentação de habitats e degradação ambiental, especialmente pela implantação de hidrelétricas e hidrovias. Esses impactos antrópicos representam riscos críticos a habitats lóticos, como corredeiras, que sustentam táxons especializados e de distribuição restrita. Nesse contexto, realizamos a primeira avaliação genômica populacional de três espécies do gênero Baryancistrus (B. longipinnis, B. niveatus e Baryancistrus sp. “Araguaia”), utilizando SNPs obtidos por ddRADseq. As análises revelaram fraca estruturação populacional, com baixa diferenciação genética. Foi detectado um sinal sutil de isolamento por distância em B. niveatus, além de evidências de parentesco em curtas distâncias em B. niveatus e B. longipinnis. Modelos de genética da paisagem (MLPE), indicaram que gradientes ambientais, especialmente turbidez, declividade e condição ripária, moldaram significativamente os padrões genéticos espaciais, sobretudo em B. niveatus. Destaca-se que B. longipinnis apresentou baixa diversidade genética (HO = 0,31 (0,28–0,35); HE = 0,356 (0,36–0,37)), elevados coeficientes de endogamia (F = 0,12 (0,03–0,20)) e sinais de erosão genética em curso. Inferências demográficas baseadas nos valores de D de Tajima sugerem contração populacional em todas as espécies, provavelmente associada à perda de habitat. Esses resultados evidenciam a vulnerabilidade de táxons reofílicos e identificam as corredeiras do Pedral do Lourenço como um refúgio-chave para B. longipinnis, reforçando a necessidade de sua proteção imediata.
Palavras-chave: Biodiversidade de água doce, Genética da conservação, Genética da paisagem, Peixes reofílicos.
Introduction
In recent decades, anthropogenic impacts on freshwater ecosystems have intensified, leading to habitat loss and pollution, which threaten aquatic genetic resources and contribute to the extinction of native species (Visser et al., 2023). Although rivers and lakes cover less than 1% of Earth’s surface (Allen, Pavelsky, 2018), they support around one-quarter of all vertebrate species, mainly fishes (Helfman, 2007).
Habitat degradation and fragmentation are among the primary global drivers of biodiversity decline (Díaz et al., 2019; Peluso et al., 2023). Habitat loss can reduce genetic variation through increased inbreeding and random fixation of deleterious alleles (Hanski, 2011; Allendorf et al., 2013), thereby raising extinction risks for wild populations (Gallardo et al., 2018; Reid et al., 2019). Consequently, the number of threatened species tends to rise in areas where high fish diversity overlaps with dense human populations, habitat fragmentation, and intensive resource exploitation (Closs et al., 2015; Leidy, Moyle, 2021). One of the major threats to freshwater biodiversity is the implementation of power plants, provoking impacts on ecological processes and the disappearance of fish species (Araújo et al., 2013; Barbarossa et al., 2020; Keppeleret al., 2022; Pezzuti et al., 2024).
In this context, the geomorphology of Neotropical rivers, especially in the Amazon, known as the “last energy frontier”, has favored extensive dam construction, nearly 200 built and over 340 planned (Goulding et al., 2003; Arantes et al., 2019; Flecker et al., 2022; Peluso et al., 2022). These structures profoundly alter river morphology, water flow, substrate, and temperature (Liu et al., 2019), triggering cascading ecological effects such as the disruption of trophic networks (Reid et al., 2019).
In Brazil, lotic habitats such as the rapids of the Tocantins-Araguaia River basin (TO-AR) have undergone radical transformation due to damming (Goulding, 2003; Chamon et al., 2022). Under pristine conditions, these habitats are characterized by bedrock substrates, waterfalls, high water velocity, and complex structural matrices that support specialized and often endemic fish communities (Hrbek et al., 2018). Among these fishes, armored catfishes (Siluriformes: Loricariidae) are emblematic rheophilic species. Despite their ecological and economic relevance, knowledge about the bioecological aspects of this group remains limited (Suzuki et al., 2000; Borzone Mas et al., 2019).
An example of the impacts of habitat alteration on this group is that all Baryancistrus species native to the TO-AR basin are currently listed under some level of threat by both the IUCN and ICMBio. These species are subject to ornamental trade and subsistence fishing (ICMBio, 2018), and are long-lived, with estimated lifespans of up to 20 years and generation times of approximately 11.5 years (CO, 2024, pers. comm.). Baryancistrus longipinnis (Kindle, 1895) is endemic and Endangered (EN) to the Tocantins River, but currently its populations are restricted to a few stretches of rapids near Marabá city, especially in the Pedral do Lourenço, where it is most abundant (Araújo et al., 2025). In contrast, Baryancistrus niveatus (Castelnau, 1855), listed as Vulnerable (VU), has a broader distribution, occurring throughout the TO-AR basin. A third, likely undescribed species, Baryancistrus sp. “Araguaia”, has also been reported in the region (Oliveira, 2018). This scenario is especially concerning in a basin historically affected by habitat modification, extractivism, agriculture, and livestock expansion (Akama, 2017). Despite their conservation status and ecological importance, little is known about the genetic consequences of these disturbances for Baryancistrus species, which hinders the development of effective management strategies.
To address these conservation concerns, we employed large-scale genomic data derived from double-digest Restriction-site Associated DNA Sequencing (ddRADSeq) to assess genetic diversity patterns in these rheophilic species. ddRADSeq is a cost-effective, reference-free method capable of generating thousands of SNPs, and is particularly useful for studies where the available sample size is moderate or variable, or where the quality of biological material is compromised(Allendorf et al., 2010; Nazareno et al., 2017; Khoshkholgh et al., 2020). It has proven effective in evaluating genetic diversity, population structure, and signatures of local adaptation (Saha et al., 2021; Herkenhoff, 2025).
We hypothesize that the spatial configuration of rheophilic habitats, along with species-specific ecological constraints, shapes patterns of genetic variation, and vulnerability. Specifically, we test the following predictions: i) Baryancistrus longipinnis, due to its actual restricted range, will exhibit lower genetic diversity and higher spatial genetic structure than B. niveatus and Baryancistrus sp. “Araguaia” which have wider distributions; ii) genetic differentiation will not be explained solely by riverine distance (Isolation by Distance – IBD); we expect a significant role for environmental variation (Isolation by Environment – IBE), such as differences in water temperature, turbidity, and riparian vegetation on it; iii) habitat loss from 1985 to 2020, particularly damming, will negatively affect genetic diversity, with individuals from impacted areas showing reduced expected heterozygosity (HE) and increased inbreeding (F). These effects are expected to be most pronounced in B. longipinnis due to its narrow distribution and greater susceptibility to genetic drift and environmental stress.
Material and methods
Study area and sampling. Specimens of the genus Baryancistrus (n = 47) were collected from 10 sites within the Tocantins-Araguaia (TO-AR) river basin, spanning three Brazilian states: Pará (Marabá, São João do Araguaia, São Geraldo do Araguaia), Tocantins (Itaguatins and Peixe), and Maranhão (Porto Franco) (Tab. 1). Sampling was conducted between October 2019 and July 2021 by diving and using hand nets in lotic habitats characterized by rapids.
TABLE 1 | Summary of genetic diversity metrics for Baryancistrus longipinnis, B. niveatus, and Baryancistrus sp.“Araguaia” by Region and Overall, with 95% Confidence Intervals. Sample sizes (N) are shown followed by mean observed heterozygosity (HO), mean expected heterozygosity (HE), mean inbreeding coefficient (F), and mean per-site nucleotide diversity (π). All estimates are shown along 95% confidence intervals (CI).
Species | Region | N | HO (CI) | HE (CI) | F (CI) | π (CI) | Tajima’s D |
B. longipinnis | Region 1 | 15 | 0.36 (0.33/0.39) | 0.373 (0.370/0.380) | 0.03 (-0.05/0.12) | 0.039 (0.035/0.044) | 1.29 (1.10/1.45) |
Region 2 | 9 | 0.35 (0.30/0.40) | 0.380 (0.370/0.390) | 0.07 (-0.05/0.20) | 0.029 (0.025/0.033) | 0.24 (0.06/0.43) | |
Overall | 24 | 0.31 (0.28/0.35) | 0.356 (0.352/0.360) | 0.12 (0.03/0.20) | 0.04 (0.034/0.043) | 0.78 (0.65/1.03) | |
B. niveatus | Region 2 | 11 | 0.47 (0.42/0.51) | 0.406 (0.402/0.409) | -0.15 (-0.26/-0.04) | 0.01 (0.008/0.013) | 1.18 (0.79/1.51) |
Overall | 15 | 0.45 (0.42/0.48) | 0.402 (0.399/0.405) | -0.12 (-0.20/-0.04) | 0.011 (0.009/0.013) | 1.61 (1.29/1.87) | |
Baryancistrus sp. “Araguaia” | Overall | 6 | 0.73 (0.60/0.86) | 0.495 (0.497/0.503) | -0.48 (-0.76/-0.20) | 0.003 (0.002/0.004) | 1.64 (0.98/2.10) |
The unequal number of individuals per species reflects the natural abundance and availability of each taxon at the sampling sites, as well as the logistical constraints of fieldwork in extreme environments. All samples were georeferenced and identified to the species level using the identification key provided by Oliveira (2018) (Tab. S1), tissue samples were preserved in microtubes containing 96% ethanol or on cryogeny for subsequent molecular analyses. The sampling range covered sites from the upper Tocantins River to the reservoir of the Tucuruí Hydroelectric Power Dam (approx. 4° to 12°S and 47° to 49°W), Eastern Amazon, Brazil (Fig. 1). Given their habitat specificity and potential vulnerability to fragmentation, we designed our experimental approach to investigate how environmental and spatial factors affect genetic diversity and population structure across the basin.
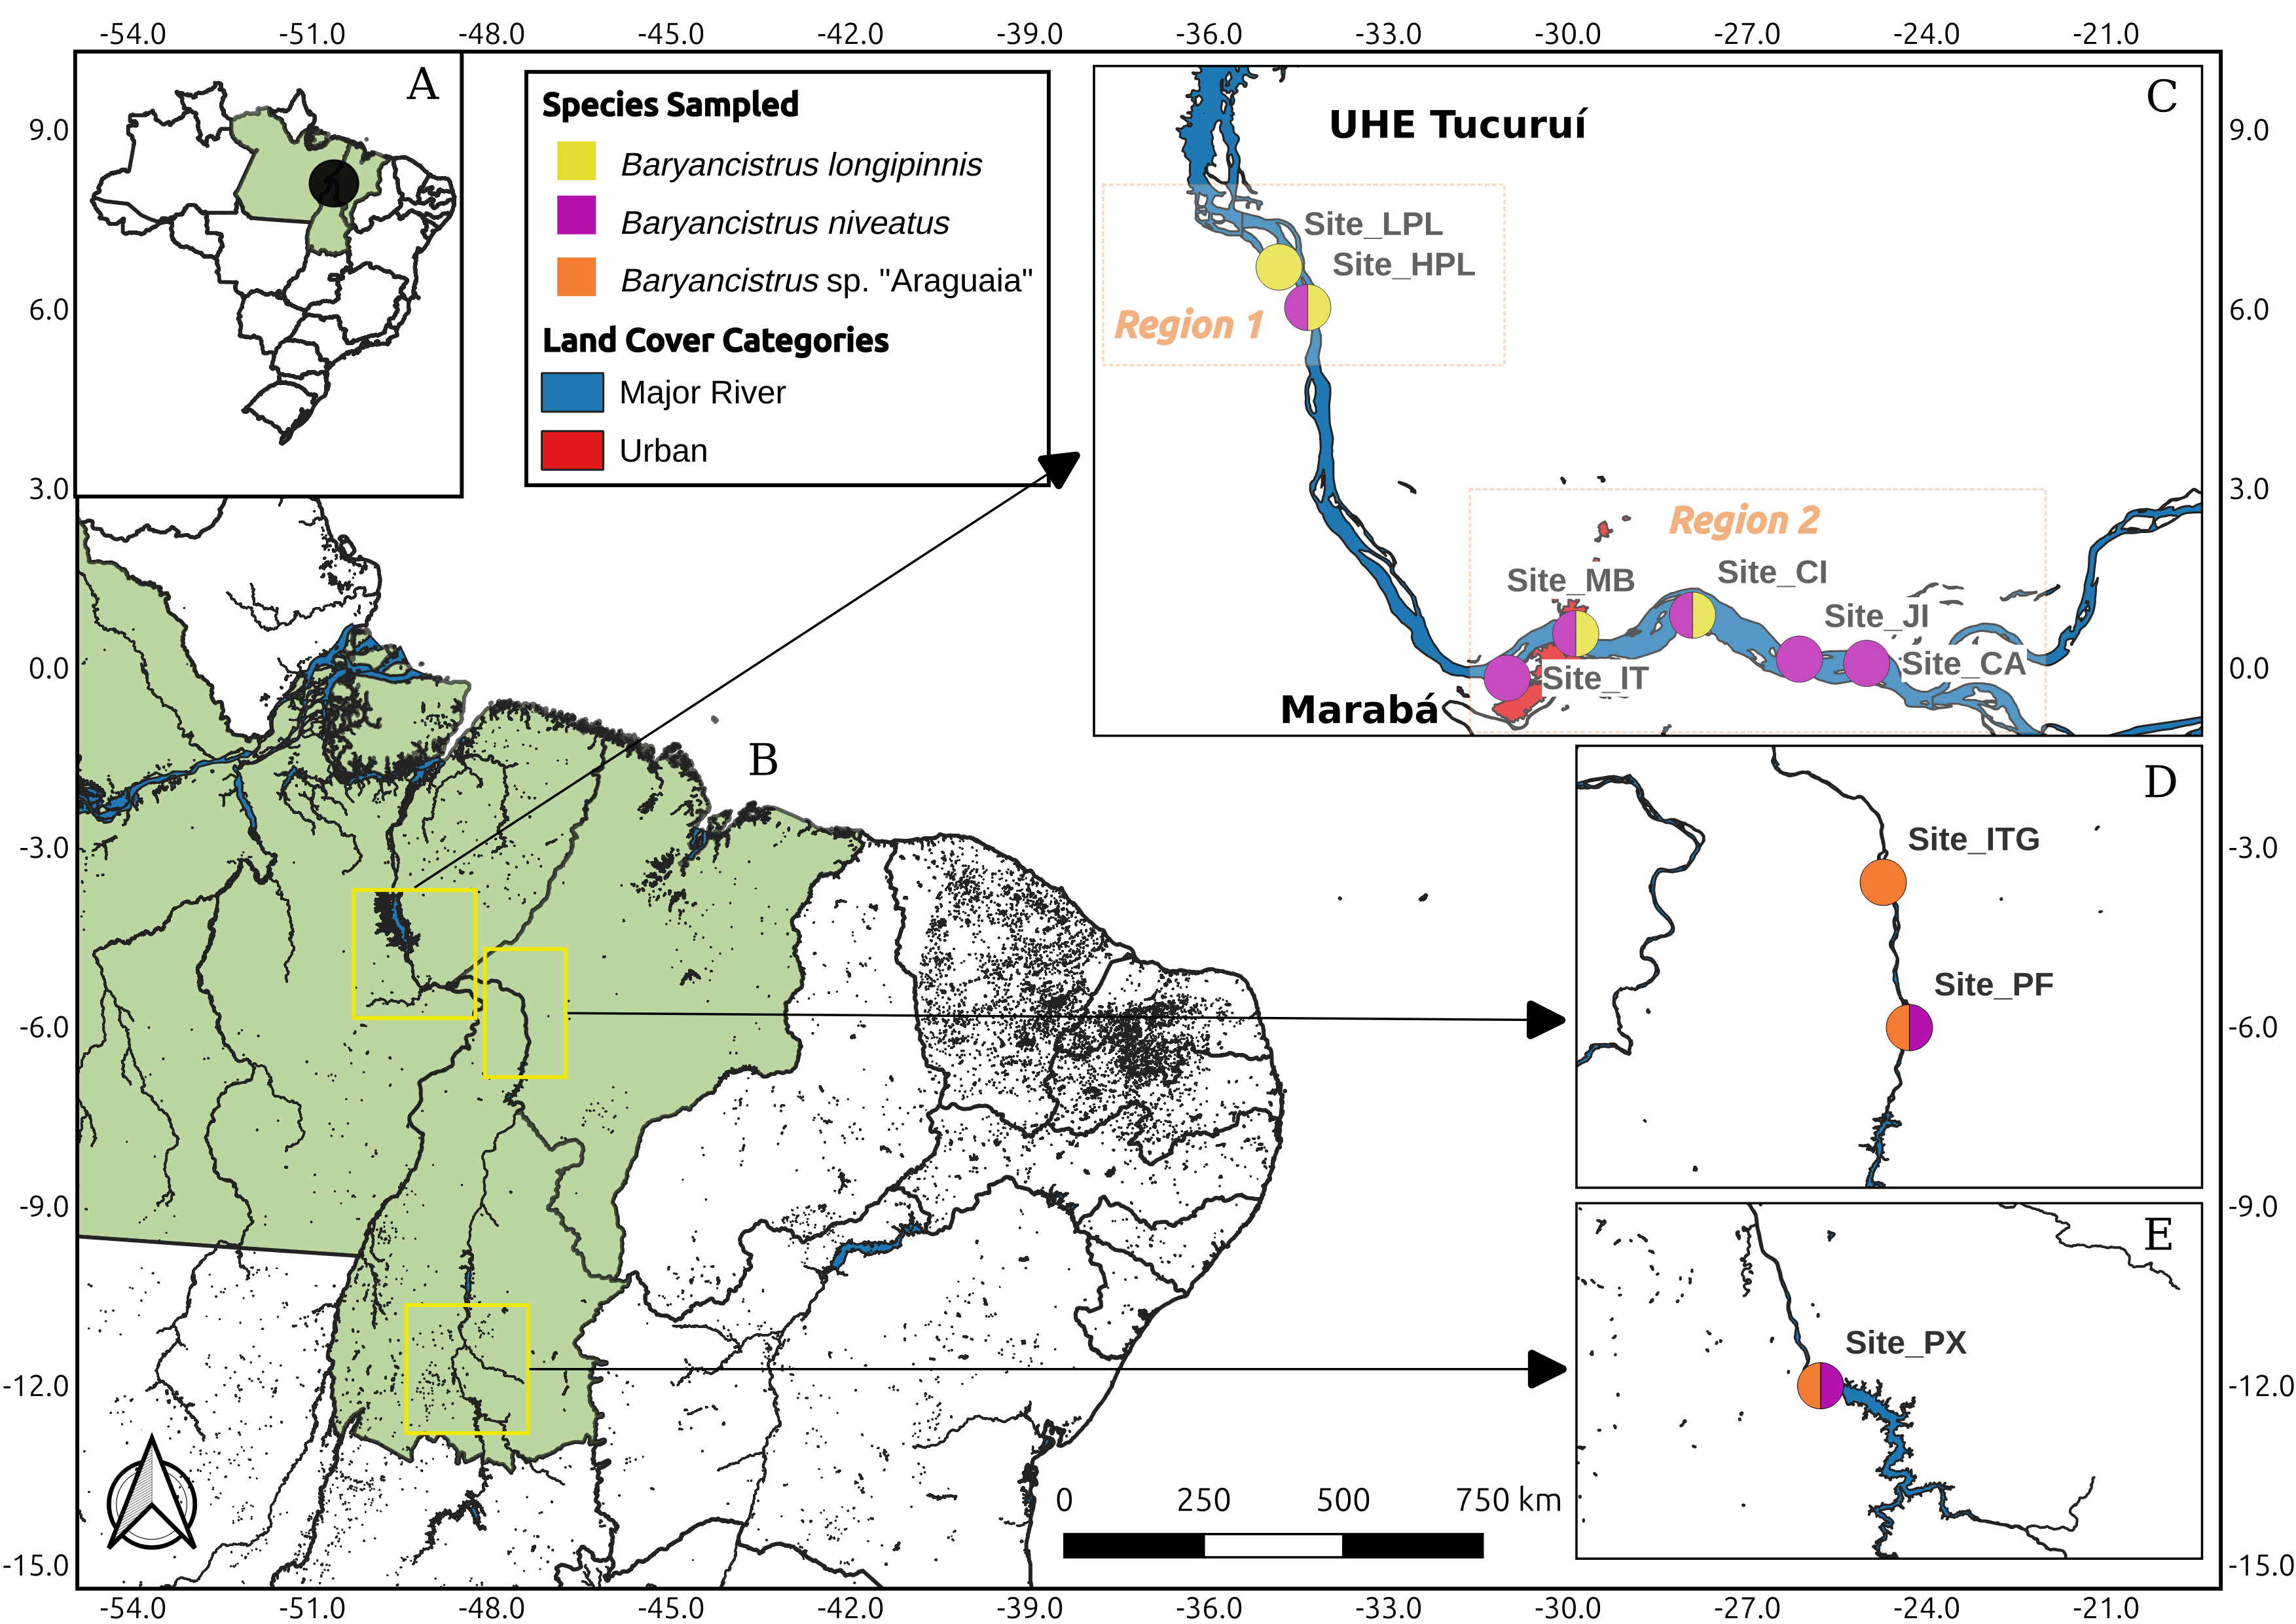
FIGURE 1| Map of the study area showing the locations of sampling sites for B. longipinnis, B. niveatus, and Baryancistrus sp. “Araguaia”. Sampling sites are denoted by specific site codes (refer to Tab. S1 for full details and geographical coordinates). Region 1 and Region 2 represent microregions located near the Tucuruí Dam and around the city of Marabá. Abbreviations for localities: Low Pedral do Lourenço (LPL; representing a distinct collection point within the broader Pedral do Lourenço area); High Pedral do Lourenço (HPl; representing a distinct collection point within the broader Pedral do Lourenço area); Marabá (MB); Cabras Island (CI); Itacaiúnas (IT); Ilha do Jaú (JI); Caju Amigo (CA); Itaguatins (ITG); Porto Franco (PF); and Peixe (PX). Circles containing multiple colors indicate zones of sympatry where two species co-occur. The inset map in the upper left corner highlights the position of the Tucuruí Dam within the broader region.
Experimental design and preliminary analyses. Considering that B. longipinnis and B. niveatus inhabit specific riverine locations and exhibit low mobility traits inherent to rheophilic species, we anticipated that such characteristics could strongly influence their genetic connectivity into genetic variation and landscape genetics were based on preliminary population structure analyses, utilizing genetic data obtained from sampled individuals. These analyses were crucial for confirming species taxonomic classification and notably revealed an absence of significant intra-specific genetic structuring, as will be demonstrated throughout this study. A third undescribed species (Baryancistrus sp. “Araguaia”) was collected in the rio Tocantins basin (n = 6 individuals) but was not considered in the landscape genetics analyses due to low sample size, with only its population genetic diversity parameters being estimated.
To address the influence of landscape in a contextualized manner, sampling localities were grouped into two main macro-regions based on spatial proximity and prevailing anthropogenic pressures. Region 1 encompasses upstream sites near the Tucuruí Hydroelectric Dam. Region 2 comprises midstream areas surrounding the urban center of Marabá. The choice of regional divisions (Regions 1 and 2) reflects known ecological discontinuities and contrasts in land-use intensity, providing a relevant spatial framework for testing the influence of habitat history and loss on species genetic parameters. This regionalized approach justified the subsequent experimental design, enabling the analysis of populations within each of these two regions as cohesive units.
RAD sequencing and bioinformatics. DNA was extracted using the DNeasy Blood & Tissue Kit (Qiagen, EUA), DNA quantification was performed using the Qubit High Sensitivity Assay kit (Invitrogen, USA), and DNA integrity was assessed through 1.2% agarose gel electrophoresis. We selected all 47 DNA samples with sufficient nondegraded DNA to comply with the protocol double digest restriction site-associated DNA sequencing (ddRADseq) following Peterson et al. (2012), adapted by Campos et al. (2017). The genomic DNA was adjusted to a final concentration of 5 ng/μL in a final volume of 30 μL. The genomic libraries were sequenced using 150 pb single-end sequencing in an Illumina NextSeq-500 sequencing system (Illumina, San Diego, CA, USA) with four flow cell lanes High Output, 300 cycles SE (1 x 150 pb).
The quality control of the generated ddRADSeq data was verified before and after trimming with FastQC and MultiQC using the ‘fastqcr’ R package (Kassambara, 2019). An in-silico digestion was performed, according to Peterson et al. (2012), to remove reads without the expected restriction site. Trimmomatic v. 0.39 (Bolger et al., 2014) was used to remove Illumina adapter sequences (HEADCROP:5) and reads with quality below a Phred score of Q20 (AVGQUAL:20), and then sequences were trimmed to 140 bp length (MINLEN:140; CROP:140). In STACKS software, RAD loci were assembled de novo pipeline implemented in the “denovo_map.pl” module (Catchen et al., 2011, 2013) using the following parameters: -M = 2, -m = 3 and -n = 1. Genotype calling and further processing were performed using a populations module (Catchen et al., 2011, 2013), in which loci with observed heterozygosity >0.7 (-max-obs-het), with a minor allele frequency of <0.025 (-min-maf) and loci genotyped in <50% of individuals (-r, most liberal filter value according to Halsey et al., 2022) were removed. The ‘-write_single_snp’ option was applied to restrict the analysis to the first SNP per locus and reduce the effects of linkage disequilibrium required for population genetic analyses. The output dataset was saved as a variant call format (VCF). Four datasets were generated: one with all species (“dataset_3S”) for population genetic analyses with varying missing data thresholds, and three species-specific datasets “dataset_longipinnis”, “dataset_niveatus”, and “dataset_araguaia” used to assess genetic diversity and population structure.
SNP Filtering and neutral dataset. We performed prefiltering of only missing data as a first step to verify the consistency of the morphological classification of the species. For this characterization of genetic structure, we assumed a varying percentage of missing data (per loci). Thus, we created a dataset with four missing data levels (“NoMissD” is an unfiltered dataset, whereas “20MissD”, 30MissD, and “40MissD” all correspond to the percentage of missing data of 20, 30, and 40%, respectively) from the complete dataset (“dataset_3S”: data including samples of all species) using the “max.missing” function from R package r2vcftools (see below). Additionally, we also performed quality control on the missing dataset, filtering loci for read depth (3–100). The large-scale genomic datasets and our population genetic inferences consistently suggest that the sampled specimens belong to three genetic clusters (Fig. 2). Based on the information gathered and stability of the individual’s ancestry in the population genetic inference, we opted for a percentage of 40% data missing for subsequent analyses.

FIGURE 2| Scatterplots showing the relationship between genetic (Provesti’s distance) and geographic (riverine) distances, with two-dimensional kernel density overlays (color gradient from low: blue, to high: red). The black dashed line indicates linear regression, with 95% confidence intervals in gray. Adjusted R² and p-values are shown for each panel. Plots: (A) Baryancistrus longipinnis and (B) B. niveatus (all samples); (C) B. longipinnis (Region 1); (D) B. niveatus (Region 2); (E) B. longipinnis (Region 2). Samples from Porto Franco and Peixe were excluded due to their geographic isolation, which could bias riverine distance-based estimates.
We used a wrapper for VCFtools (Danecek et al., 2011) implemented in the package r2vcftools in R v. 4.2.1 to perform final quality control on genomic data. Therefore, to obtain a subset of neutral and independent loci, individual datasets for each species (“dataset_longipinnis”, “dataset_niveatus” and “dataset_araguaia”) were filtered by retaining SNPs with read depth (3–100) and linkage disequilibrium (LD, r2 <0.8). Loci showing strong deviations from Hardy Weinberg equilibrium (HWE, p <0.0001) as well as loci with more than 40% missing data and genotypes with more than 75% missing data, were excluded. In addition, we removed any potentially selected loci based on genome scans. We evaluated population structure using the snmf function from the R package LEA (Frichot, François, 2015). False discovery rates were controlled by adjusting p-values with the genomic inflation factor (λ) and setting false discovery rates to q = 0.05 using the Benjamini-Hochberg algorithm (François et al., 2016). Genome scans were not applied to the species B. niveatus and Baryancistrus sp. “Araguaia” due to the limited number of individuals sampled. The resulting neutral dataset for each species was then used for downstream population genomic analyses. Futher details on the filtering schema applied to the ddRADseq dataset are available in Tab. S2.
Genetic diversity and population structure. We assessed population structure by two complementary genetic clustering approaches: i) sparse nonnegative matrix factorization (sNMF) implemented in the snmf function from the R package LEA, which provides least-squares estimates of ancestry proportions (Frichot, François, 2015); and ii) discriminant analysis of principal components (DAPC) from the R package adegenet, which identifies and describes groups of genetically related individuals using a discriminant function analysis (DFA) with principal components (PC) (Jombart et al., 2010). For both assumption-free methods, we tested the number of ancestral populations (k) varying between 1 and 10. For sNMF, the best k was chosen based on cross-entropy (Frichot et al., 2014).
Based on the genetic cluster assigned by the sNMF approach, population genetic parameters were estimated. We calculated the observed heterozygosity (HO), expected heterozygosity (HE), and inbreeding coefficient (F) at the individual and population levels and nucleotide diversity (π: mean per-site nucleotide diversity) at the population level only. These indices of genetic diversity and their confidence intervals (C.I. 95%) were calculated with the query function using the “het” option in VCFtools (Danecek et al., 2011) implemented in the r2vcftools package. Additionally, we used r2vcftools in R to compute a genome‐wide estimate of Tajima’s D and perform a simulation from the neutral model to correct for bias due to the minor-allele-frequency filter (MAF >0.03) with confidence intervals (C.I. 95% by using 10,000 bootstrap replicates).
Landscape genetics. To assess how landscape predictors influence genetic differentiation, both individually and in combination, we applied Mixed-Effects Models with a Pairwise Landscape (MLPE) structure, using Prevosti’s inter-individual genetic distance as the response variable. Predictors were included as fixed effects, and source and destination populations as random effects to account for the non-independence of pairwise data. Riverine distance was used as the primary geographic metric, as it better reflects movement in aquatic systems.
Separate MLPE models were constructed for each species (B. longipinnis, B. niveatus) and region (1 and 2), including single and combined predictors. To disentangle spatial and environmental effects, we explicitly modeled Isolation by Environment (IBE) using uncorrelated variables, isolating ecological heterogeneity from geographic distance.
Predictors included:
1. Isolation by Distance (IBD): riverine distances were computed using the riverdist package (Tyers, 2024) and the HydroRIVERS v. 1.0 dataset (Lehner, Grill, 2013). The shapefile was clipped to the study area, reprojected (UTM Zone 22S; EPSG:32722), and converted to a linear network using line2network(). Sampling points were snapped to the nearest river segment with xy2segvert() (200 m tolerance), and pairwise distances were calculated with riverdistancemat().
2. Isolation by Environment (IBE): bioclimatic variables (WorldClim) were extracted and subjected to species-specific PCA. Environmental distances were computed from the scores of the first three principal components using the dist function from the ade4 package.
3. Riparian Habitat (HabitatRip): derived from MapBiomas land cover data (Collection 9; 1985 and 2020). The optimal buffer size (1,000–3,000 m) was selected based on AICc.
4. Water Surface Temperature (WST): extracted from Landsat 8 thermal imagery (ST_B10; 30 m), atmospherically corrected (Level-2) and downloaded from Earth Explorer.
5. Normalized Difference Turbidity Index (NDTI): calculated from Sentinel-2 Level-2A reflectance data using green and red bands (10 m). Images were selected based on low cloud cover and temporal proximity to sampling.
6. Altitude (Alt).
7. Slope: derived from 30 m-resolution DEMs (Earth Explorer – https://earthexplorer.usgs.gov/) using the terrain() function in the raster package. All point-based predictors (WST, NDTI, Alt, Slope, and initial IBE) were reprojected to UTM and extracted from 100 m buffers around randomly jittered coordinates (±500 m). Values were z-score standardized (raster, terra). Multicollinearity was assessed using Variance Inflation Factors (VIF), with iterative removal of variables with VIF >5. MLPE models combining multiple predictors (e.g., IBE, WST, NDTI, Alt, HabitatRip, and IBD) were also constructed and compared using AICc. Additional information of methodological approaches taken in this study are available on supplementary material S3.
Habitat cover and genetic diversity. We estimated individual genetic diversity metrics (expected heterozygosity – HE, and inbreeding coefficient – F) from RAD-seq-derived SNPs using the “—het” function in VCFtools (Danecek et al., 2011).
Habitat metrics were derived from MapBiomas land cover maps (1985 and 2020; 30 m resolution), clipped to a 30 km buffer and reprojected to UTM. Land cover classes were reclassified into natural vegetation (1) and anthropogenic cover (0), allowing us to compute: (1) historical habitat amount (1985), (2) current habitat amount (2020), and (3) habitat loss (1985–2020 difference). Metrics were calculated across multiple spatial scales (1–5 km and 10–20 km buffers), following a multiscale framework.
Linear mixed-effects models (LMMs) were fitted using the “nlme” package (Pinheiro et al., 2025), with HE (logit-transformed) or F as response variables. Sampling locality was included as a random effect, and habitat metrics as fixed effects. Model selection was based on AICc, ∆AICc, and Akaike weights (MuMIn::aictab) (Bartoń, 2015). Likelihood Ratio Tests (LRTs) assessed predictor significance. Model validation included residual plots, autocorrelation checks, and Shapiro-Wilk normality tests.
Results
ddRADseq data and neutral SNPs. The ddRAD sequencing generated a total of 47,584,483 raw reads, with per-sample read counts ranging from 699,558 to 3,106,590 (Tab. S4). After initial quality filtering during bioinformatic processing, 39,869,024 reads were retained, representing an average of 83.79% of the raw data (ranging from 320,057 to 2,730,977 reads per sample). A de novo assembly-based alignment (variant calling) across all species yielded a total of 25,676 SNPs. The resulting final species-specific datasets contained 2,758 SNPs for B. longipinnis, 5,040 for B. niveatus, and 3,508 for Baryancistrus sp. “Araguaia”. Based on these final datasets, the sample size sufficiency analysis indicated that our sampling effort was adequate to accurately estimate genetic diversity and population parameters for both B. longipinnis and B. niveatus (Fig. S5). The ddRAD sequencing generated in this study and the corresponding VCF files are available on https://doi.org/10.5281/zenodo.16970398.
Genetic diversity and population structure. Preliminary ancestry assignments revealed mismatches between the initial morphological identifications and the genomic clusters (Fig. S6). Additional morphological investigations supported this genomic reclassification; although the principal component analysis (PCA) of size-standardized variables did not show complete separation, specific traits such as relative lower lip width and dentary length exhibited significant differences (Fig. S6). Following this dataset refinement, both sNMF and DAPC revealed a single genetic cluster per species (Fig. S7). For sNMF, the lowest cross-entropy supported K = 1 (0.096 for B. longipinnis and 0.027 for B. niveatus). DAPC also supported K = 1 based on the lowest Bayesian information criterion (BIC) (74.2 for B. longipinnis, 34.2 for B. niveatus). The highest heterozygosity values were observed in Baryancistrus sp. “Araguaia” (HO = 0.73 (0.60–0.86); HE = 0.495 (0.497–0.503). In both B. niveatus and Baryancistrus sp. “Araguaia”, HO exceeded expected HE, resulting in significant negative inbreeding coefficients (F = -0.12 and -0.48, respectively), suggesting excess heterozygosity potentially linked to gene flow or recent demographic dynamics. In contrast, B. longipinnis showed a positive and significant inbreeding coefficient (F = 0.12), consistent with reduced genetic connectivity. Confidence intervals for F did not overlap among species, highlighting distinct demographic or evolutionary histories. All species exhibited relatively low and similar levels of nucleotide diversity (π), and positive, significant Tajima’s D values, suggesting a prevalence of intermediate-frequency alleles and a possible signal of recent population contraction or balancing selection.
Landscape genetics. Patterns of genetic differentiation varied between species and regions, with distinct landscape and environmental predictors emerging as the most supported models according to the lowest AICc values in our MLPE analyses (see Tab. S8;Figs. S7A, B). For B. longipinnis in Region 1, models including altitude, slope, riverine distance (IBD), and environmental distance (IBE) displayed similarly low AICc scores (∆AICc ≤2), reflecting comparable explanatory power. Although no single factor was predominant, these findings suggest a multifactorial influence where both geographic and environmental heterogeneity contribute moderately to genetic structure. In Region 2 of B. longipinnis, models emphasizing environmental variables, particularly local riparian habitat outperformed those based solely on geographic distance, as indicated by their superior AICc rankings (with ∆AICc ≤2 for the top models). For B. niveatus in Region 2, models incorporating fine-scale environmental factors such as turbidity and slope received the strongest support based on AICc comparisons, (with ∆AICc ≤2for the top models), (Tab. S9).
To further explore spatial genetic structure, contrasting patterns of spatial autocorrelation were detected between the species (Fig. 4). In B. longipinnis (Fig. 4A), a sharp decline in genetic relatedness was observed with increasing riverine distance, a pattern consistent with isolation by distance (IBD). In contrast, B. niveatus (Fig. 4B) showed no such directional trend, suggesting the absence of spatial genetic structure. Kernel density analysis revealed that B. longipinnis has a fragmented genetic pattern, while B. niveatus has a broad and continuous distribution. When analyzing the combined R1 and R2 reaches (global scale), a significant correlation was found between genetic and riverine distance for B. longipinnis (R² = 0.033, p < 0.01, Fig. 2A), but no such relationship was found for B. niveatus (R² = -0.009, p = 0.595, Fig. 2B). In contrast, at the regional level (i.e., analyzing R1 and R2 separately), this correlation was not significant for either species (Figs. 2C–E). Monmonier’s algorithm did not detect genetic barriers among sampled habitats (Fig. S9). We also compared geographic distance metrics by testing isolation by distance (IBD) using both Euclidean and riverine distances across MLPE and Mantel frameworks. Riverine distance consistently resulted in lower AICc values in MLPE models, supporting its use as the most appropriate spatial metric for subsequent landscape genetics analyses (Tab. S10).
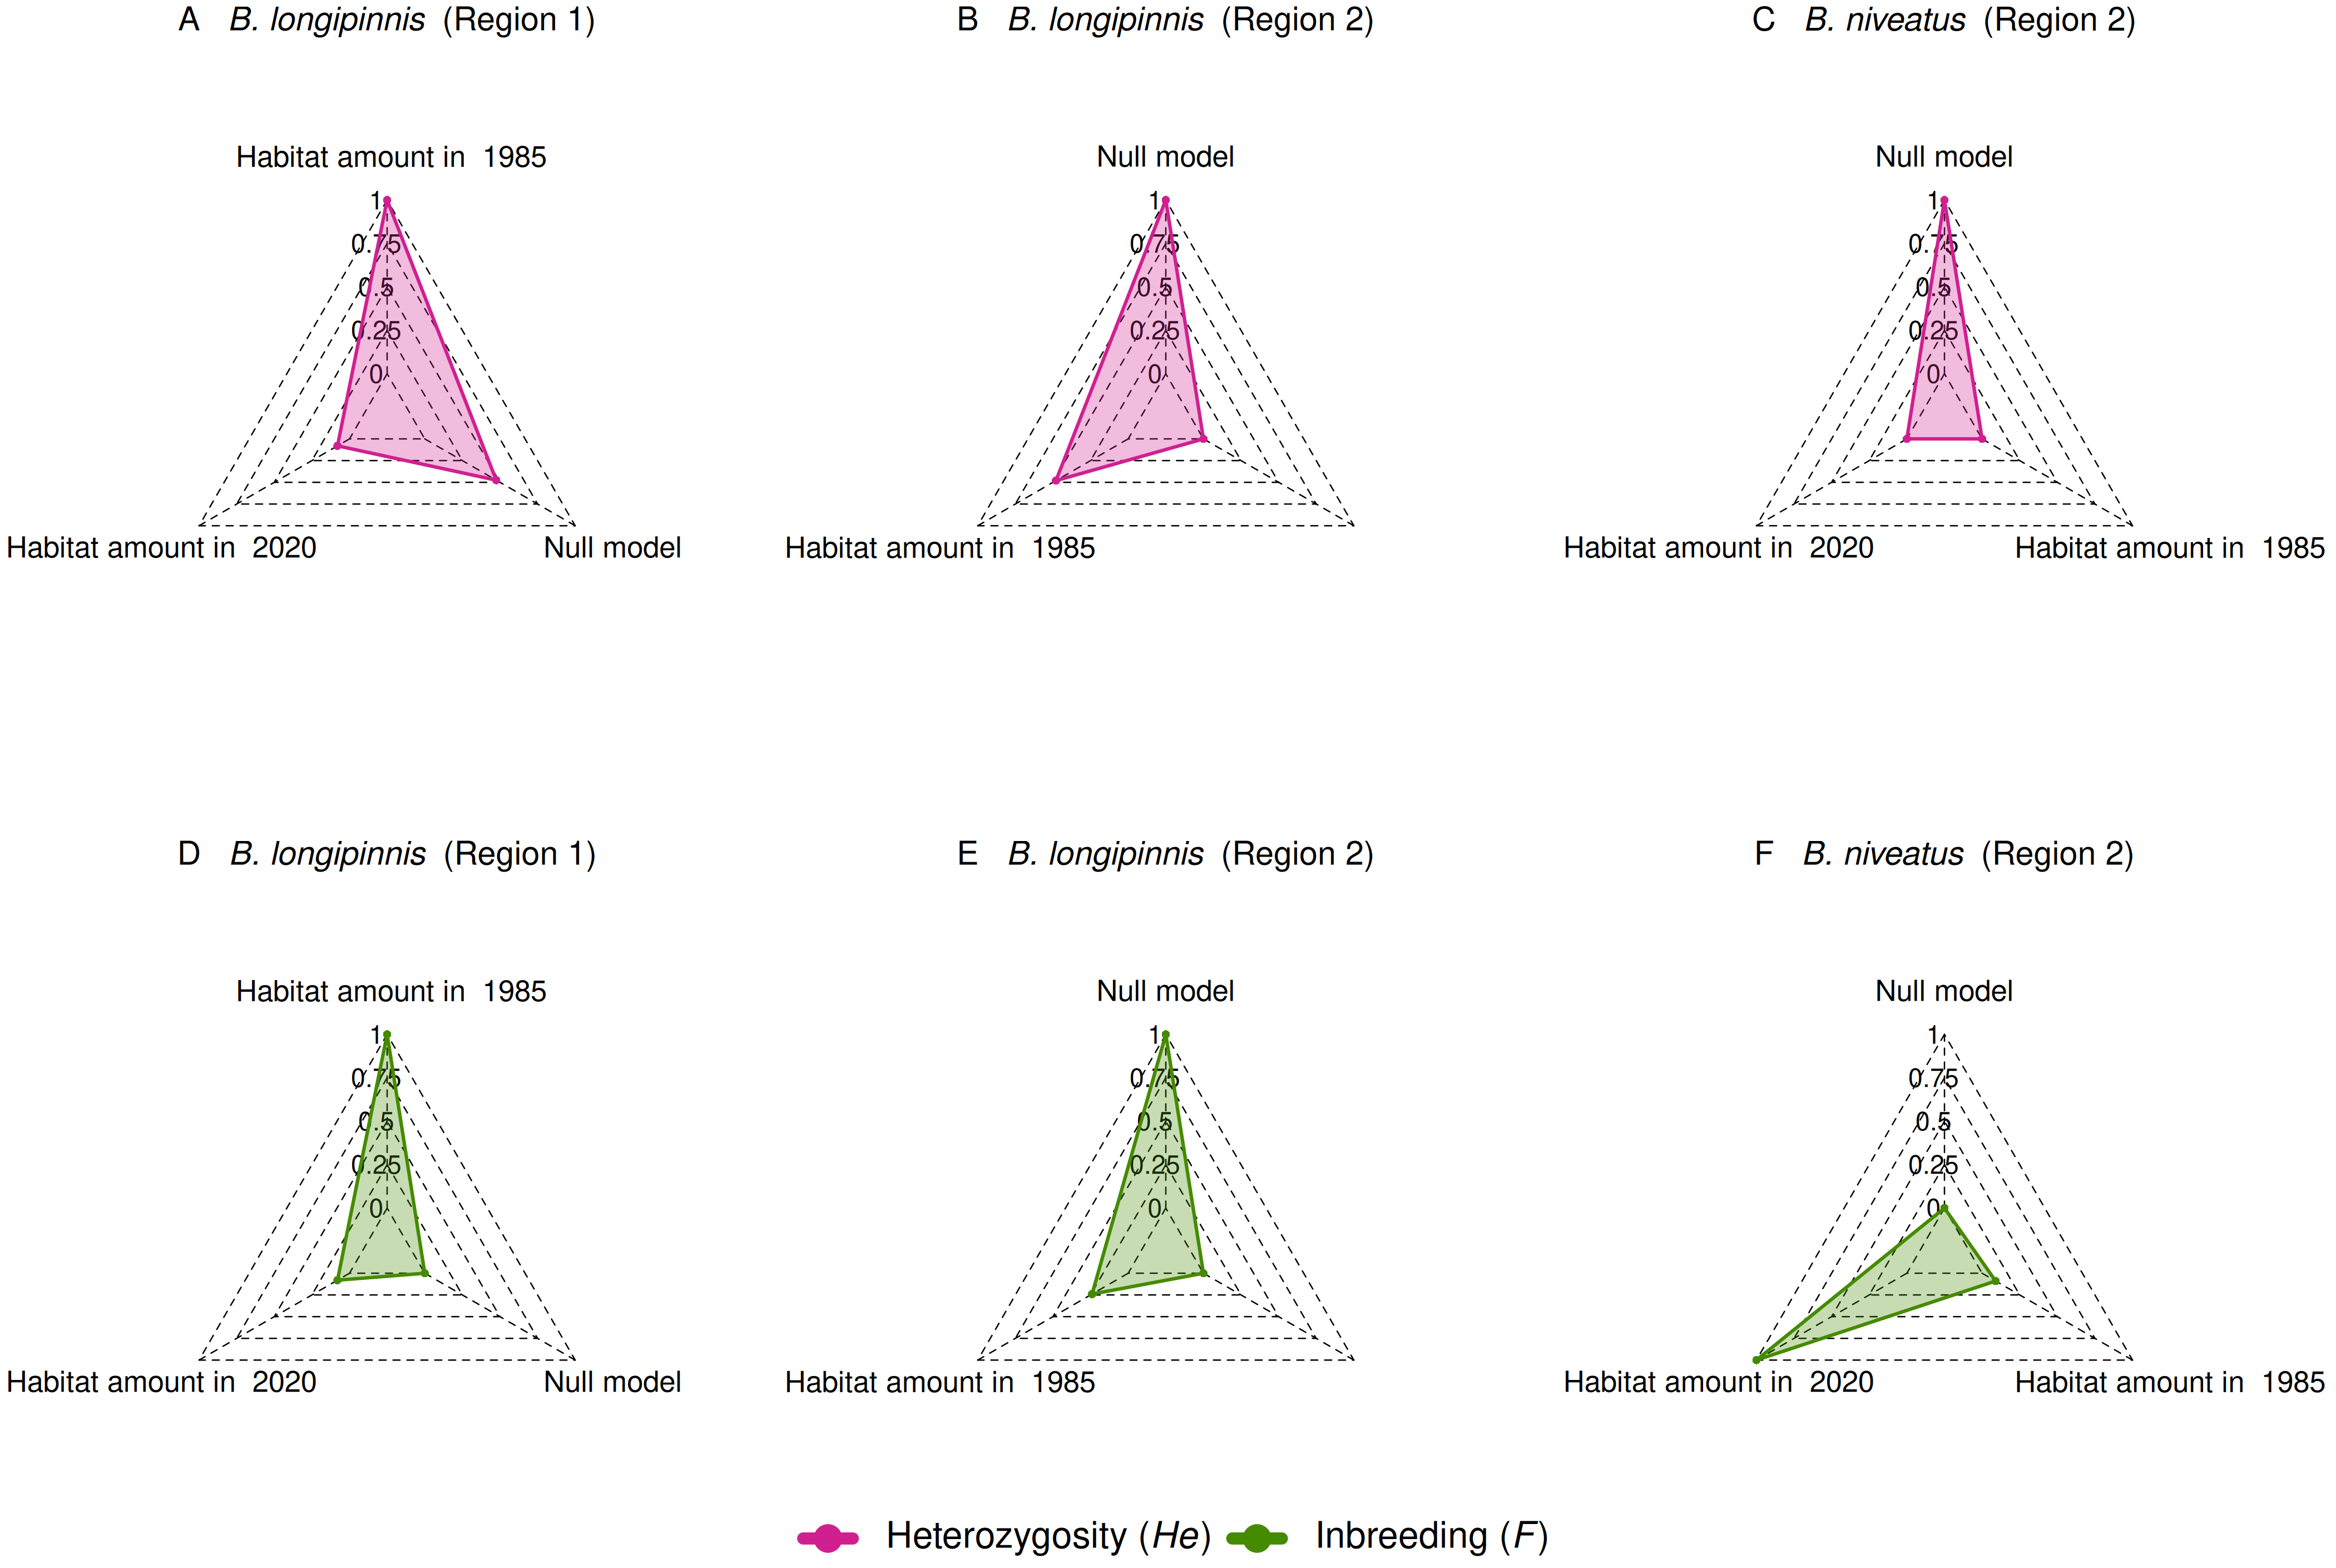
FIGURE 3| Model support (normalized ∆AICc) for habitat amount (1985 and 2020) influencing individual-level genetic diversity metrics, Heterozygosity (He) and Inbreeding (F), in Baryancistrus longipinnis and B. niveatus across regions, based on the set of best-fitting models (∆AICc ≤2). The top row of panels (A–C) displays Heterozygosity (He), while the bottom row (D–F) displays Inbreeding (F). Columns represent, from left to right, B. longipinnis in Region 1, B. longipinnis in Region 2, and B. niveatus in Region 2, respectively, as indicated in the panel titles. Models incorporating habitat loss were also evaluated but did not fall within this set of best-fitting models.
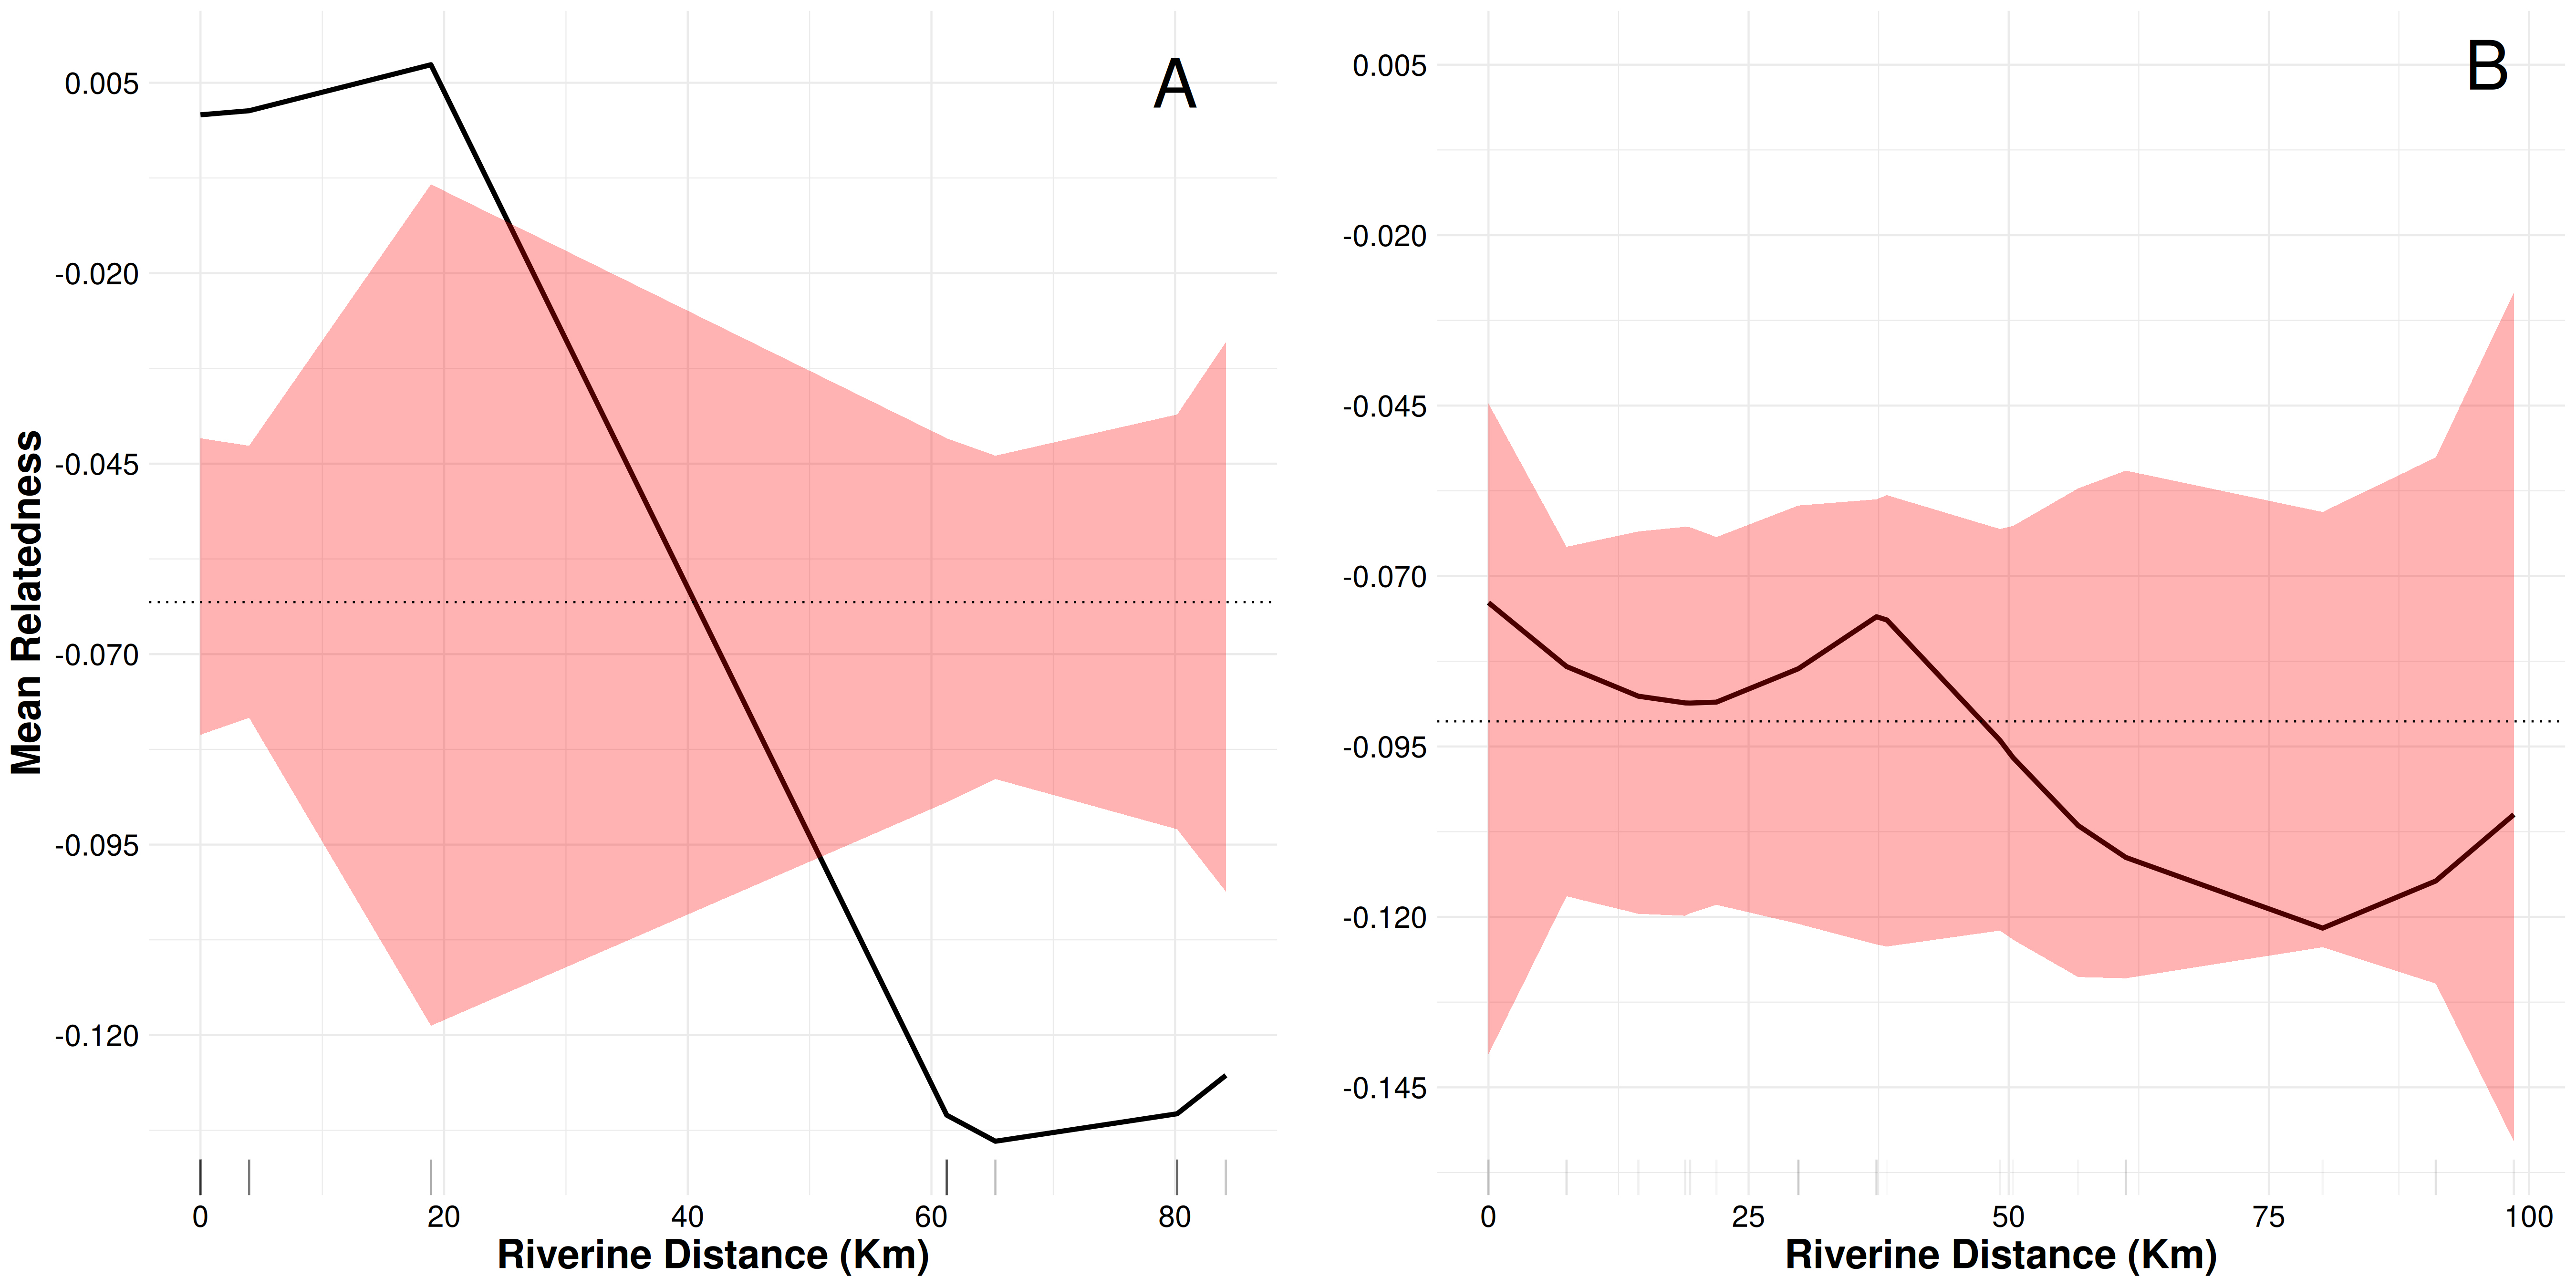
FIGURE 4| Spatial autocorrelation of Baryancistrus longipinnis (A) and B. niveatus (B) species. The black solid line is the LOESS adjusted for the genetic relatedness statistic Aij (i and iii, Yang et al., 2010). The red-shaded regions are 95% confidence limits around the null expectation (black dotted line). Short vertical lines along the xaxis represent pairwise riverine distances between individuals. Samples from Porto Franco and Peixe were excluded from the analysis due to their large geographic separation from Regions 1 and 2, which could bias spatial structure estimates based on riverine connectivity.
Habitat cover and genetic diversity. Linear Mixed-Effects Models (LMMs) revealed that habitat amount, both historical (1985) and current (2020), influences genetic diversity metrics differently across species, regions, and spatial scales (Figs. 3, S11). For B. longipinnis in Region 1, historical habitat amount at a broad scale (20 km) was a strong predictor of expected heterozygosity (HE), with current habitat at a finer scale (3 km) also showing relevance. Inbreeding coefficient (F) was influenced by both historical and current habitat amounts at the broad scale and current habitat at the fine scale, reflecting multiscale effects of habitat alterations on inbreeding indexes (Tab. 2). In contrast, for B. longipinnis in Region 2, null models best explained variation in He and F, suggesting minimal habitat impact on genetic diversity in this region. Similarly, for B. niveatus in Region 2, He was best explained by null models, whereas F was significantly predicted by current habitat amount10 at a fine scale (2 km) and historical habitat at a broad scale (20 km). This indicates that localized and historical habitat patterns influence inbreeding but have less effect on heterozygosity. Overall, historical and current habitat amounts significantly predict inbreeding coefficients across species and regions, while HE exhibits weaker and less consistent associations. These findings underscore the importance of incorporating temporal and spatial habitat dynamics into conservation strategies aimed at maintaining genetic diversity (Tab. S12). Additional Information on Results are available on S13.
TABLE 2 | MLPE Model Selection for B. longipinnis and B. niveatus in Regions 1 and 2. Models with ∆AICc ≤ 2 are ranked from lowest to highest AICc. Provesti’s inter-individual genetic distance was modeled against fluvial distance (IBD), environmental distance (IBE), and single-factor landscape predictors (Altitude, Slope, HabitatRip, NDTI and WST). a Predictor abbreviations and ecological interpretation: IBD = Isolation by distance (riverine distance between sampling points); IBE = Isolation by environment (Euclidean distances based on PCA of 19 bioclimatic variables); Slope = Terrain slope (steepness in degrees); RipHab = Riparian habitat amount, calculated as the difference between natural and anthropogenic land cover within a buffer (1,500 m for B. longipinnis and 3,000 m for B. niveatus) around riparian zones; NDTI = Normalized Difference Turbidity Index, used as a proxy for sediment load or water turbidity; and WST: Water Surface Temperature. Significance levels: Statistical significance of each predictor is indicated by asterisks based on t-tests from the fixed effects of the linear mixed models: p < 0.05 (*), p < 0.01 (**), and p < 0.001 (***).
Species | Region | Predictor a | logLik | AICc | ΔAIC | AICc Weight |
B. longipinnis | Region 1 | HabitatRip (1500m) | 340.17 | -669.73 | 0.00 | 0.20 |
Altitude | 340.16 | -669.71 | 0.02 | 0.20 | ||
IBD | 340.05 | -669.49 | 0.24 | 0.18 | ||
IBE | 339.89 | -669.17 | 0.57 | 0.15 | ||
Slope | 339.89 | -669.17 | 0.57 | 0.15 | ||
Region 2 | HabitatRip (1500m) | 91.66 | -171.33 | 0.00 | 0.23 | |
IBE | 91.61 | -171.23 | 0.10 | 0.22 | ||
IBD | 91.50 | -171.00 | 0.32 | 0.20 | ||
Altitude | 90.83 | -169.66 | 1.66 | 0.10 | ||
WST | 90.68 | -169.36 | 1.96 | 0.09 | ||
B. niveatus | Region 2 | NDTI | 237.69 | -464.15 | 0.00 | 0.29 |
Slope | 237.45 | -463.68 | 0.47 | 0.23 | ||
HabitatRip (3000m) | 237.18 | -463.13 | 1.02 | 0.17 |
Discussion
Population genomics and contrasting genetic structure in sympatric armored catfish species. Here, we present the first comprehensive population genomics investigation of three sympatric armored catfish species from the genus Baryancistrus. Based on high-resolution genomic datasets comprising thousands of SNPs, our study aimed to explore how historical and current landscape-scale environmental gradients shape patterns of genetic diversity and spatial structure among these species. This investigation revealed contrasting patterns of genetic structure that are likely shaped by distinct species-specific responses to the riverine landscape. The strong isolation by distance (IBD) detected in B. longipinnis, for example, highlights effective short-distance dispersal limitations and limited gene flow across the river system, a pattern often obscured by less powerful molecular markers (Skey et al., 2023) but clearly visible with our genomic data. In contrast, the lack of IBD in B. niveatus suggests higher dispersal capabilities or more recent population connectivity across the sampled area. These findings are crucial for conservation, as they demonstrate how habitat availability and environmental gradients influence gene flow differentially among sympatric species. The spatial autocorrelation analysis confirmed these contrasting spatial genetic patterns, and clustering methods often failed to fully capture the subtle spatial restrictions observed in the IBD analysis. Additionally, Monmonier’s algorithm failed to detect clear genetic barriers, suggesting a landscape with partial permeability (Manni et al., 2004). This integrative approach, utilizing mixed linear population effects (MLPE) models with geographic and environmental variables, allowed us to disentangle the relative contributions of isolation by distance (IBD), isolation by environment (IBE), and isolation by barrier (IBB) in shaping population structure.
Large-scale population structure and homogeneity. No strong population structure was recovered across the TO-AR basin, with populations maintaining a seemingly panmictic population at a large scale, with a third undescribed species (Baryancistrus sp. “Araguaia”) included for population-level diversity metrics. These results are consistent with the outcomes of our clustering (sNMF and DAPC) (Fig. S14) and spatial autocorrelation analyses, both of which revealed weak structure and lack of well-defined genetic discontinuities across the TO-AR basin. Our results reveal lower genetic diversity in critically endangered B. longipinnis compared to B. niveatus. Overall, historical and current habitat amounts significantly predict inbreeding coefficients F across species and regions. This underscores the importance of habitat quality and environmental gradients in shaping genetic differentiation in this region.
Contrary to our initial expectations, we observed contrasting patterns of isolation by distance between the two focal species. For B. longipinnis, a weak but significant IBD pattern was detected when analyzing all individuals (Fig. 2A), suggesting that genetic differentiation is partially associated with geographic distance across the sampled rheophilic habitats. However, this relationship was not significant at the regional level (Figs. 2C, E). This is further supported by the spatial autocorrelation analysis (Fig. 4A), which revealed a sharp decline in mean relatedness with increasing riverine distance in B. longipinnis, a pattern consistent with isolation by distance (IBD). In contrast, B. niveatus showed no evidence of IBD at either the macro or regional scale (Figs. 2B, D), suggesting that genetic differentiation is not associated with riverine distance in this species. This genetic homogeneity may reflect the species’ restricted distribution, as our sampling likely encompasses most or all of its range, potentially capturing a single genetic stock. The absence of a clear directional trend in B. niveatus corroborates the lack of spatial genetic structure. Despite both species occupying rheophilic habitats fragmented along the TO-AR basin, gene flow appears to be limited by distance in B. longipinnis, whereas B. niveatus shows signs of high genetic connectivity. These findings differ from patterns observed in other rheophilic species, such as cichlids and anostomids (Hrbek et al., 2018), where isolated habitat patches led to strong population structuring. In our study, the disjunct distribution of rheophilic habitats does not seem to universally restrict gene flow among loricariid species, suggesting species-specific responses to geographic isolation. These IBD patterns were assessed using both riverine and Euclidean distance matrices, providing a hydrologically realistic framework for rheophilic taxa.
Fine-scale genetic divergence and environmental drivers. Our data showed a patchy pattern in B. longipinnis and B. niveatus, which aligns with their adaptation to fast-flowing rocky rapids. This habitat specificity confines individuals to fragmented patches, potentially leading to species-specific resistance to gene flow. Despite this habitat fragmentation, the contrasting genetic responses suggest species-specific dispersal strategies. While IBB tests failed to detect sharp genetic breaks and did not reveal significant effects of either natural (unsuitable habitat between rapids) or anthropogenic barriers (hydroelectric plants), MLPE models revealed that fine-scale environmental variables incorporating turbidity, slope, and habitat condition still accounted for subtle genetic divergence. This is exemplified by the documented contraction in the distribution area of Baryancistrus longipinnis (Chamon et al., 2022; Araújo et al., 2025), likely driven by ongoing habitat loss and degradation in lotic environments, like rapids. Loricariidae exhibit limited movement during breeding periods (Magalhães et al., 2021). The detected strong IBD in B. longipinnis, coupled with evidence of distribution contraction, suggests that this population is highly sensitive to further habitat changes. Such high sensitivity implies that the observed IBD pattern is likely not static and may fluctuate temporally in response to environmental changes (Junge et al., 2011).
Temporal scale, demographic artifacts and anthropogenic impacts. Considering our panmixia results, we understand that it is unlikely that random mating has become a genuine reflection of genetic connectivity (such as long-distance migration) driven by anthropogenic alteration. There is no evidence that habitat loss in rheophilic areas derived from hydroelectric projects is forcing fish migration in these stretches (Hrbek et al., 2018). The rheophilic habitat of Pedral do Lourenço has been characterized as the main rocky refuge for endangered species (including B. longipinnis, Chamon et al., 2022; Araújo et al., 2025), possibly due to the preservation of local diversity rather than a migratory process. Here, some elements help to weaken the hypothesis of large-scale migration driven by a hydro plant site for the focus species of this study: i) the generational time of the Baryancistrus genus is approximately 11 years, and longevity is approximately 20 years according to Instituto Chico Mendes de Conservação da Biodiversidade (2018); however, through field observations and A. Akama, pers. obs., it is believed that the generational time of Plecos of the genus Baryancistrus is greater than 18 years, while the construction of large and small hydro plant sites has been taking place in the TO-AR basin for over four decades. Nevertheless, approximately 60% of the 73 hydroelectric plants in operation along the basin have started operating in the last 20 years (Akama, 2017; Chamon et al., 2022). Thus, the longevity time lag between habitat loss and patterns of genetic differentiation is still noticeably short (~1.8 generations), according to Coleman et al. (2018). The seemingly genetic homogeneity in certain regions may therefore be an artifact of demographic history (such as a recent population expansion), rather than indicative of significant contemporary connectivity. ii) The impact of hydro plant sites seems to significantly influence allele frequencies (leading to differentiated populations) in nonimmigrant and/or highly restricted species (Dehais et al., 2010; Coleman et al., 2018) or in long-distance migratory species (Alho et al., 2015). Therefore, contrary to connectivity, the impact generated by damming could not lead gene flow to override the genetic drift of these specialized species adapted to rheophilic environments.
Our results show positive Tajima’s D-values across all species analyzed, suggesting either balancing selection or an ongoing population contraction (Simonsen et al., 1995). Genome-wide Tajima’s D values, calculated per species and across sliding windows and corrected for MAF bias, support this interpretation by revealing consistent positive values across all three species. The latter scenario aligns with the substantial expansion of hydroelectric projects and increased land use throughout the TO-AR basin. These anthropogenic pressures represent the principal threats to the ichthyofauna in the region, impacting over 80% of the basin’s endangered fish species (Chamon et al., 2022; Araújo et al., 2025). The loss of rheophilic habitats seems to lead to a significant population reduction in its specialized species (Hrbek et al., 2018; Chamon et al., 2022), compromising long-term population viability (Ribolli et al., 2021) and morphological variation due to permanent habitat alterations (Radojković et al., 2018).
Genetic erosion and conservation measures. In B. longipinnis, our results reveal significant inbreeding that is strongly associated with habitat loss. These patterns are consistent with the reduced diversity indices observed in areas subject to intense anthropogenic pressures (Fig. S11; Tab. S4), particularly Region 1. Linear Mixed-Effects Models further support these findings, revealing significant associations between current and historical habitat amount and individual inbreeding levels F, particularly in Region 1. These patterns were robustly captured using MLPE models that accounted for the non-independence of pairwise comparisons and spatial autocorrelation. The significant level of inbreeding (F values) in this species likely reflect ongoing genetic erosion, potentially driven by reduced effective population size, habitat fragmentation, and disrupted gene flow (Bosse, van Loon, 2022; Pinto et al., 2024; Osborne et al., 2024). From an evolutionary perspective, such inbreeding can increase homozygosity and reduce adaptive potential, thereby exacerbating extinction risk in small, isolated populations. Conversely, in B. niveatus, diversity indices (HO and HE) suggest a more pronounced loss of genetic variability in areas affected by pasture expansion and/or agricultural activities than by fragmentation from hydroelectric plants. These results emphasize the need to incorporate temporal and spatial habitat dynamics into conservation strategies aimed at maintaining genetic diversity.
The complex evolutionary history of the Amazon basin, including climatic fluctuations and river system dynamics, has strongly influenced genetic diversity patterns in rheophilic fishes (Cassemiro et al., 2023). Species-specific biological traits and ecological specialization to fast-flowing rocky habitats further shape these patterns (Dagosta et al., 2018; Gehri et al., 2021). While our study focused primarily on neutral genetic variation, genetic differentiation is expected to accumulate more rapidly in genomic regions under selection, whereas neutral regions reflect genetic drift over longer timescales (Kavalco et al., 2005; Beheregaray et al., 2015). Incorporating adaptive genetic markers in future research could thus provide deeper insights into how environmental heterogeneity, such as hydrochemistry and habitat structure, drives local adaptation and population differentiation in these species (Cooke et al., 2012; Stoffers et al., 2022). Our landscape genetics models (MLPE) revealed that environmental predictors such as turbidity (NDTI), riparian vegetation, slope, and altitude contributed differentially to genetic differentiation, particularly in B. niveatus, where fine-scale ecological variables outperformed geographic distance. These results underscore the importance of habitat quality and environmental gradients in shaping genetic differentiation in this region, highlighting their role as key drivers of genetic structure within complex aquatic habitats areas characterized by pronounced spatial heterogeneity and dynamic physicochemical factors. Our filtering approach (MAF and LD pruning) ensured that population structure was assessed using neutral markers, reducing confounding effects of selection. Understanding the natural history of rheophilic Loricariidae and identifying adaptive loci linked to their specialized rocky rapid habitats are essential steps for clarifying the ecological and evolutionary factors shaping their genetic structure.
Despite the lack of strong population structure on a large scale, our fine-scale analyses (e.g., spatial autocorrelation and genetic diversity estimates) revealed subtle signals of restricted gene flow and clues of reduced effective population sizes in the species investigated, particularly in B. longipinnis. These patterns are likely associated with historical and ongoing habitat degradation. Remarkably, even with limited sample number per site, the high-resolution SNP dataset enabled us to uncover robust patterns of diversity, inbreeding, and landscape genetic structure. Recent research supports the use of genomic tools for conservation, even under sample size constraints, especially when thousands of loci are available (Hale et al., 2012; Nazareno et al., 2017). The incorporation of adaptive filtering (neutral SNPs and LD pruning) allowed robust inference of population structure and landscape influences. This reinforces the utility of population genomics as a key instrument for evaluating genetic erosion, local adaptation, and spatial connectivity in understudied Neotropical taxa, particularly those threatened by anthropogenic pressures.
Based on our findings, we can propose effective conservation measures aimed at mitigating the impacts currently underway against these species and thus ensuring their population viability in the short, medium, and long term. Our predictions were corroborated, indicating considerable levels of inbreeding and robust spatial genetic structuring in critically endangered B. longipinnis. Therefore, the narrowly distributed B. longipinnis is likely prone to extinction due to its high levels of closely related breeding pattern and range contraction (Araújo et al., 2025). Pedral do Lourenço (Marabá municipality, PA), the last refuge for B. longipinnis, is at risk of disappearing due to plans to implement a waterway for commodities transport across the Tocantins river in vessels (CONAB, 2021; MMA, 2022; Araújo et al., 2025). Given this fact, any conservation management action for this species may become unfeasible, putting at risk at least other five endangered species that use the rocky refuge of this habitat (Chamon et al., 2022). Thus, we expressly suggest, as a short-term measure, the preservation of the rapids Pedral do Lourenço, designating this stretch of the TO-AR basin as an area of permanent protection (APP).
Despite the lack of strong population structure on a large scale, our fine-scale analyses (e.g., spatial autocorrelation and genetic diversity estimates) revealed subtle signals of restricted gene flow and increased inbreeding in the species investigated, particularly in B. longipinnis. These patterns are likely associated with historical and ongoing habitat degradation. Remarkably, even with limited sample sizes per site, the high-resolution SNP dataset enabled us to uncover robust patterns of diversity, inbreeding, and landscape genetic structure. Recent research supports the use of genomic tools for conservation, even under sample size constraints, especially when thousands of loci are available (Hale et al., 2012; Nazareno et al., 2017). The application of neutral and independent SNPs allowed robust inference of population structure and landscape influences. This reinforces the utility of population genomics as a key instrument for evaluating genetic erosion, local adaptation, and spatial connectivity in understudied Neotropical taxa, particularly those threatened by anthropogenic pressures.
Acknowledgments
We gratefully acknowledge the Laboratório de Biologia Molecular do Museu Paraense Emílio Goeldi for providing essential infrastructure that enabled the generation of genomic data. We also thank the Laboratório de Biologia e Genética de Peixes at the UNESP-Botucatu for their valuable support in sample sequencing, and all those who contributed directly or indirectly to this study.
References
Akama A. Impacts of the hydroelectric power generation over the fish fauna of the Tocantins River, Brazil: Marabá dam, the final blow. Oecol Austr. 2017; 21(3):222–31. https://doi.org/10.4257/oeco.2017.2103.01
Alho CJR, Reis RE, Aquino PPU. Amazonian freshwater habitats experiencing environmental and socioeconomic threats affecting subsistence fisheries. Ambio. 2015; 44(5):412–25. https://doi.org/10.1007/s13280-014-0610-z
Allen GH, Pavelsky TM. Global extent of rivers and streams. Science. 2018; 361(6402):585–88. https://doi.org/10.1126/science.aat0636
Allendorf FW, Hohenlohe PA, Luikart G. Genomics and the future of conservation genetics. Nature Rev Genet. 2010; 11:697–709. https://doi.org/10.1038/nrg2844
Allendorf FW, Luikart G, Aitken SN, Antunes A. Conservation and the genetics of populations, 2nd ed. John Wiley & Sons, Hoboken; 2013.
Arantes CC, Fitzgerald DB, Hoeinghaus DJ, Winemiller KO. Impacts of hydroelectric dams on fishes and fisheries in tropical rivers through the lens of functional traits. Curr Opi Environ Sustain. 2019; 37:28–40. https://doi.org/10.1016/j.cosust.2019.04.009
Araújo ES, Marques EE, Freitas IS, Neuberger AL, Fernandes R, Pelicice FM. Changes in distance decay relationships after river regulation: similarity among fish assemblages in a large Amazonian river. Ecol Freshw Fish. 2013; 22(4):543–52.https://doi.org/10.1111/eff.12054
Araújo FAA, Monteiro ILP, Lobato LJ, Leão RR, Duarte AC, Leonardo MG et al. An exploratory survey of fish species inhabiting rapids from the Tocantins-Araguaia River basin: perspectives on species diversity and conservation. Biota Neotrop. 2025; 25(1):e20241682. https://doi.org/10.1590/1676-0611-BN-2024-1682
Barbarossa V, Schimitt RJP, Huijbregts MAJ, Schipper AM. Impacts of current and future large dams on the geographic range connectivity of freshwater fish worldwide. PNAS. 2020; 117(7):3648–55. https://doi.org/10.1073/pnas.1912776117
Bartoń K. MuMIn: Multi-Model Inference. 2015. https://doi.org/10.32614/CRAN.package.MuMIn
Beheregaray LB, Cooke GM, Chao NL, Landguth EL. Ecological speciation in the tropics: insights from comparative genetic studies in Amazonia. Front Genet. 2015; 5:477. https://doi.org/10.3389/fgene.2014.00477
Bolger AM, Lohse M, Usadel B. Trimmomatic: a flexible trimmer for Illumina sequence data. Bioinformatics. 2014; 30(15):2114–20. https://doi.org/10.1093/bioinformatics/btu170
Borzone Mas D, Alvarenga PF, Scarabotti PA. Ecological and phylogenetic determinants of life-history patterns among ten loricariid species. J Fish Biol. 2019; 95(5):1298–310. https://doi.org/10.1111/jfb.14131
Bosse M, van Loon S. Challenges in quantifying genome erosion for conservation. Evol Applicat. 2022; 16:1071–83. https://doi.org/10.3389/fgene.2022.960958
Campos M, Conn JE, Alonso DP, Vinetz JM, Emerson KJ, Ribolla PEM. Microgeographical structure in the major Neotropical malaria vector Anopheles darlingi using microsatellites and SNP markers. Parasit Vectors. 2017; 10:76. https://doi.org/10.1186/s13071-017-2014-y
Cassemiro FAS, Albert JS, Antonelli A, Menegotto A, Wüest RO, Cerezer F et al. Landscape dynamics and diversification of the megadiverse South American freshwater fish fauna. PNAS. 2023; 120(2):e2211974120. https://doi.org/10.1073/pnas.2211974120
Catchen JM, Amores A, Hohenlohe P, Cresko WA, Postlethwait JH. Stacks: building and genotyping loci de novo from short-read sequences. G3. 2011; 1(3):171–82. https://doi.org/10.1534/g3.111.000240
Catchen J, Hohenlohe PA, Bassham S, Amores A, Cresko WA. Stacks: an analysis tool set for population genomics. Mol Ecol. 2013; 22(11):3124–40. https://doi.org/10.1111/mec.12354
Chamon CC, Serra JP, Camelier P, Zanata AM, Fichberg I, Marinho MMF.Building knowledge to save species: 20 years of ichthyological studies in the Tocantins-Araguaia River basin. Biota Neotrop. 2022; 22(2):e20211296. https://doi.org/10.1590/1676-0611-bn-2021-1296
Closs GP, Krkosek M, Olden JD, editors. Conservation of freshwater fishes. 1st ed. Cambridge: University Press; 2015.
Coleman RA, Gauffre B, Pavlova A, Beheregaray LB, Kearns J, Lyon J et al. Artificial barriers prevent genetic recovery of small isolated populations of a low-mobility freshwater fish. Heredity. 2018; 120:515–32. https://doi.org/10.1038/s41437-017-0008-3
Companhia Nacional de Abastecimento (CONAB). Perdas em transporte e armazenagem de grãos: panorama atual e perspectivas [Internet]. Brasília; 2021. Available from: https://www.conab.gov.br/outraspublicacoes/item/download/35953_e93eba0ef12529526cef749f8d465f7b
Cooke GM, Chao NL, Beheregaray LB. Natural selection in the water: freshwater invasion and adaptation by water color in the Amazonian pufferfish. J Evol Biol. 2012; 25(7):1305–20. https://doi.org/10.1111/j.1420-9101.2012.02514.x
Dagosta FCP, de Pinna MCC. A history of the biogeography of Amazonian fishes. Neotrop Ichthyol. 2018; 16(3):e180023. https://doi.org/10.1590/1982-0224-20180023
Danecek P, Auton A, Abecasis, Albers CA, Banks E, DePristo MA G et al. The variant call format and VCFtools. Bioinformatics. 2011; 27(15):2156–58. https://doi.org/10.1093/bioinformatics/btr330
Dehais C, Eudeline R, Berrebi P, Argillier C. Microgeographic genetic isolation in chub (Cyprinidae: Squalius cephalus) population of the Durance River: estimating fragmentation by dams: genetic isolation in chub. Ecol Freshw Fish. 2010; 19(2):267–78. https://doi.org/10.1111/j.1600-0633.2010.00411.x
Díaz S, Settle J, Agard HTJ, Arneth J, Balvanera P, Brauman K et al.Pervasive human-driven decline of life on Earth points to the need for transformative change. Science. 2019; 366(6471):eaax3100. https://doi.org/10.1126/science.aax3100
Flecker AS, Shi Q, Almeida RM, Angarita H, Gomes-Selman JM, García-Villacorta R et al. Reducing adverse impacts of Amazon hydropower expansion. Science. 2022; 375(6582):753–60. https://doi.org/10.1126/science.abj4017
François O, Martins H, Caye K, Schoville SD. Controlling false discoveries in genome scans for selection. Mol Ecol. 2016; 25(2):454–69. https://doi.org/10.1111/mec.13513
Frichot E, François O. LEA: an R package for landscape and ecological association studies. Methods Ecol Evol. 2015; 6(8):925–29. https://doi.org/10.1111/2041-210X.12382
Frichot E, Mathieu F, Trouillon T, Bouchard G, François O. Fast and efficient estimation of individual ancestry coefficients. Genetics. 2014; 196(4):973–83. https://doi.org/10.1534/genetics.113.160572
Gallardo B, Bogan AE, Harun S et al. Current and future effects of global change on a hotspot’s freshwater diversity. Sci Total Environ. 2018; 635:750–60. https://doi.org/10.1016/j.scitotenv.2018.04.056
Gehri RR, Gruenthal K, Larson WA. It’s complicated: heterogeneous patterns of genetic structure in five fish species from a fragmented river suggest multiple processes can drive differentiation. Evol Appl. 2021; 14(8):2079–97. https://doi.org/10.1111/eva.13268
Goulding M, Barthem R, Ferreira EJG. The Smithsonian Atlas of the Amazon. Washington, D.C.: Smithsonian Books; 2003.
Hale ML, Burg TM, Steeves TE. Sampling for microsatellite-based population genetic studies: 25 to 30 individuals per population is enough to accurately estimate allele frequencies. PLoS ONE. 2012; 7(9):e45170. https://doi.org/10.1371/journal.pone.0045170
Halsey MK, Stuhler JD, Bayona-Vásquez NJ, Plat II RN, Goetze JR, Martin RE et al. Comparison of genetic variation between rare and common congeners of Dipodomys with estimates of contemporary and historical effective population size. PLoS ONE. 2022; 17:e0274554. https://doi.org/10.1371/journal.pone.0274554
Hanski I. Habitat loss, the dynamics of biodiversity, and a perspective on conservation. Ambio. 2011; 40(3):248–55. https://doi.org/10.1007/s13280-011-0147-3
Helfman GS. Fish conservation: a guide to understanding and restoring global aquatic biodiversity and fishery resources. Washington: Island Press; 2007.
Herkenhoff ME. Perspectives of population genetics in the genetic improvement and biodiversity conservation of fish species. In: Maia RT, Felix P, Araújo MC, editors. Advances and trends in population genetics studies. London: IntechOpen; 2025. p.1–23.
Hrbek T, Meliciano NV, Zuanon J, Farias IP. Remarkable geographic structuring of rheophilic fishes of the lower Araguaia River. Front Genet. 2018; 9:295. https://doi.org/10.3389/fgene.2018.00295
Instituto Chico Mendes de Conservação da Biodiversidade (ICMBio). Livro Vermelho da Fauna Brasileira Ameaçada de Extinção. Volume VI – Peixes. Brasília: ICMBio/MMA; 2018. Available from: https://www.gov.br/icmbio/pt-br/centrais-de-conteudo/publicacoes/publicacoes-diversas/livro_vermelho_2018_vol6.pdf
Jombart T, Devillard S, Balloux F. Discriminant analysis of principal components: a new method for the analysis of genetically structured populations. BMC Genet. 2010; 11:94. https://doi.org/10.1186/1471-2156-11-94
Junge C, Vøllestad LA, Barson NJ, Haugen TO, Otero J, Saetre G-P et al. Strong gene flow and lack of stable population structure in the face of rapid adaptation to local temperature in a spring-spawning salmonid, the European grayling (Thymallus thymallus). Heredity. 2011; 106:460–71. https://doi.org/10.1038/hdy.2010.160
Kassambara A. fastqcr: quality control of sequencing data. R package version 0.1. 2019. Available from: https://CRAN.R-project.org/package=factoextra
Kavalco KF, Pazza R, Bertollo LAC, Moreira-Filho O. Karyotypic diversity and evolution of Loricariidae (Pisces, Siluriformes). Heredity. 2005; 94:180–86. https://doi.org/10.1038/sj.hdy.6800595
Keppeler FW, Andrade MC, Trindade PAA, Sousa LM, Arantes CC, Winemiller KO et al. Early impacts of the largest Amazonian hydropower project on fish communities. Sci Total Environ. 2022; 838:155951. https://doi.org/10.1016/j.scitotenv.2022.155951
Khoshkholgh M, Nazari S. Characterization of single nucleotide polymorphism markers for the narrow-clawed crayfish Pontastacus leptodactylus (Eschscholtz, 1823) based on RAD sequencing. Conserv Genet Resour. 2020; 12:549–53. https://doi.org/10.1007/s12686-020-01154-8
Lehner B, Grill G. Global river hydrography and network routing: baseline data and new approaches to study the world’s large river systems. Hydrol Process. 2013; 27(15):2171–86. https://doi.org/10.1002/hyp.9740
Leidy RA, Moyle PB. Keeping up with the status of freshwater fishes: a California (USA) perspective. Conserv Sci Pract. 2021; 3(8):e474. https://doi.org/10.1111/csp2.474
Liu X, Wu R, Chen X, Zhou Y, Yang L, Ouyang S et al. Effects of dams and their environmental impacts on the genetic diversity and connectivity of freshwater mussel populations in Poyang Lake Basin, China. Freshw Biol. 2019; 65(2):264–77. https://doi.org/10.1111/fwb.13419
Magalhães KX, Silva RDF, Sawakuchi AO, Gonçalves AP, Gomes GFE, Muriel-Cunha J et al. Phylogeography of Baryancistrus xanthellus (Siluriformes: Loricariidae), a rheophilic catfish endemic to the Xingu River basin in eastern Amazonia. PLoS ONE. 2021; 16(8):e0256677. https://doi.org/10.1371/journal.pone.0256677
Manni F, Guerard E, Heyer E. Geographic patterns of (genetic, morphologic, linguistic) variation: how barriers can be detected by “Monmonier’s algorithm”. Hum Biol. 2004; 76(2):173–90. https://doi.org/10.1353/hub.2004.0034
MapBiomas. Projeto MapBiomas – Coleção 8 da série anual de mapas de cobertura e uso do solo do Brasil. Coleção 9 [Internet]. Available from: https://storage.googleapis.com/mapbiomas-public/initiatives/brasil/collection_9/lclu/coverage/brasil_coverage_2023.tif
Ministério do Meio Ambiente (MMA). Portaria MMA nº 148, de 7 de junho de 2022 [Internet]. Brasília; 2022. Available from: https://www.icmbio.gov.br/cepsul/images/stories/legislacao/Portaria/2020/P_mma_148_2022_altera_anexos_P_mma_443_444_445_2014_atualiza_especies_ameacadas_extincao.pdf
Nazareno AG, Bemmels JB, Dick CW, Lohmann LG. Minimum sample sizes for population genomics: an empirical study from an Amazonian plant species.Mol Ecol Res. 2017;17(6):1136–47. https://doi.org/10.1111/1755-0998.12654
Oliveira RRD. Sistemática de Baryancistrus Rapp Py-daniel, 1989 (Loricariidae: Hypostominae). [PhD Dissertation]. Manaus: Instituto Nacional de Pesquisas da Amazônia; 2018. Available from: https://repositorio.inpa.gov.br/handle/1/12999
Osborne MJ, Archdeacon TP, Yackulic CB, Dudley RK, Caeiro-Dias G, Turner TF. Genetic erosion in an endangered desert fish during a megadrought despite long-term supportive breeding. Conserv Biol. 2024; 38(1):e14154. https://doi.org/10.1111/cobi.14154
Peluso LM, Mateus L, Penha J, Bailly D, Cassemiro F, Suárez Y et al. Climate change negative effects on the Neotropical fishery resources may be exacerbated by hydroelectric dams. Sci Total Environ. 2022; 828:154485. https://doi.org/10.1016/j.scitotenv.2022.154485
Peluso LM, Mateus L, Penha J, Suárez Y, Lemes P. Climate change may reduce suitable habitat for freshwater fish in a tropical watershed. Climatic Change. 2023; 176:44. https://doi.org/10.1007/s10584-023-03526-z
Peterson BK, Weber JN, Kay EH, Fisher HS, Hoekstra HE. Double digest RADseq: an inexpensive method for de novo SNP discovery and genotyping in model and non-model species. PLoS ONE. 2012; 7(5):e37135. https://doi.org/10.1371/journal.pone.0037135
Pezzuti JCB, Zuanon J, Lopes PFM, Carneiro CC, Sawakuchi AO, Montovanelli TR et al. Brazil’s Belo Monte license renewal and the need to recognize the immense impacts of dams in Amazonia. Perspect Ecol Conserv. 2024; 22(2):112–17. https://doi.org/10.1016/j.pecon.2024.05.001
Pinheiro J, Bates D, DebRoy S, Sarkar D. nlme: linear and nonlinear mixed effects models. 2025. https://doi.org/10.32614/CRAN.package.nlme
Pinto AV, Hansson B, Patramanis I, Morales HE, van Oosterhout C. The impact of habitat loss and population fragmentation on genomic erosion. Conserv Gent. 2024; 25:49–57. https://doi.org/10.1007/s10592-023-01548-9
Reid AJ, Carlson AK, Creed IF, Eliason EJ, Gell PA, Johnson PTJ et al. Emerging threats and persistent conservation challenges for freshwater biodiversity. Biol Rev. 2019; 94(3):849–73. https://doi.org/10.1111/brv.12480
Radojković N, Marinović Z, Milošković A, Radenković M, Đuretanović S, Lujić J et al. Effects of stream damming on morphological variability of fish: case study on large spot barbel Barbus balcanicus. Turk J Fish Aquat Sci. 2018; 19:231–39. http://doi.org/10.4194/1303-2712-v19_3_06
Ribolli J, Zaniboni-Filho E, Machado CB, Guerreiro TCS, Freitas PD, Galetti Jr. PM. Anthropogenic river fragmentation reduces long-term viability of the migratory fish Salminus brasiliensis (Characiformes: Bryconidae) populations. Neotrop Ichthyol. 2021; 19(2):e200123. https://doi.org/10.1590/1982-0224-2020-0123
Saha A, kent M, Hauser L, Drinan DP, Nielsen EE, Westgaard JI et al. Hierarchical genetic structure in an evolving species complex: insights from genome wide ddRAD data in Sebastes mentella. PLoS ONE. 2021; 16(1):e0251976. https://doi.org/10.1371/journal.pone.0251976
Skey ED, Ottewell KM, Spencer PB, Shaw RE. Empirical landscape genetic comparison of single nucleotide polymorphisms and microsatellites in three arid-zone mammals with high dispersal capacity. Ecol Evol.2023; 13(5):e10037. https://doi.org/10.1002/ece3.10037
Simonsen KL, Churchill GA, Aquadro CF. Properties of statistical tests of neutrality for DNA polymorphism data. Genetics. 1995; 141(1):413–29. https://doi.org/10.1093/genetics/141.1.413
Stoffers T, Buijse AD, Geerling GW, Jans LH, Schoor MM, Poos JJ et al. Freshwater fish biodiversity restoration in floodplain rivers requires connectivity and habitat heterogeneity at multiple spatial scales. Sci Total Environ. 2022; 838:156509. https://doi.org/10.1016/j.scitotenv.2022.156509
Suzuki HI, Agostinho AA, Winemiller KO. Relationship between oocyte morphology and reproductive strategy in loricariid catfishes of the Paraná River, Brazil. J Fish Biol. 2000; 57(3):791–807. https://doi.org/10.1111/j.1095-8649.2000.tb00275.x
Tyers M. riverdist: river network distance computation and applications. 2024. https://10.32614/CRAN.package.riverdist
Visser S, Scherer L, Huijbregts M, Barbarossa V. Characterization factors for the impact of climate change on freshwater fish species. Ecol Indic. 2023; 150:110238. https://doi.org/10.1016/j.ecolind.2023.110238
Authors

Marina Gomes Leonardo1, Éder Cristian Malta de Lanes1, Felipe Arian de Andrade Araújo1 , Vanessa Paes da Cruz2, Silvia Eliza Pavan3, Iann Leonardo Pinheiro Monteiro1, Tânia Fontes Quaresma1, Claudio Oliveira3 and Alberto Akama1,4
[1] Programa de Pós-Graduação em Biodiversidade e Evolução, Museu Paraense Emílio Goeldi, Av. Perimetral, 1901, Terra Firme, 66077-530, Belém, PA, Brazil. (MGL) maarinagomes@hotmail.com, (ECML) edercml@gmail.com, (FAAA) araujo.felipearian@gmail.com (corresponding author), (ILPM) iannlpmonteiro@gmail.com, (TFQ) taniafquaresma@gmail.com, (AA) albertoakama@museu-goeldi.br.
[2] Universidade Estadual Paulista “Júlio de Mesquita Filho”, Departamento de Biologia Estrutural e Funcional, Instituto de Biociências, Distrito de Rubião Júnior, 18618-970, Botucatu, SP, Brazil. (CO) claudio.oliveira@unesp.br.
[3] California State Polytechnic University, Humboldt, 1 Harpst Street, 95521 Arcata, CA, United States. (SEDP) silviaeopavan@gmail.com.
[4] Museu Paraense Emílio Goeldi, Coordenação de Zoologia, Setor Ictiologia, Campus de Pesquisa de Pesquisa do Museu Goeldi, Av. Perimetral, 1901, Terra Firme, 66077-530, Belém, PA, Brazil.
Authors’ Contribution 

Marina Gomes Leonardo: Conceptualization, Data curation, Formal analysis, Methodology, Writing-original draft, Writing-review and editing.
Éder Cristian Malta de Lanes: Conceptualization, Data curation, Formal analysis, Investigation, Methodology, Software, Writing-original draft, Writing-review and editing.
Felipe Arian de Andrade Araújo: Methodology, Writing-original draft, Writing-review and editing.
Vanessa Paes da Cruz: Data curation, Formal analysis, Methodology, Writing-review and editing.
Silvia Eliza Pavan: Methodology, Writing-review and editing.
Iann Leonardo Pinheiro Monteiro: Methodology, Software, Writing-review and editing.
Tânia Fontes Quaresma: Methodology, Writing-review and editing.
Claudio Oliveira: Investigation, Methodology, Writing-review and editing.
Alberto Akama: Conceptualization, Funding acquisition, Project administration, Writing-review and editing.
Ethical Statement
Sampling was conducted under permit SISBIO Nº 70940–1, in accordance with current Brazilian legislation.
Statement of Equal Contribution by the Authors
Authors Marina Gomes Leonardo and Éder Cristian Malta de Lanes contributed equally to the development of this article.
Competing Interests
The author declares no competing interests.
Data availability statement
The authors confirm that the data supporting the findings of this study are available within the article.
AI statement
The authors did not use any AI-assisted technologies in the creation of this manuscript or its figures.
Funding
This work was funded by grants from the Fundo de Defesa de Direitos Difusos program of the Brazilian Ministry of Justice and Public Safety (FDD 24/2019–0800.012635/2019–80). MGL is supported by PhD scholarship by Coordenação de Aperfeiçoamento de Pessoal de Nível Superior (CAPES) – Finance Code 001; ECML by a postdoctoral fellowship by Conselho Nacional de Desenvolvimento Científico e Tecnológico (CNPq 300714/2017–3).
Supplementary Material
Supplementary material SUP
Peer Review
How to cite this article
Leonardo MG, Lanes ECM, Araújo FAA, Cruz VP, Pavan SE, Monteiro ILP, Quaresma TF, Oliveira C, Akama A. Where are we going to live? Population genomics emits warning signals about endangered Amazonian rheophilic loricariids under habitat loss. Neotrop Ichthyol. 2026; 24(2):e250148. https://doi.org/10.1590/1982-0224-2025-0148
Copyright
This is an open access article under the terms of the Creative Commons Attribution License, which permits use, distribution and reproduction in any medium, provided the original work is properly cited.
Distributed under
Creative Commons CC-BY 4.0

© 2025 The Authors.
Diversity and Distributions Published by SBI
 Accepted December 2, 2025
Submitted August 19, 2025
Epub July 20, 2026