![]() Themis Jesus Silva1
Themis Jesus Silva1 ![]() ,
, ![]() Valéria Nogueira Machado2,
Valéria Nogueira Machado2, ![]() Emerson Carlos Soares1,
Emerson Carlos Soares1, ![]() Tomas Hrbek2,3 and
Tomas Hrbek2,3 and ![]() Izeni Pires Farias2
Izeni Pires Farias2
PDF: EN XML: EN | Supplementary: S1 S2 S3 S4 S5 | Cite this article
Abstract
Este estudo testou a hipótese do aruanã-prata de diferentes rios da bacia Amazônica ser geneticamente estruturado, necessitando, portanto, de medidas de explotação diferenciadas para a manutenção dos estoques e continuidade das atividades econômicas. Tais atividades incluem a pesca artesanal para alimentação e a pesca predatória para fins ornamentais, que causa grande impacto nas populações da espécie, pois envolve a morte dos machos adultos para a captura dos alevinos. Assim, o gene mitocondrial ATPase 6 de 397 indivíduos de aruanã-prata foi parcialmente sequenciado para análises da diversidade genética. Os resultados mostram que a variabilidade genética é maior nas populações ocorrendo a oeste da bacia Amazônica, sugerindo que a origem dessa diversidade aconteceu na Amazônia ocidental, com posterior dispersão para o leste da bacia. A estrutura populacional observada foi orientada de oeste para leste, provavelmente devido ao isolamento pela distância. Tais populações precisam ser manejadas e conservadas de maneira diferente e eficaz para preservar suas características genéticas locais. É importante pensar no gerenciamento em curto prazo dessas populações, colocando em prática medidas de conservação como o ordenamento da pesca, legislação específica para a espécie e aumento da fiscalização para coibir a pesca para fins ornamentais no período de reprodução da espécie.
Palavras-chave: Aruanã prata, Diversidade genética, Gene ATPase, Separação Oeste-Leste, Peixe ornamental.
Introduction
Fishing is one of the most important human activities in the Amazon and serves as a source of food, income, and recreation for a large portion of the population (Santos, Santos, 2005). According to the most recent survey of the Amazonian ichthyofauna (Dagosta, de Pinna, 2019) there are 2716 species of fish occurring in this basin, of which around 200 are regularly exploited for food and depending on the region, between six and twelve species represent 80% of landings (Isaac et al., 2012). The silver arowana Osteoglossum bicirrhosum Cuvier, 1829 and the black arowana Osteoglossum ferreirai Kanazawa, 1966 are part of this group of commercially exploited fishes in the Amazon basin (Lima, Prang, 2008). South American arowanas belong to the order Osteoglossiformes, which also includes the Asian arowana (Scleropages formosus Müller & Schlegel, 1840), Australian arowanas (Scleropages jardinii Saville-Kent, 1892; Scleropages leichardti Günther, 1864), Myanmar arowana (Scleropages inscriptus Roberts, 2012) and the pirarucu (Arapaima gigas Schinz, 1822) (Nelson et al., 2016). Osteoglossiformes have primitive anatomic characteristics and are considered basal teleosts, with a probable origin in the Gondwana (Kumazawa, Nishida, 2000). The two species of Osteoglossum have non-overlapping distributions, which seem to be related to water characteristics. Osteoglossum bicirrhosum is widely distributed in the Amazon, Essequibo, Orinoco and Guiana basins (Reis et al., 2003; Maldonado-Ocampo et al., 2008) in white and alkaline waters (Duncan, Fernandes, 2010), while O. ferreirai is restricted to the Negro and Orinoco rivers (Mojica et al., 2002) in black and acidic waters (Duncan, Fernandes, 2010). The silver arowana (O. bicirrhosum) is exploited in two different economic activities. It is caught to meet the demand of the international market for ornamental fishes as a substitute for the Asian arowana (Scleropages formosus), which has been on the list of endangered species of the Convention on International Trade in Endangered Species (CITES) since 1975 (Yue et al.,2003) and, as a food source for riverine communities (Maldonado et al., 2017). It is important to highlight that consumption in Brazil has been growing and its meat is well accepted by the consumer market for presenting a good yield and good chemical composition (Costa et al., 2009). In the ornamental fish market, both juveniles and adults have high commercial value (Brown, 1995; García-Dávila et al., 2021). The capture of post-larval forms generally involves the killing of male adults who are responsible for the parental care of the offspring, which makes the species particularly susceptible to commercial fishing, and underscores the need for management measures to ensure sustainable exploitation (Moreau, Coomes, 2006).
The silver arowana is the most important species for the aquarium trade in some countries, such as Peru, where it accounted for 42% of ornamental fish export in 2001, and in 2010 generated more than 2 million dollars in foreign exchange for the country (García-Dávila et al., 2021). Also in Peru, it is the second most important species in trade by total volume exported, accounting for 29% and behind only catfishes of the genus Otocinclus Cope, 1871, commonly known as “dwarf suckers” (Moreau, Coomes, 2006). In Colombia, the sale of silver arowana as an ornamental is also a strong commercial activity. For instance, in the city of Leticia alone, almost 850,000 O. bicirrhosum juveniles were sold between 2019 and 2023 (AUNAP, 2023), with an average of 170,000 individuals exported per year. Fishing for this species has generated conflicts in the triple border region between Brazil, Colombia and Peru, since in the last two countries the arowana stocks are almost exhausted and the capture of post larvae juveniles has advanced illegally into the Brazilian territory (Beltrão et al., 2021). In addition, the decrease in juvenile stocks in Colombia and Peru has already generated a reduction in fish stocks of adult individuals that are exploited by commercial fisheries in Brazil (Maldonado et al., 2017). In Brazil, several measures are in place to protect the arowana, including a ban on fishing for ornamental purposes (Maldonado, Lasso, 2014) and a closed season during the reproductive period. In the State of Amazonas, the Secretariat of the Environment (SEMA) established procedures in 2017 for the managed fishing of larvae and fry of two arowana species O. bicirrhosum and O. ferreirai (CEMAAM, 2017) as a measure to curb overfishing.
The silver arowana has a short reproductive period, low fertility, large oocytes, efficient parental care of eggs, larvae, and juveniles (performed by the male) and probable mate choice (Queiroz, Camargo, 2008; Mojica et al., 2012; Verba et al., 2014). In addition to these characteristics the species is a relatively sedentary fish (Moreau, Coomes, 2006), with carnivorous eating habits (mainly insects and fish) (Mascarenhas, 2008). These traits make the species especially vulnerable to exploitation, particularly the male, who cares for the young by keeping them in its mouth, and is often sacrificed to catch these juveniles (Mojica et al., 2012; Maldonado et al., 2017).
Understanding the genetic structure of fish populations is crucial for economically important species like the silver arowana. However, research on Osteoglossiformes has primarily concentrated on phylogenetic aspects and Asian arowana species (Kumazawa, Nishida, 2000; Inoue et al., 2001; Yue et al., 2003; Mu et al., 2012). In their study of the silver arowana (O. bicirrhosum), Chota-Macuyama et al. (2016) identified a strong genetic structure within the Peruvian Amazon, suggesting that geographic isolation may be a contributing factor. Additionally, Souza et al. (2019) employed cytogenetic and DArTseq-derived single nucleotide polymorphism (SNP) data from a single collection point (Solimões River, Catalão Lake, AM) and discovered greater genetic diversity in arowanas from this site compared to those from the Tocantins-Araguaia basin, which had two collection points. Other studies of the silver arowana has explored multiple paternity (Verba et al., 2014) and the identification of sex-specific markers (Wang et al., 2013; Liu et al., 2025).
Therefore, considering the life characteristics of the species and its wide distribution in several countries in the Amazon basin, the objective of this study was to investigate the hypothesis of population structure. Specifically, our objective was to determine whether there is genetic structuring among silver arowana populations across their range. Additionally, the distribution and levels of genetic diversity within the species were evaluated in order to genetically characterize its populations.
Material and methods
Sampling. The collections were carried out in the main rivers of the Brazilian Amazon basin (Fig. 1) by directly obtaining samples from artisanal fishing during the landing. A total of 16 localities were included, with six located in the western Amazon basin and 10 in the eastern Amazon basin. The tissues (barbel) were preserved in 95% ethanol and deposited in the CTGA tissue collection of the Universidade Federal do Amazonas (UFAM), Manaus, Brazil.
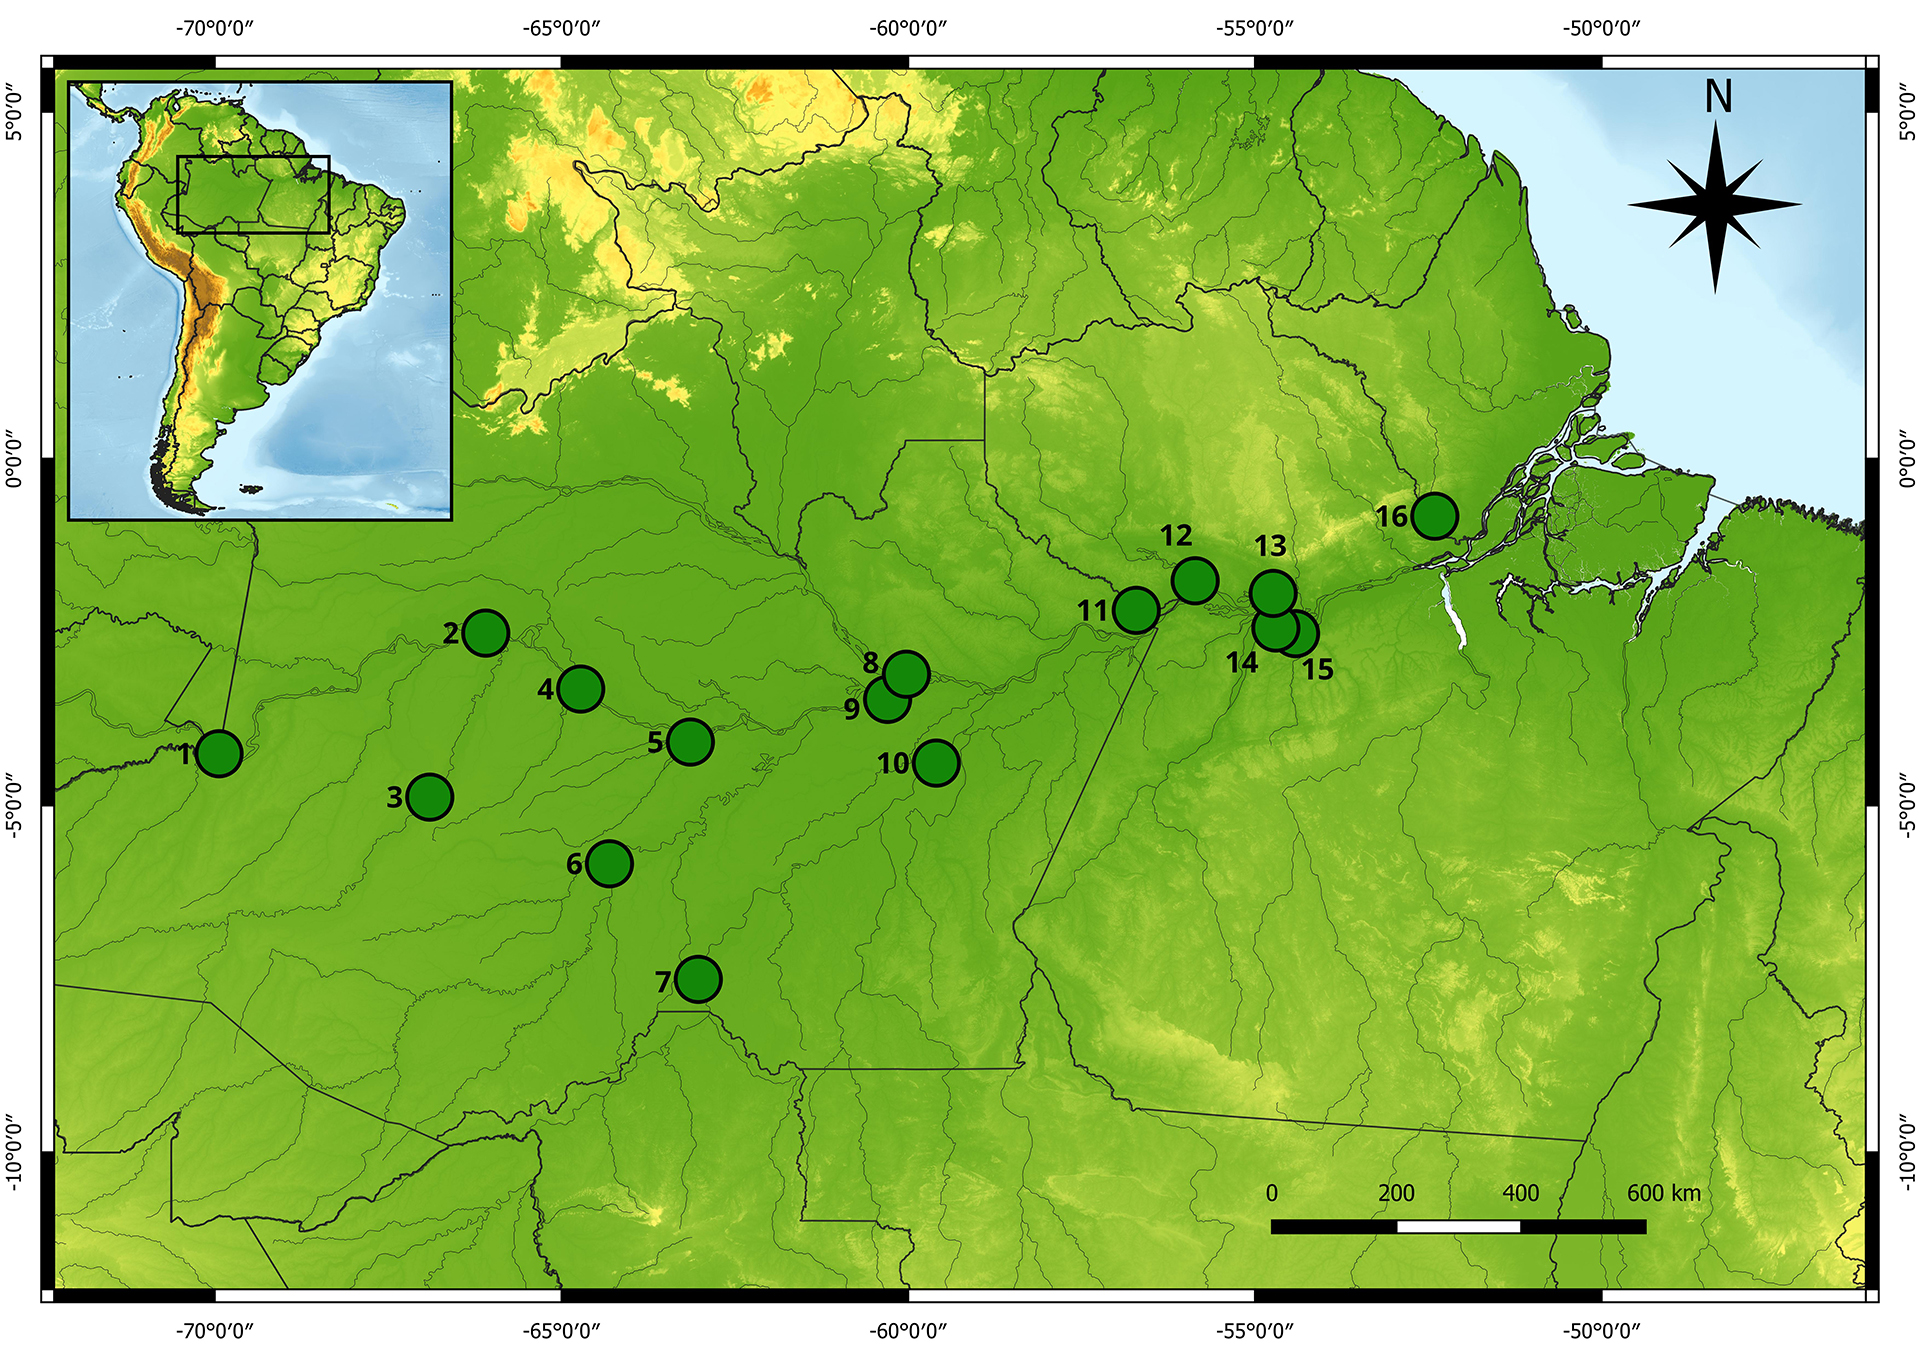
FIGURE 1| Localities sampled for individuals of the silver arowana (Osteoglossum bicirrhosum). 1. Tabatinga (Upper Solimões River channel); 2. Fonte Boa (Solimões River channel); 3. Juruá (Lakes near Eirunepé city); 4. Tefé (Middle Solimões River); 5. Coari (Middle Solimões River); 6. Purus (Lakes near Tapauá city); 7. Humaitá (Middle Madeira River); 8. Manaus (Lakes in the central Amazon, near Manaus city); 9. Janauacá (Lake in the lower Solimões River); 10. Borba (Lower Madeira River); 11. Nhamundá (Lower Nhamundá River); 12. Oriximiná (Lower Trombetas River); 13. Alenquer (Middle Amazonas River); 14. Santarém (Lower Tapajós River); 15. Ituqui (Middle Amazonas River), and 16. Jari (Lower Jari River).
Data collection. Total DNA extraction was performed using the 2% CTAB extraction protocol (Doyle, Doyle, 1987). The gene encoding ATP synthase subunit 6 was amplified via Polymerase Chain Reaction using the primers CO2f.2 (5’- TGGGCGTAAAAATAGATGC – 3’) and CO3r.3 (5’-GAGGAGAGCRGCRGATGCCCC – 3’), developed for this work. Each reaction contained 25 mM MgCl2; 200 mM Tris-HCL, 500 mM KCl buffer 10X; 2.5 mM DNTPs; 2µM of each primer; 5U/µL Taq polymerase and 1µL DNA (≈ 20 ng) at a final volume of 25µL. PCR cycling conditions were as follows: denaturation at 92°C for 2 min, 35 cycles of denaturation at 92°C for 1 min, annealing at 55°C for 1 min and extension at 72°C for 1 min, followed by a final extension cycle of 72°C for 5 min. Reactions were analyzed on 1% agarose gel stained with Gel Red (Biotium, Fremont, CA, USA). PCR products were purified using the EXOSAP protocol (Fermentas), sequence reactions were performed using DYEnamic ™ ET Dye Terminator kit (GE Healthcare, São Paulo, Brazil) and the sequences were determined on the MegaBACE TM 1000 automated sequencer (GE Healthcare) using the primer forward ATPf.1 (Hrbek et al., 2005). The sequences obtained were aligned in the Clustal W program (Thompson et al., 1994), implemented in the Bioedit 7.0.5 program (Hall, 1999), with final edits performed manually.
Population structure analyses. Molecular Variance Analysis (AMOVA) run in Arlequin 3.5.2.2 (Excoffier, Lischer, 2015) was performed to verify the existence of hierarchical levels of population structure among individuals from the different sampled locations. Indirect gene flow (Nm) and the degree of population structuring were also evaluated in the software Arlequin 3.5.2.2 (Excoffier, Lischer, 2015), whose analysis is based on differences in nucleotide frequencies. Thus, we inferred an analog of Wright’s FST (Wright, 1969), the pairwise ΦST (Weir, Cockerham, 1984), among all sampled locations, with associated value and statistical significance (P < 0.00042, value after Bonferroni correction (Rice, 1989)) for rejection or not of the null hypothesis of panmixia (FST = 0) between the compared populations. To infer the possible presence of different biological groups within the silver arowana, a Bayesian Analysis of Population Structure was carried out in the program BAPS (Bayesian Analysis of Population Structure) (Corander et al., 2003), which tests the most probable number of biological groups within a priori group number range, in the arowana case, from one to 16 groups. BAPS is a statistical approach that employs Bayesian clustering algorithms to infer population structure and classify individuals into discrete genetic groups or clusters. The result of a BAPS analysis typically includes the most likely number of populations (K), the assignment of individuals to these populations, and the posterior probabilities associated with these assignments. Additionally, we used a multivariate ordination approach implemented in the Principal Component Analysis (PCA) using the R package Adegenet 2.1 (Jombart, 2008) in R (R Development Core Team, 2018). PCA was employed for population genetic structure analysis to reduce the dimensionality of the genetic data while retaining the most informative variance, thereby enabling the identification of patterns of genetic differentiation among populations. This approach allows for the visualization of genetic relationships and structure across populations without relying on predefined groupings, providing an unbiased overview of the genetic landscape.
The Mantel test (Mantel, 1967) was implemented in the Arlequin 3.5.2.2 program (Excoffier, Lischer, 2015) to evaluate the significance of the association between the genetic distance matrix (using the paired ΦST values) and the geographical distance matrix, estimated using the Google Earth program v. 6.2 (2012) (Google), following river courses. The statistical significance of the association between the two matrices was tested using 1,000 random permutations. The probability values were adjusted using the Bonferroni correction (Rice, 1989).
Genetic diversity. The genetic diversity indices: polymorphic sites, number of haplotypes (H), haplotype (h) and nucleotide (π) diversity were calculated in Arlequin v. 3.5.2.2 (Excoffier, Lischer, 2015). To test if sample sizes affected diversity estimates, we performed a rarefaction analyses by sub-sampling all sampling points by the lowest sample size in this study (Jari, N = 5), recalculating haplotype diversity over 1,000 random replicates using a customized R script. The neutrality tests of Tajima’s D (Tajima, 1989) and Fu’s Fs (Fu, 1997) were used to evaluate selective neutrality in natural populations for each cluster. All these estimates were calculated in Arlequin v. 3.5.2.2 (Excoffier, Lischer, 2015). For the reconstruction of an APTase haplotype network we first estimated a Maximum Likelihood (ML) topology in RAxML v. 8 (Stamatakis, 2014) using GTR+G evolutionary model estimated in jMODELTEST2 (Darriba et al., 2012) and then using HAPLOVIEWER 4.2 (Salzburger et al., 2011) to visualize the relationship and distribution of haplotypes obtained among the sampling localities of the silver arowana.
One-way Analysis of Variance (ANOVA, p < 0.05) (Minitab 14.0) was also applied to test whether genetic parameters differ between the two regions (West and East), using Tukey’s test and Duncan’s test (both at a 5% confidence level), to reinforce the reliability of the analysis.
Analysis of historical demography. For demographic analysis, the DnaSP 5.0 (Librado, Rozas, 2009) program was used to obtain the population mismatch distribution pattern and infer the demographic status of the populations (stable, expanding or reducing). The program BEAST v. 2.5.1 (Drummond, Rambaut, 2007) was used to investigate patterns of changes in effective population size throughout the coalescent time of the silver arowana in the Amazon basin, using Bayesian skyline plot approach. All analyses were run for 100 million generations with a burn-in of 10% initial samples, sampling every 10,000 topologies. We used the GTR+G model of molecular evolution, a strict molecular clock and default priors. The absolute time scale of the Bayesian skyline plot was calculated using a substitutions rate for mitochondrial DNA of the 1.3% sequence divergence per million years (Bermingham et al., 1997), and generation time of 2-4 years (average 3 years) based on Chang (2009).
Results
Population structure analyses. The alignment of 397 individuals was composed of 500 bp of the ATPase gene (subunit 6), which exhibited 65 polymorphic sites, 29 of which were informative for parsimony. Sequences were deposited in the GenBank under the accession number ON987569 to ON987965.
AMOVA revealed a strong genetic structure (ФST = 0.422, P < 0.0001) among the sampled localities, with greater variation found within localities (57.80%) than among localities (42.20%). The pairwise ФST comparison demonstrated that the individuals from Juruá, Tabatinga and Fonte Boa are genetically differentiated from the other localities (Tab. 1). Furthermore, the Juruá locality displayed significant ФST values in all comparisons and demonstrated very limited gene flow (Nm) with all the sampled localities (Tab. 1); the lowest value was observed with the Manaus locality (0.0483), while the highest was observed with Tabatinga (1.0237).
TABLE 1 | Pairwise ФST values (below the diagonal) and effective number of migrants per generation (Nm) (above the diagonal) between 16 populations of Osteoglossum bicirrhosum sampled for the sequences of mitochondrial gene ATPase 6. Note: West: 1. Tabatinga; 2. Fonte Boa; 3. Juruá; 4. Tefé; 5. Coari; 6. Purus; East: 7. Humaitá; 8. Manaus; 9. Janauacá; 10. Borba; 11. Nhamundá; 12. Oriximiná; 13. Alenquer; 14. Santarém; 15. Ituquiand16. Jari. * Significant level P ≤ 0.05, ** after Bonferroni’s correction P ≤ 0.0003
| 1 | 2 | 3 | 4 | 5 | 6 | 7 | 8 | 9 | 10 | 11 | 12 | 13 | 14 | 15 | 16 |
1 | – | inf | 1.02374 | 3.09809 | 0.86005 | 0.87701 | 0.91499 | 0.55386 | 1.05276 | 0.71779 | 0.79588 | 0.80247 | 1.04862 | 0.56903 | 0.90083 | 1.62276 |
2 | -0.01651 | – | 0.79654 | 4.64921 | 1.04404 | 1.14575 | 1.09558 | 0.69435 | 1.24876 | 0.88268 | 0.97954 | 0.97786 | 1.26787 | 0.71065 | 1.07369 | 1.91809 |
3 | 0.32814** | 0.38564** | – | 0.24977 | 0.07177 | 0.10792 | 0.09562 | 0.04837 | 0.09039 | 0.04869 | 0.05600 | 0.05387 | 0.08360 | 0.05465 | 0.08125 | 0.08666 |
4 | 0.13896 | 0.09710 | 0.66687** | – | 4.84051 | 12.51984 | 4.79382 | 2.86224 | 5.84005 | 3.74417 | 4.59192 | 4.32983 | 6.63883 | 2.88235 | 3.99935 | inf |
5 | 0.36763** | 0.32383** | 0.89038** | 0.09362 | – | 31.34139 | 30.49849 | 64.89879 | 32.48201 | 19.32000 | 29.50000 | 34.48148 | 115.92523 | 14.03702 | 31.25197 | inf |
6 | 0.36310** | 0.30381** | 0.82248** | 0.03840 | 0.01570 | – | 15.59172 | 16.24745 | 25.99451 | 33.10606 | 98.53723 | 61.07143 | 82.19296 | 12.26772 | 7.66736 | inf |
7 | 0.35336** | 0.31337** | 0.83946** | 0.09445 | 0.01613 | 0.03107 | – | 15.62748 | inf | 26.90566 | 39.37136 | 61.41232 | 34.05624 | 12.43900 | 8.59050 | inf |
8 | 0.47445** | 0.41864** | 0.91180** | 0.14871 | 0.00765 | 0.02986 | 0.03100 | – | 18.61152 | inf | inf | inf | 11.51573 | 18.37753 | 4.61608 | inf |
9 | 0.32201 | 0.28592 | 0.84690** | 0.07886 | 0.01516 | 0.01887 | -0.00074 | 0.02616 | – | 12.91975 | 21.15441 | 21.61250 | 38.16271 | 12.21520 | 8.06225 | inf |
10 | 0.41058** | 0.36162** | 0.92834** | 0.11781 | 0.02523 | 0.01488 | 0.01824 | -0.01491 | 0.03726 | – | 112.32558 | inf | 8.63794 | 24.47896 | 2.99133 | inf |
11 | 0.38584** | 0.33794** | 0.89928** | 0.09819 | 0.01667 | 0.00505 | 0.01254 | -0.00909 | 0.02309 | 0.00443 | – | inf | 12.85212 | 26.69259 | 3.80806 | inf |
12 | 0.38388** | 0.33833 | 0.92115** | 0.10352 | 0.01429 | 0.00812 | 0.00808 | -0.02098 | 0.02261 | 0.00000 | -0.00491 | – | 12.10033 | 40.51224 | 3.56250 | inf |
13 | 0.32287 | 0.28283 | 0.85676** | 0.07004 | 0.00429 | 0.00605 | 0.01447 | 0.04161 | 0.01293 | 0.05472 | 0.03745 | 0.03968 | – | 11.89391 | 8.13863 | inf |
14 | 0.46771** | 0.41300** | 0.90148** | 0.14783** | 0.03439 | 0.03916 | 0.03864 | 0.02649 | 0.03932 | 0.02002 | 0.01839 | 0.01219 | 0.04034 | – | 5.42596 | inf |
15 | 0.35693** | 0.31772 | 0.86022** | 0.11113 | 0.01575 | 0.06122 | 0.05500 | 0.09773 | 0.05840 | 0.14321 | 0.11606 | 0.12308 | 0.05788 | 0.08437 | – | inf |
16 | 0.23554 | 0.20678 | 0.85229** | -0.00544 | -0.09050 | -0.07955 | -0.09418 | -0.10953 | -0.09771 | 0.00000 | -0.10526 | 0.00000 | -0.08028 | -0.07947 | -0.01124 | – |
Bayesian Analysis (BAPS) inferred, with high posterior probability (ln = -1010.1271), the existence of two population groups, K = 2 (Fig. 2). One population group is composed of almost all individuals sampled along the Amazon basin (except Juruá River), while the other population group is observed only within the western Amazon River localities. The samples from the Juruá River were composed 100% of this second population, and the others from the west were composed of a mix of the two populations. Purus can be considered the limit of the western population, as it was the eastern-most place where individuals from the western group were observed in the BAPS results (Fig. 2). To facilitate comparison, the terms “west” and “east” of the Amazon basin will be used to refer to these groups. In agreement with the results of strong genetic structure among the silver arowana localities revealed by AMOVA and BAPS, the PCA results also indicate the presence of two main groups (Fig. 3). The results of the PCA show that PC1 explains 72.3% of the total variance, indicating a distinct separation between the western and eastern groups along PC1. PC2, on the other hand, only explains 2.1% of the variance (Fig. 3) but explains population divergence within the eastern group. The congruence of these findings with previous analyses reinforces the robustness of this population structure.
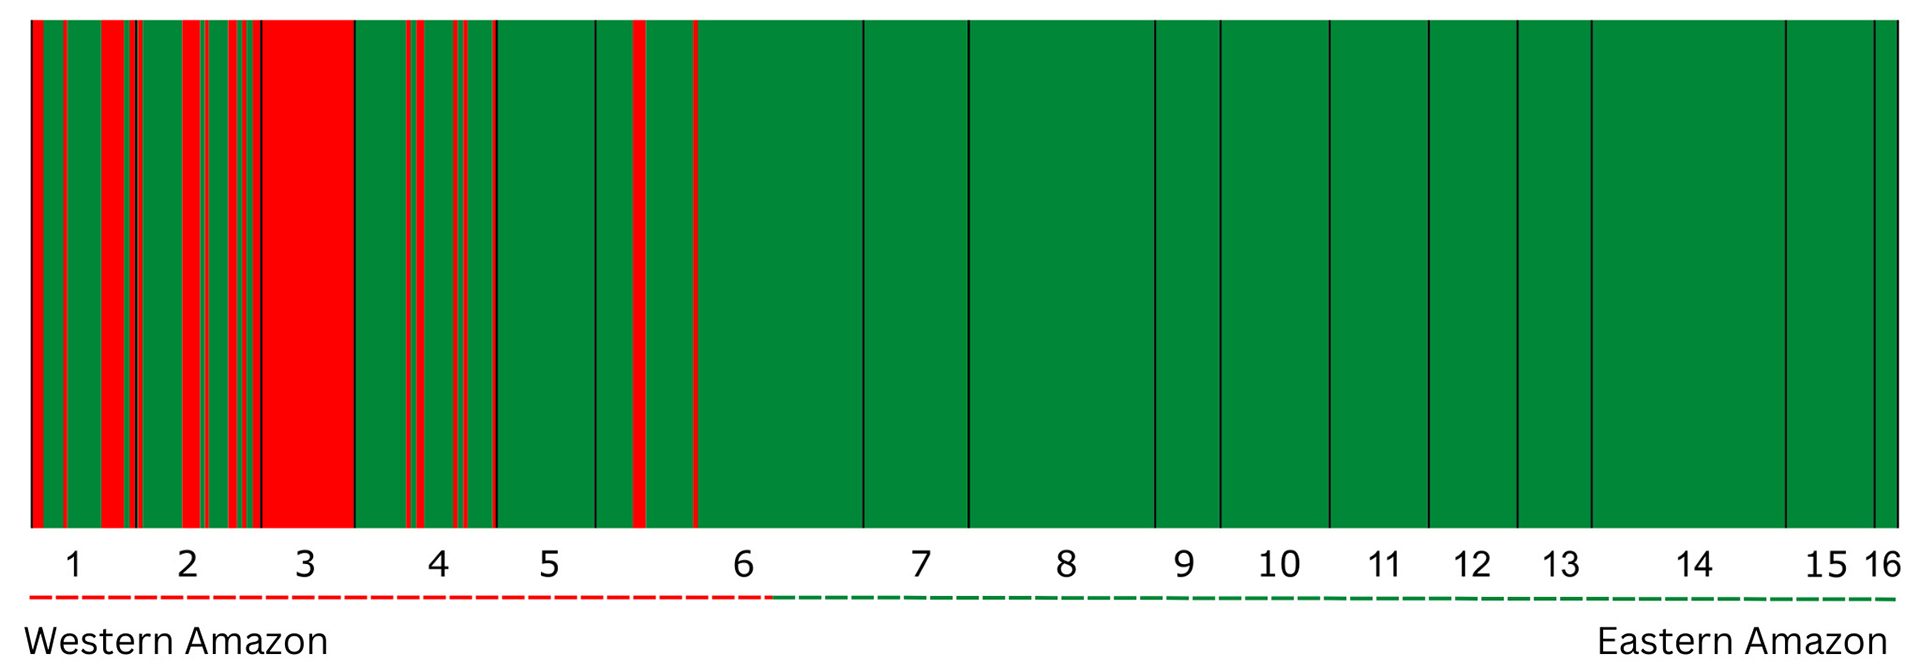
FIGURE 2| Biological population groups estimated by Bayesian analysis of population structure in the program BAPS. BAPS partitioned individuals into two biological groups Ln likelihood = −1010.1271, represented by the red (western populations), and green bars (eastern populations) and also delimited by dashed lines; thickness of bar is correlated to the number of individuals. Geographic localities are separated by vertical black lines. 1.Tabatinga; 2. Fonte Boa; 3. Juruá; 4. Tefé; 5. Coari; 6. Purus; 7. Humaitá; 8. Manaus; 9. Janauacá; 10. Borba; 11. Nhamundá; 12. Oriximiná; 13. Alenquer; 14. Santarém; 15. Ituqui, and 16. Jari.

FIGURE 3| Principal component analysis (PCA) using ATPase 6 gene sequences to verify the genetic structure of Osteoglossum bicirrhosum populations. The western and eastern regions of the Amazon basin are identified.
These groups (western and eastern Amazon basins) were also tested in a hierarchical AMOVA, which resulted in a significant population structure (ФST = 0.478, P < 0.0001). Furthermore, the Mantel test indicated a strong and significant correlation between genetic distance and geographical distance (r = 0.553, p < 0.001), suggesting that this genetic structure is probably the result of isolation by distance between western and eastern regions.
Genetic diversity. The Tab. 2 shows the main genetic parameters obtained for the 16 localities analyzed. We found no differences between estimates using the entire dataset or using the mean haplotype diversity over 1,000 replicates (Tab. S1).The haplotype diversity (h) varied from 0.913 in Tabatinga to 0.095 in Nhamundá. The nucleotide diversity (π) was also highest in Tabatinga (0.0088) and lowest in Nhamundá (0.0001). For three localities from the eastern Amazon basin (Borba, Oriximiná and Jari), the diversity was zero where all sequences comprised only one haplotype in each locality (Tab. 2).
TABLE 2 | Data characteristics and population statistics for each sampled site of Osteoglossum bicirrhosum. Note: N – number of individuals per location; H – number of haplotypes; h – haplotype diversity; π – nucleotide diversity. W – Western, E – Eastern. * Significance level P ≤ 0.05, ** after Bonferroni’s correction P ≤ 0.0003.
Sample sites | Coordinates | N | H | h | π | Tajima’s D | Fu’s Fs |
1. Tabatinga (W) | 4°15’12.05"S 69°56’18.70"W | 22 | 13 | 0.913 +/- 0.044 | 0.0088 +/- 0.0050 | 0.04338 | -3.74813* |
2. Fonte Boa (W) | 2°30’51.63"S 66°5’33.05"W | 27 | 11 | 0.814 +/- 0.054 | 0.0077 +/- 0.0044 | 0.23848 | -1.55227 |
3. Juruá (W) | 4°52’44.64"S 66°54’0.31"W | 21 | 8 | 0.566 +/- 0.128 | 0.0024 +/- 0.0018 | -2.23918* | -3.96290* |
4. Tefé (W) | 3°19’14.62"S 64°43’24.90"W | 30 | 10 | 0.664 +/- 0.090 | 0.0048 +/- 0.0029 | -0.87780 | -2.33898 |
5. Coari (W) | 4°5’5.58"S 63°8’30.15"W | 21 | 5 | 0.423 +/- 0.130 | 0.0009 +/- 0.0009 | -1.65358* | -3.12692* |
6. Purus (W) | 5°50’22.03"S 64°18’31.17"W | 57 | 9 | 0.349 +/- 0.081 | 0.0021 +/- 0.0015 | -1.70153* | -3.55942* |
7. Humaitá (E) | 7°30’22.20"S 63°1’37.82"W | 22 | 6 | 0.411 +/- 0.130 | 0.0021 +/- 0.0016 | -2.07555* | -1.88813 |
8. Manaus (E) | 3°6’25.89"S 60°1’34.06"W | 40 | 5 | 0.192 +/- 0.083 | 0.0005 +/- 0.0006 | -2.00344* | -4.30059** |
9. Janauacá (E) | 3°28’10.94"S 60°17’52.58"W | 14 | 5 | 0.505 +/- 0.158 | 0.0017 +/- 0.0014 | -1.95891* | -2.03141* |
10. Borba (E) | 4°23’18.07"S 59°35’40.15"W | 23 | 1 | 0 | 0 | 0 | 0 |
11. Nhamundá (E) | 2°11’11.00"S 56°42’42.00"W | 21 | 2 | 0.095 +/- 0.084 | 0.0001 +/- 0.0003 | -1.16356 | -0.91890 |
12. Oriximiná (E) | 1°45’35.80"S 55°51’44.89"W | 19 | 1 | 0 | 0 | 0 | 0 |
13. Alenquer (E) | 1°56’32.89"S 54°44’14.78"W | 16 | 5 | 0.533 +/- 0.142 | 0.0012 +/- 0.0011 | -1.54972* | -2.75106* |
14. Santarém (E) | 2°26’26.01"S 54°41’54.87"W | 41 | 5 | 0.311 +/- 0.091 | 0.0007 +/- 0.0008 | -1.42609 | -3.03027* |
15. Rio Ituqui (E) | 2°31’19.52"S 54°24’54.23"W | 18 | 4 | 0.594 +/- 0.108 | 0.0013 +/- 0.0012 | -0.59106 | -0.96383 |
16. Jari (E) | 0°49’45.06"S 52°24’23.10"W | 5 | 1 | 0 | 0 | 0 | 0 |
Total |
| 397 | 64 | 0.505 +/- 0.030 | 0.0038 +/- 0.0024 | -2.31311** | -27.16282** |
Of the 64 haplotypes found, two were represented in the majority of silver arowana individuals, the most common shared by 277 (69.77%) individuals and the second most common shared by 36 (9.06%) individuals (Fig. 4). The second most common haplotype was primarily found in the western Amazon basin, specifically in localities upstream of the Purus River. In contrast, the most common haplotype was distributed throughout the basin, with the exception of the Juruá locality, where the seven unique haplotypes are all derived from the second most common haplotype. Of the remaining shared haplotypes, eight were shared with individuals from two or more localities, three were shared only between individuals from localities west of the basin and two only between individuals from localities east of the basin. Forty-nine singletons located peripherally in the haplotype network were also identified (Fig. 4). Borba, Oriximiná and Jari presented only one haplotype each. In Fig. S2, the diversity of haplotypes of the arowana populations for the western and eastern regions of the Amazon basin can be observed.

FIGURE 4| Haplotype network from the individuals of Osteoglossum bicirrhosum. Circles with numbers represent observed haplotypes and their frequencies. Unlabeled small circles represent missing haplotypes. Haplotypes are connected by single mutational steps represented by a line. The western and eastern regions of the Amazon basin are identified.
The two tests (Tukey and Duncan tests) resulted in a significant ANOVA (p < 0.05) for the main genetic indices (H, h and π), showing that the localities in the western Amazon basin are genetically different from the locations in the east (Tab. S3).
Analysis of historical demography. Considering all localities, the mismatch distribution graph revealed a unimodal curve (Fig. S4A), a graphical representation indicative of demographic expansion (Rogers, Harpending, 1992). Analyzing the eastern (Fig. S4B) and western (Fig. S4C) regions separately, the western presented a unimodal allelic distribution. Out of the 16 locations that were analyzed, a total of eight exhibited significant values in the neutrality tests. The majority of these localities were in western Amazonia. These results suggest that there has been a population expansion for these populations in the Amazon basin. The same pattern was found with the Bayesian Skyline Plot analysis where both groups showed population expansion starting about 100,000 years ago (Fig. S5).
Discussion
Population structure and genetic diversity. The results overall demonstrate a genetic structure that spans from west to east. This structure is strongly associated with isolation by distance, and it is observed that there is greater genetic diversity and population structure between localities in the western region. This probably occurs because the western localities are made up of individuals from two population groups. This result suggests that the origin of the genetic diversity of the silver arowana was in the western Amazon, with less diversity in populations occurring in the eastern Amazon as a result of more recent colonization in this region. Populations with greater values of genetic diversity indices, especially nucleotide diversity, would be older (ancestors) (Antonelli et al., 2010), therefore, these indexes can be used as indicators of ancestry (Cheviron et al., 2005). Oberdorff et al. (2019) also suggest that the western Amazon basin was the main center of fish diversity, with dispersal progressing eastward after the union of the eastern and western basins when the Amazon River reached its current course.
Analyzing the two regions comparatively, higher values of h and π remained in the western Amazon basin, while in the east, both indices were low, suggesting a recent bottleneck or founder effect with few mitochondrial DNA lineages (Grant, Bowen, 1998), which reinforces the recent colonization of the eastern Amazon from the western Amazon basin. This result is also supported by the topology of the haplotype network (Fig. 4), which shows a star-shaped pattern with several rare haplotypes. Such a pattern suggests a genetic bottleneck and population expansion, as reported by Slatkin, Hudson (1991). It is also interesting to note that several localities in the west of the Amazon basin have representatives of the two main haplotypes, contributing to the greater diversity in this region (see Fig. S2).
In the analysis of the silver arowana from all 16 localities, Juruá and Tabatinga, which are situated in the western part of the basin, exhibited significant negative values in the neutrality tests (Tab. 2), which is another indication of demographic expansion (Hartl, Clark, 1997). The findings were further reinforced by the observation of a unimodal curve of mismatch distribution in the Juruá locality, as shown in the supplementary material (Fig. S4D). This provides additional support for the hypothesis that there has been a recent demographic expansion of this species in the western Amazon (Rogers, Harpending, 1992).
The population structure observed in the silver arowana can be explained by its sedentary behavior (Barthem, Fabré, 2004) and probably by the large size of its eggs, which make dispersal difficult (Rabello-Neto, Chao, 2008). According to Planes et al. (2001) and Stepien et al. (2001), genetic differentiation is more frequent in species with restricted migratory habits, without pelagic larval stage and mechanisms of larval retention, some of these characteristics being found in the silver arowana and which may have helped to promote population differentiation. The Mantel test results support the hypothesis of a low dispersal rate, indicating that the observed genetic structure is closely tied to isolation by distance.
This pattern of genetic structure was also observed in silver arowana populations from the Peruvian Amazon (Chota-Macuyama et al., 2016) and the Tocantins-Araguaia basin (Souza et al., 2019). Chota-Macuyama et al. (2016) identified significant genetic structure across five localities in the Loreto region by employing microsatellite markers. They proposed that the combination of geographic distance and the species’s relatively sedentary behavior could account for this structure. Souza et al. (2019), analyzing single-locus polymorphisms (SNPs), found a clear separation between the silver arowana populations of the Amazon and Tocantins-Araguaia basins, with lower diversity in the latter, indicating that this population may reach a vulnerable conservation status more quickly. The authors attribute this differentiation to the species’s sedentary behavior and to past climatic and geological events that influenced its current distribution. These results are also in agreement with those found by Duponchelle et al. (2012), who analyzed the growth rate of arowana populations in the Amazon, Ucayali, Putumayo and Napo rivers and found that O. bicirrhosum had significantly greater growth in the Amazon River than in the other rivers. The results indicated the existence of important variability in the growth capacity of the silver arowana between the river basins analyzed and may be the result of the phenotypic plasticity of the species due to environmental heterogeneity or the existence of several distinct populations in Peru, which may need to be managed independently (Duponchelle et al., 2012).
The genetic structure has also been observed in other Osteoglossiformes species, but for different reasons. For instance, the Indian knifefish Chitala chitala exhibits genetic structuring among populations that is not associated with geographic distances (Mandal et al., 2012; Dutta et al., 2020). Additionally, in the case of Scleropages formosus, genetic and morphological structure has been linked to the potential emergence of new species (Pouyaud et al., 2003).
According to Oberdorff et al. (2019), the main center of fish diversity was located in the west, with fish dispersal moving eastward after the union of the basins and the establishment of the modern course of the Amazon River (towards the Atlantic). Salgueiro et al. (2022), using a large data set on freshwater fish distribution in the Amazon basin, found a significant pattern of fish assemblage phylogenetic diversity along the Amazon western-eastern gradient, with western Amazon sub-drainages hosting assemblages more phylogenetically clustered (higher rates of recent speciation), but less phylogenetically diverse than their eastern counterparts. The other bony tongue species from the Amazon basin, Arapaima gigas, also shows a western-eastern pattern of population structure associated with isolation by distance (Farias et al., 2019). Interestingly, this historical pattern of the western-eastern Amazon has been associated with the division of the Amazon basin by the Purus Arc.
According to Hubert, Renno (2006), the biogeographic pattern of Characiformes found in the western part of the Amazon is the result of the process of elevation of the Andes and the formation of paleoarches since these geological structures promoted allopatric divergences through the establishment of disconnected floodplains. According to Albert et al. (2011), the structural arches can influence the geomorphology of the river, and this is reflected on the biogeography of fish species. In the Purus Arch region (located between the Purus River and Manaus), for example, the Solimões-Amazonas River valley narrows to almost half its width, with a greater deposition of sediment. These changes in the course of the river make the migration rate of the species in this part of the channel insignificant (Mertes et al., 1996). Therefore, one possible explanation for the distribution of genetic diversity in silver arowana can be attributed to historical dispersal from west to east. This dispersal is thought to have occurred due to the break of the Purus arc that was estimated to have occurred around 9.4 Mya (Albert et al., 2018). It is hypothesized that this historical process led to the dispersal of individuals over generations, resulting in the structure of isolation by distance seen in contemporary populations. This arch restricted the great Pebas Lake to the western portion of the Amazon and represented a barrier that separated the two sub-basins, Solimões (west) and Amazonas (east), from the Paleozoic to the Miocene or Pliocene (Bemerguy, Costa, 1991; Albert et al., 2018). According to Hubert and Renno (2006), this structure was a great divider of fauna, directly influencing the distribution of the populations of many species of fish. The silver arowana are structured along the Solimões-Amazonas system, with a west-east pattern of population structure, a pattern also present in other species of fish, such as cichlids of the genus Symphysodon (Farias, Hrbek, 2008) and Astronotus (Colatreli et al., 2012).
In addition to this west-east separation, our results show that fish from upper Juruá River (western portion of the basin) are genetically differentiated from the others suggesting that gene flow is probably very restricted or nonexistent. This structuring could be related to the intense geological changes that occurred in the Juruá River basin as a result of the uplift of several structural arches (Caputo, 2014a). The upper portion of the Juruá River was separated from the rest of the basin by the presence of the Jutaí arch, which separated the Eirunepé sub-basin, disconnecting it from the Solimões basin (Caputo, 2014b).
On the other hand, a significant departure from neutrality in many localities provides evidence of historical demographic events of population expansion, which was also suggested by a Bayesian skyline analysis with a steep increase in population size suggesting a population expansion starting about 100,000 years ago. The timing and magnitude of changes in population size can provide insights into historical events such as colonization, climatic changes, or anthropogenic impacts. The analysis using Bayesian skyline revealed a significant increase in population size during the middle Pleistocene. This period was characterized by shifting global climate patterns, as well as changes in rainfall patterns and ocean levels in the Amazonas River Basin (Hoorn et al., 2010; Vonhof, Kaandorp, 2010).
While caution is essential when drawing inferences from the Bayesian skyline analysis due to the potential influence of various variables that may introduce errors in reconstructing demographic history (Grant, 2015), it is probable that O. bicirrhosum and other Amazon fish species have responded to these environmental changes through population expansions and contractions. In fact, studies of Amazon conservation genetics have commonly observed population expansions during the Plio-Pleistocene period (e.g., Hrbek et al., 2005; Farias et al., 2010; Machado et al., 2017).
While mitochondrial genes are suitable markers for population analyses and they do retain signal of relatively recent events, more suitable markers, such as SNPs will better inform us about the current state and distribution of genetic diversity in O. bicirrhosum.
Implications for the conservation and management of the silver arowana in the Brazilian Amazon. The silver arowana (Osteoglossum bicirrhosum) became a significant target of the ornamental fish trade after the inclusion of the Asian arowana (Scleropages formosus) in the endangered species list. With the ban on fishing for Asian species, the silver arowana emerged as a substitute, leading to an increase in its export rate (Moreau, Coomes, 2006) and making this species increasingly popular in the international ornamental fish market. In addition to trade for ornamental purposes, the silver arowana is also exploited for consumption. According to Maldonado et al. (2017), in Brazil, fishing for consumption already shows signs of being unsustainable.
Although data on fish landings in the Amazon are not up to date, fisheries data obtained by IBAMA up to 2011 showed that arowana landings had been decreasing over the years, falling from 11th place in 2007 to 28th place between 2008 and 2010 (ICMBio, 2011; Maldonado et al., 2017). Thus, the information on the genetic diversity of this species generated in this study will help in establishing conservation and management plans for this important fishery resource. According to Galetti Jr. et al. (2008), species conservation requires an understanding of evolutionary history, geographic distribution patterns, and genetic structuring. Such plans must cover all countries where the silver arowana is distributed; there must be a joint effort by all the components involved to preserve such an important resource for different economic activities (food and ornamental fish).
Currently, there are some protection measures for this species under Brazilian legislation, one of which is the prohibition of fishing for ornamental purposes (IBAMA, 2008). However, this measure is not being efficient for the conservation of the silver arowana in Brazil. Due to the depleted stocks of the silver arowana in Colombia (Maldonado, Lasso, 2014), cross-border traders are now venturing into Brazil to buy fish, which increases illegal capture in the country. This situation is aggravated by the results found in this study, which show genetically structured arowana populations in the western Amazon.
The management of transboundary fisheries in the Amazon is highly complex due to multiple dimensions: environmental, economic, political and social (Maldonado et al., 2017) and to date, the management policies established by Colombia, Peru and Brazil to manage ornamental fisheries of silver arowana were unsuccessful (Maldonado et al., 2017), although fishing for this purpose is prohibited in Brazil. Thus, we consider that our results are extremely important to help create a management plan for this species, which is so important for different Amazonian countries. It is important to implement concrete and effective conservation measures, such as fishing regulations, species-specific legislation and increased monitoring to prevent fishing during the breeding season. Captive breeding of silver arowana has shown promise (Paz et al., 2016; Trujillo et al., 2017; Oliveros et al., 2018) and could be an alternative to extractive fishing, in addition to helping to maintain wild populations.
Acknowledgments
We thank the reviewers for their important contributions. We also thank our colleagues at the Laboratory of Evolution and Animal Genetics (LEGAL) of the Universidade Federal do Amazonas (UFAM) who helped in several stages of this work, especially Mário Nunes and Aline Ximenes who helped us with improving the figures. This study was financed in part by the Coordenação de Aperfeiçoamento de Pessoal de Nível Superior – Brasil (CAPES) – Finance Code 001. This study was conducted as part of TJS’s PhD thesis in the UFAM Biotechnology Program and was supported by a CAPES fellowship.
References
Albert JS, Carvalho TP, Petry P, Holder MA, Maxime EL, Espino J et al. Aquatic biodiversity in the Amazon: habitat specialization and geographic isolation promote species richness. Animal. 2011; 1(2):205–41. https://doi.org/10.3390/ani1020205
Albert JS, Val P, Hoorn C. The changing course of the Amazon River in the Neogene: center stage for Neotropical diversification. Neotrop Ichthyol. 2018; 16(3):e180033. https://doi.org/10.1590/1982-0224-20180033
Antonelli A, Quijada-Mascareñas A, Crawford AJ, Bates JM, Velazco PM, Wüster W. Molecular studies and phylogeography of Amazonian tetrapods and their relation to geological and climatic models. In: Hoorn C, Wesselingh FP, editors. Amazonia: landscape and species evolution: a look into the past. Hoboken: Wiley-Blackwell; 2010. p.386–404.
Autoridad Nacional de Acuicultura y Pesca (AUNAP). Servicio Estadistico Pesquero Colombiano (SEPEC). Informes Ornamentales, Produccion Ornamentales, Especie. [Internet]. 2023. Available from: http://sepec.aunap.gov.co/InformesOrnamentales/ProduccionOrnamentalesEspecie
Barthem RB, Fabré NN. Biologia e diversidade dos recursos pesqueiros da Amazônia. In: Ruffino ML, editor. A pesca e os recursos pesqueiros na Amazônia Brasileira. Manaus: Provárzea-IBAMA; 2004. p.17–62.
Beltrão H, Magalhaes ERS, Benzaken ZS, Sousa RGC. Trafficking of ornamental fish in the brazilian Amazon. Bol Inst Pesca. 2021; 47:e639. https://doi.org/10.20950/1678-2305/bip.2021.47.e639
Bemerguy RL, Costa JBS. Considerações sobre a evolução do sistema de drenagem da Amazônia e sua relação com o arcabouço tectônico-estrutural. Museu Paraense Emílio Goeldi, série Ciências da Terra. 1991; 3:75–97.
Bermingham E, McCafferty SS, Marin AP. Fish biogeography and molecular clocks: perspectives from the Panamanian Isthmus. In: Kocher TD, Stepien CA, editors. Molecular systematics of fishes. San Diego: Academic Press; 1997. p.113–28. https://doi.org/10.1016/B978-012417540-2/50009-9
Brown CL. Raising the silver arowana (Osteoglossum bicirrhosum). CTSA. 1995; 117; 1–5.
Caputo MV. Juruá orogeny: Brazil and Andean Countries. Brazilian J Geol. 2014a; 44(2):181–90. https://doi.org/10.5327/Z2317-4889201400020001
Caputo MV. Bacia do Solimões: estratigrafia, tectônica e magmatismo. Technical Report. 2014b; 1–40.
Cheviron ZA, Hackett SJ, Capparella AP. Complex evolutionary history of a Neotropical lowland forest bird (Lepidothrix coronata) and its implications for historical hypotheses of the origin of Neotropical avian diversity. Mol Phylogenet Evol. 2005; 36(2):338–57. https://doi.org/10.1016/j.ympev.2005.01.015
Chota-Macuyama W, García-Dávila C, Ruiz A, Duponchelle F, Castro-Ruiz D, Chu-Koo F et al. Primer estudio de la variabilidad genética de la arahuana Osteoglossum bicirrhosum (Cuvier, 1829) en la región Loreto (Amazonía peruana). Folia Amazónica. 2016; 25(1):95–100. https://doi.org/10.24841/fa.v25i1.390
Colatreli OP, Meliciano NV, Toffoli D, Farias IP, Hrbek T. Deep phylogenetic divergence and lack of taxonomic concordance in species of Astronotus (Cichlidae). Int J Evol Biol. 2012; (4):1–08. https://doi.org/10.1155/2012/915265
Conselho Estadual de Meio Ambiente do Amazonas (CEMAAM). Resolução No 24, de 18 Agosto de 2017. Diário Oficial do Estado do Amazonas, AM, 14 de setembro de 2017.
Corander J, Waldmann P, Sillanpää MJ. Bayesian analysis of genetic differentiation between populations. Genetics. 2003; 163(1):367–74. https://doi.org/10.1093/genetics/163.1.367
Costa TV, Silva ECS, Oshiro LMY. O potencial do aruanã Osteoglossum bicirrhosum (Vandelli, 1829) (Osteoglossiformes, Osteoglossidae) para a criação em cativeiro. Acta Amazon. 2009; 39(2):439–46. https://doi.org/10.1590/S0044-59672009000200024
Dagosta FCP, de Pinna M. The fishes of the Amazon: distribution and biogeographical
patterns, with a comprehensive list of species. Bull Am Mus Nat Hist. 2019; 413:1–163. https://doi.org/10.1206/0003-0090.431.1.1
Darriba D, Taboada GL, Doallo R, Posada D. jModelTest 2: more models, new heuristics and parallel computing. Nat Methods. 2012; 9(8):772. https://doi.org/10.1038/nmeth.2109
Doyle JJ, Doyle JL. A rapid DNA isolation procedure for small quantities of fresh leaf tissue. Phytochem Bull. 1987; 19(1):11–15.
Drummond AJ, Rambaut A. BEAST: Bayesian evolutionary analysis by sampling trees. BMC Evol Biol. 2007; 7(1):1–08. https://doi.org/10.1186/1471-2148-7-214
Duncan WP, Fernandes MN. Physicochemical characterization of the white, black, and clearwater rivers of the Amazon basin and its implications on the distribution of freshwater stingrays (Chondrichthyes, Potamotrygonidae). Panamjas. 2010; 5(3):454–64.
Duponchelle F, Arce AR, Waty A, Panfili J, Renno JF, Farfan F et al. Contrasted hydrological systems of the Peruvian Amazon induce differences in growth patterns of the silver arawana, Osteoglossum bicirrhosum. Aquat Living Resour. 2012; 25(1):55–66. https://doi.org/10.1051/alr/2012005
Dutta N, Singh RK, Pathak A, Mohindra V, Mandal S, Kaur G et al. Mitochondrial DNA markers reveal genetic connectivity among populations of Osteoglossiform fish Chitala chitala. Mol Biol Rep. 2020; 47(11):8579–92. https://doi.org/10.1007/s11033-020-05901-w
Excoffier L, Lischer HEL. Arlequin suite ver 3.5: an integrated software package for population genetics data analysis. Mol Ecol Resour. 2015; 10(3):564–67. https://doi.org/10.1111/j.1755-0998.2010.02847.x
Farias IP, Hrbek T. Patterns of diversification in the discus fishes (Symphysodon spp. Cichlidae) of the Amazon basin. Mol Phylogenet Evol. 2008; 49(1):32–43. https://doi.org/10.1016/j.ympev.2008.05.033
Farias IP, Torrico JP, García-Dávila C, Santos MDCF, Hrbek T, Renno JF. Are rapids a barrier for floodplain fishes of the Amazon basin? A demographic study of the keystone floodplain species Colossoma macropomum (Teleostei: Characiformes). Mol Phylogenet Evol. 2010; 56(3):1129–35. https://doi.org/10.1016/j.ympev.2010.03.028
Farias IP, Willis S, Leão A, Verba JT, Crossa M, Foresti F et al. The largest fish in the world’s biggest river: genetic connectivity and conservation of Arapaima gigas in the Amazon and Araguaia-Tocantins drainages. PLoS ONE. 2019; 14(8):e0220882. https://doi.org/10.1371/journal.pone.0220882
Fu Y-X. Statistical tests of neutrality of mutations against population growth, hitchhiking and background selection. Genetics. 1997; 147(2):915–25. https://doi.org/10.1093/genetics/147.2.915
Galetti Jr. PM, Rodrigues FP, Solé-Cava A, Miyaki CY, Carvalho D, Eizirik E et al. Genética da conservação na biodiversidade brasileira. In: Frankham R, Ballou JD, Briscoe DA, editors. Fundamentos de genética da conservação. Ribeirão Preto: Editora SBG; 2008.p.199–229.
García-Dávila C, Estivals G, Mejia J, Flores M, Angulo C, Sánchez H et al. Peces ornamentales de la Amazonía peruana. Instituto de Investigaciones de la Amazonia Peruana (IIAP). Iquitos, Perú; 2021.
Grant WS. Problems and cautions with sequence mismatch analysis and bayesian skyline plots to infer historical demography. J Hered. 2015; 106(4):333–46. https://doi.org/10.1093/jhered/esv020
Grant WS, Bowen BW. Shallow population histories in deep evolutionary lineages of marine fishes: Insights from sardines and anchovies and lessons for conservation. J Hered. 1998; 89(5):415–26. https://doi.org/10.1093/jhered/89.5.415
Hall T. BioEdit: a user-friendly biological sequence alignment editor and analysis program for Windows 95/98/NT. Nucleic Acids Symp Ser. 1999; 41(41):95–98.
Hartl DL, Clark AG. Principles of population genetics. 3 ed. Sinauer Associates. Sunderland Massachusetts; 1997.
Hoorn C, Wesselingh FP, ter Steege H, Bermudez MA, Mora A, Sevink J et al.Amazonia through time: Andean uplift, climate change, landscape evolution, and biodiversity. Science. 2010; 330(6006):927–31. https://doi.org/10.1126/science.1194585
Hrbek T, Farias IP, Crossa M, Sampaio I, Porto JIR, Meyer A. Population genetic analysis of Arapaima gigas, one of the largest freshwater fishes of the Amazon basin: Implications for its conservation. Anim Conserv. 2005; 8(3):297–308. https://doi.org/10.1017/S1367943005002210
Hubert N, Renno JF. Historical biogeography of South American freshwater fishes. J Biogeogr. 2006; 33(8):1414–36. https://doi.org/10.1111/j.1365-2699.2006.01518.x
Inoue JG, Mya M, Tsukamoto K, Nishida M. A mitogenic perpective on the basal teleostean phylogeny resolving higher-level relationships with longer DNA sequence. Mol Phylogent Evol. 2001; 20(2):275–85. https://doi.org/10.1006/mpev.2001.0970
Instituto Brasileiro do Meio Ambiente e dos Recursos Naturais Renováveis (IBAMA). Instrução Normativa Nᵒ 203, de 22 de outubro de 2008. Dispõem sobre normas, critérios e padrões para a explotação com finalidade ornamental e de aquariofilia de peixes nativos ou exóticos de águas continentais. Diário Oficial da União. Brasília, DF, 24 de outubro de 2008.
Instituto Chico Mendes de Conservação da Biodiversidade (ICMBio). Boletim estatístico da pesca e aquicultura [Internet] 2011. Ministério do Meio Ambiente. Available from: http://www.Icmbio.gov.br/cepsul/images/stories/biblioteca/download/estatistica/est_2011_bol_bra.pdf
Isaac VJ, Fabré NN, Silva CO, Ruffino ML, Saint-Paul U. Ecologia da fauna ictíica. In: Battista VS, Isaac VJ. Peixes e pesca no Solimões-Amazonas: uma avaliação integrada. Brasília: IBAMA, 2012. p.207–49.
Jombart T. adegenet: a R package for the multivariate analysis of genetic markers. Bioinformatics. 2008; 24:1403–05. https://doi.org/10.1093/bioinformatics/btn129
Kumazawa Y, Nishida M. Molecular phylogeny of Osteoglossoids: a new model for Gondwanian origin and Plate Tectonic Transportation of the Asian Arowana. Mol Biol Evol. 2000; 17(12):1869–78. https://doi.org/10.1093/oxfordjournals.molbev.a026288
Librado P, Rozas J. DnaSP v5: a software for comprehensive analysis of DNA polymorphism data. Bioinformatics. 2009; 25(11):1451–52. https://doi.org/10.1093/bioinformatics/btp187
Lima AC, Prang G. Demandas para o manejo e conservação do aruanã branco, Osteoglossum bicirrhosum (Cuvier, 1829), na região do médio rio Solimões. In: Queiroz HL, Camargo M, editors. Biologia, conservação e manejo dos aruanãs na Amazônia Brasileira. Tefé: IDSM; 2008. p.15–26.
Liu Y, Bian C, Ma KY, Yang Y, Wang Y, Liu C et al. Reference genome provide insights into sex determination of silver aworana (Osteoglossum bicirrhosum). BMC Biol. 2025; 23:29. https://doi.org/10.1186/s12915-025-02139-5
Machado VN, Willis SC, Teixeira AS, Hrbek T, Farias IP. Population genetic structure of the Amazonian black flannelmouth characin (Characiformes, Prochilodontidae: Prochilodus nigricans Spix & Agassiz, 1829): contemporary and historical gene flow of a migratory and abundant fishery species. Environ Biol Fish. 2017; 100:1–16. https://doi.org/10.1007/s10641-016-0547-0
Maldonado AG, Lasso CA. Análisis comparativo (1990-2014) de la pesquería de peces ornamentales em el departamento del Amazonas, Colombia. Biota Colomb. 2014; 15(1):83–108.
Maldonado AG, Lopes PFM, Fernández CAR, Alcala CAL, Sumalia UR. Transboundary fisheries management in the Amazon: Assessing current policies for the management of the ornamental silver arawana (Osteoglossum bicirrhosum). Mar Policy. 2017; 76:192–99. https://doi.org/10.1016/j.marpol.2016.11.021
Maldonado-Ocampo JA, Vari RP, Usma JS. Checklist of the freshwater fishes of Colombia. Biota Colomb. 2008; 9(2):143–237.
Mandal A, Mohindra V, Singh RK, Punia P, Singh AK, Lal KK. Mitochondrial DNA variation in natural populations of endangered Indian Feather-Back Fish, Chitala chitala. Mol Biol Rep. 2012; 39(2):1765–75. https://doi.org/10.1007/s11033-011-0917-9
Mantel N. The detection of disease clustering and a generalized regression approach. Cancer Res. 1967; 27:209–20.
Mascarenhas R. Biologia reprodutiva do aruanã preto Osteoglossum ferreirai Kanazawa 1966, no município de Barcelos, médio rio Negro, AM-Brasil. In: Queiroz HL, Camargo M, editors. Biologia, conservação e manejo dos aruanãs na Amazônia Brasileira. Tefé: IDSM; 2008. p.87–103.
Mertes LAK, Dunne T, Martinelli LA. Channel-floodplain geomorphology along the Solimões-Amazon River, Brazil. GSA Bulletin. 1996; 108(9):1089–107. https://doi.org/10.1130/0016-7606(1996)108<1089:CFGATS>2.3.CO;2
Mojica JI, Castellanos C, Usma J, Álvarez R. Libro rojo de peces dulceacuícolas de Colombia. Serie Libros Rojos de Especies Amenazadas de Colombia. Universidad Nacional de Colombia y Ministerio del Medio Ambiente, Bogotá; 2002.
Mojica JI, Oviedo JSU, León RÁ, Lasso CA. Libro rojo de peces dulceacuícolas de Colombia. Instituto de Investigación de Recursos Biológicos Alexander von Humboldt, Instituto de Ciencias Naturales de la Universidad Nacional de Colombia. Bogotá; 2012.
Moreau MA, Coomes OT. Potential threat of the international aquarium fish trade to silver arawana Osteoglossum bicirrhosum in the Peruvian Amazon. Oryx. 2006; 40(2):152–60. https://doi.org/10.1017/S0030605306000603
Mu X-d, Song H-m, Wang X-j, Yang Y-x, Luo D, Gu D-e et al. Genetic variability of the Asian arowana, Scleropages formosus, based on mitochondrial DNA genes. Biochem Syst Ecol. 2012; 44:141–48. https://doi.org/10.1016/j.bse.2012.04.017
Nelson JS, Grande TC, Wilson MVH. Fishes of the World. 5th Edition. Hoboken: John Wiley and Sons; 2016.
Oberdorff T, Dias MS, Jézéquel C, Albert JS, Arantes CC, Bigorne R et al. Unexpected fish diversity gradients in the Amazon basin. Sci Adv. 2019; 5(9):1–09. https://doi.org/10.1126/sciadv.aav8681
Oliveros SL, Hernández-Paniagua KJ, Pimentel-Parra GA, Murcia-Ordoñez B, Chaves-Moreno LC. Evaluation of the efficiency of three incubator models with different flows in larval development of Osteoglossum bicirrhosum (silver arowana). RIVEP. 2018; 29(2):514–21. https://doi.org/10.15381/rivep.v29i2.12681
Paz MA, Meneses JR, López JM. Digestibility of diets with flour fish silage for the growing of arawana (Osteoglossum bicirrhossum). Rev MVZ Cordoba. 2016; 21(1):5177–88. Available from: http://www.scielo.org.co/scielo.php?script=sci_arttext&pid=S0122-02682016000100009&lng=en&nrm=iso
Planes S, Doherty PJ, Bernardi G. Strong genetic divergence among populations of a marine fish with limited dispersal, Acanthochromis polyacanthus, within the great barrier reef and the coral sea. Evolution. 2001; 55(11):2263–73. https://doi.org/10.1111/j.0014-3820.2001.tb00741.x
Pouyaud L, Sudarto T, Teugels GG. The different colour varieties of the Asian arowana Scleropages formosus (Osteoglossidae) are distinct species: morphologic and genetic evidence. Cybium. 2003; 27(4):287–305. Available from: http://113.160.249.209:8080/xmlui/handle/123456789/15807
Queiroz HL, Camargo M. Biologia, conservação e manejo dos aruanãs na Amazônia Brasileira, Tefé: IDSM; 2008.
R Development Core Team. R: a language and environment for statistical computing [Internet]. Vienna, Austria: R Foundation for Statistical Computing; 2018. Available from: http://www.r-project.org
Rabello-Neto JG, Chao NL. Biologia reprodutiva do aruanã preto Osteoglossum ferreirai Kanazawa 1966, no município de Barcelos, médio rio Negro, AM-Brasil. In: Queiroz HL, Camargo M, editors. Biologia, conservação e manejo dos aruanãs na Amazônia Brasileira. Tefé: IDSM; 2008. p.133–40.
Reis RE, Kullader SO, Ferraris Jr. CJ. Check list of the freshwater fishes of South and Central America. Porto Alegre: Edipucrs; 2003.
Rice WR. Analyzing tables of statistical tests. Evolution, 1989; 43(1):223–25. https://doi.org/10.2307/2409177
Rogers AR, Harpending H. Population growth makes waves in the distribution of pairwise genetic differences. Mol Biol Evol. 1992; 9(3):552–69. https://doi.org/10.1093/oxfordjournals.molbev.a040727
Salgueiro L, Cassemiro FA, Albert JS, Frederico RG, Hidalgo M, Hugueny B et al. Drivers of phylogenetic structure in Amazon freshwater fish assemblages. J Biogeogr. 2022; 49(2):310–23. https://doi.org/10.1111/jbi.14300
Salzburger W, Ewing GB, Von Haeseler A. The performance of phylogenetic algorithms in estimating haplotype genealogies with migration. Mol Ecol. 2011; 20(9):1952–63. https://doi.org/10.1111/j.1365-294X.2011.05066.x
Santos GM, Santos ACM. Sustentabilidade da pesca na Amazônia. Estud Av. 2005; 19(54):165–82. https://doi.org/10.1590/S0103-40142005000200010
Slatkin M, Hudson RR. Pairwise comparisons of mitochondrial DNA sequences in stable and exponentially growing populations. Genetics. 1991; 129(2):555–62. https://doi.org/10.1093/genetics/129.2.555
Souza FHS, Perez MF, Bertollo LAC, Oliveira EA, Lavoué S, Gestich CC et al. Interspecific genetic differences and historical demography in South American arowanas (Osteoglossiformes, Osteoglossidae, Osteoglossum). Genes. 2019; 10(9):693. https://doi.org/10.3390/genes10090693
Stamatakis A. RAxML version 8: a tool for phylogenetic analysis and post-analysis of large phylogenies. Bioinformatics. 2014; 30(9):1312–13. https://doi.org/10.1093/bioinformatics/btu033
Stepien CA, Rosenblatt RH, Bargmeyer BA. Phylogeography of the spotted sand bass, Paralabrax maculatofasciatus: divergence of Gulf of California and Pacific coast populations. Evolution. 2001; 55(9):1852–62. https://doi.org/10.1111/j.0014-3820.2001.tb00834.x
Tajima F. Statistical method for testing the neutral mutation hypothesis by DNA polymorphism. Genetics. 1989; 123(3):585–95. https://doi.org/10.1093/genetics/123.3.585
Thompson JD, Higgins DG, Gibson TJ. CLUSTALW: Improving the sensitivity of progressive multiple sequence alignment through sequence weighting, position-specific gap penalties and weight matrix choice. Nucleic Acids Res. 1994; 22(22):4673–80. https://doi.org/10.1093/nar/22.22.4673
Trujillo MDM, Rojas AM, Murcia B, Chaves LC, Pimentel GA. Evaluation of diets for arawana fingerlings (Osteoglossum bicirrhosum) in the amazon foothills of Colombia. Rev Vet. 2017; 28(2):145–51. Available from: http://revistas.unne.edu.ar/index.php/vet/article/view/2542/2248
Verba JT, Neto JGR, Zuanon J, Farias I. Evidence of multiple paternity and cooperative parental care in the so called monogamous silver arowana Osteoglossum bicirrhosum (Osteoglossiformes: Osteoglossidae). Neotrop Ichthyol. 2014; 12(1):145–51. https://doi.org/10.1590/S1679-62252014000100015
Vonhof HB, Kaandorp RJG. Climate variation in Amazonia during the Neogene and the quaternary. In: Hoorn C, Wesselingh FP, editors. Amazonia: landscape and species evolution: a look into the past. Oxford: Blackwell Publishing Ltd; 2010. p.201–10.
Yue GH, Ong D, Lim LC, Orban L. A strain-specific and a sex-associated sts marker for asian arowana (Scleropages formosus, Osteoglossidae). Aquac Res. 2003; 34(11):951–97. https://doi.org/10.1046/j.1365-2109.2003.00949.x
Wang XJ, Tian Y, Mu X, Liu Y, Liu C, Hu Y et al. The restriction site amplified polymorphism (RSAP) used for sex identification of Osteoglossum bicirrhosum. J Anim Sci Adv. 2013; 3(11):584–88.
Weir BS, Cockerham CC. Estimating F-statistic for the analysis of population structure. Evolution. 1984; 38(6):1358–70. https://doi.org/10.2307/2408641
Authors

![]() Themis Jesus Silva1
Themis Jesus Silva1 ![]() ,
, ![]() Valéria Nogueira Machado2,
Valéria Nogueira Machado2, ![]() Emerson Carlos Soares1,
Emerson Carlos Soares1, ![]() Tomas Hrbek2,3 and
Tomas Hrbek2,3 and ![]() Izeni Pires Farias2
Izeni Pires Farias2
[1] Laboratório de Aquicultura e Análise de Água (LAQUA), Campus de Engenharias e Ciências Agrárias (CECA), Universidade Federal de Alagoas (UFAL), BR-104, km 85, s/n, 57100-000 Rio Largo, AL, Brazil. (TJS) themisjdasilva@gmail.com (corresponding author), (ECS) soaemerson@gmail.com.
[2] Laboratório de Evolução e Genética Animal (LEGAL), Universidade Federal do Amazonas (UFAM), Av. Gen. Rodrigo Octávio 6200, Coroado I, 69080-900 Manaus, AM, Brazil. (VNM) valeria.pesca@gmail.com, (TH) tomas@evoamazon.net, (IPF) izeni@evoamazon.net.
[3] Biology Department, Trinity University, San Antonio, Texas, USA
Authors’ Contribution 

Themis Jesus Silva: Conceptualization, Data curation, Formal analysis, Investigation, Methodology, Writing-original draft, Writing-review and editing.
Valéria Nogueira Machado: Conceptualization, Data curation, Formal analysis, Investigation, Methodology, Writing-original draft, Writing-review and editing.
Emerson Carlos Soares: Formal analysis, Methodology, Software, Writing-original draft.
Tomas Hrbek: Conceptualization, Data curation, Formal analysis, Investigation, Methodology, Writing-original draft, Writing-review and editing.
Izeni Pires Farias: Conceptualization, Data curation, Formal analysis, Funding acquisition, Investigation, Methodology, Project administration, Resources, Supervision, Writing-original draft, Writing-review and editing.
Ethical Statement
All collections were carried out with authorization from IBAMA through permanent license No 11325–1.
Competing Interests
The author declares no competing interests.
How to cite this article
Silva TJ, Machado VN, Soares EC, Hrbek T, Farias IP. Genetic variability and population structure of Osteoglossum bicirrhosum (Osteoglossiformes: Osteoglossidae) in the Amazon basin. Neotrop Ichthyol. 2025; 23(2):e240085. https://doi.org/10.1590/1982-0224-2024-0085
Copyright
This is an open access article under the terms of the Creative Commons Attribution License, which permits use, distribution and reproduction in any medium, provided the original work is properly cited.
Distributed under
Creative Commons CC-BY 4.0

© 2025 The Authors.
Diversity and Distributions Published by SBI
![]() Accepted March 5, 2025
Accepted March 5, 2025
![]() Submitted August 23, 2024
Submitted August 23, 2024
![]() Epub May 26, 2025
Epub May 26, 2025