![]() Pedro Ivo C. C. Figueiredo1,2,
Pedro Ivo C. C. Figueiredo1,2, ![]() Luiz R. Malabarba1,3 and
Luiz R. Malabarba1,3 and ![]() Nelson J. R. Fagundes1,2,4
Nelson J. R. Fagundes1,2,4 ![]()
PDF: EN XML: EN | Supplementary: S1 | Cite this article
Abstract
Gymnogeophagus labiatus and G. lacustris have been long recognized as sister species exhibiting different ecological requirements. Gymnogeophagus labiatus occurs in rock bottom rivers in the hydrographic basins of Patos Lagoon (HBP) and Tramandaí River (HBT), while G. lacustris is exclusive from sand bottom coastal lagoons of the HBT. In this study, we used molecular markers, morphological measurements and data from nuptial male coloration to investigate the evolutionary relationship between these species in each hydrographic basin. We found, for all data sets, a closer relationship between G. labiatus and G. lacustris from the HBT than between G. labiatus populations from HBT and HBP. In particular, lip area had a large intraspecific plasticity, being uninformative to diagnose G. lacustris from G. labiatus. Molecular clock-based estimates suggest a recent divergence between species in the HBT (17,000 years ago), but not between G. labiatus from HBP and HBT (3.6 millions of years ago). Finally, we also found a divergent G. labiatus genetic lineage from the Camaquã River, in the HBP. These results show that the current taxonomy of G. labiatus and G. lacustris does not properly represent evolutionary lineages in these species.
Keywords: Ecological divergence, Iterative taxonomy, Mitochondrial DNA, Phenotypic plasticity, Tramandaí-Mampituba ecoregion.
Gymnogeophagus labiatus e G. lacustris vêm sendo consideradas espécies irmãs que possuem diferentes exigências ecológicas. Gymnogeophagus labiatus ocorre em rios de fundo de pedra nas bacias hidrográficas da Laguna dos Patos (HBP) e do rio Tramandaí (HBT), enquanto G. lacustris é exclusivo da HBT, ocorrendo em lagoas costeiras de fundo de arenoso. Nesse estudo, foram usados marcadores moleculares, medidas morfológicas e dados sobre a coloração nupcial em machos para investigar a relação evolutiva entre estas espécies em cada bacia hidrográfica. Para todos os conjuntos de dados foi observada uma relação mais próxima entre G. labiatus e G. lacustris da HBT do que entre as populações de G. labiatus da HBP e HBT. Em particular, a área do lábio teve uma grande plasticidade intraespecífica, não sendo informativa para diagnosticar G. lacustris de G. labiatus. Estimativas baseadas no relógio molecular sugeriram uma divergência recente entre as espécies da HBT (17.000 anos atrás), mas não entre as populações de G. labiatus da HBP e HBT (3,6 milhões de anos atrás). Finalmente, também foi encontrada uma linhagem genética de G. labiatus divergente no rio Camaquã, na HBP. Esses resultados mostram que a taxonomia atual de G. labiatus e G. lacustris não representa adequadamente as linhagens evolutivas nessas espécies.
Palavras-chave: Divergência ecológica, DNA mitocondrial, Ecorregião Tramandaí-Mampituba, Plasticidade fenotípica, Taxonomia iterativa.
Introduction
Cichlids comprise 1727 valid species showing a wide morphological diversity in the shape of the body and also in its color pattern (Fricke et al., 2021). Many morphological features contributing to such diversity evolved repeatedly in the adaptive radiations of both African and Neotropical cichlids, including characters with known adaptive roles, such as hypertrophic lips, which facilitate foraging in rocky substrate, and body color, which has an important role in sexual selection (Henning, Meyer, 2014; Meier et al., 2017). In the African cichlids, several studies have revealed extensive parallelism at the morphological level with relatively frequent hybridization events, making species delimitation a difficult task (Meier et al., 2017; Salzburger, 2018). In Neotropical cichlids, the role of hybridization has not been studied to the same extent, but genetic data for Cichla Bloch & Schneider, 1801 have also indicated extensive introgression, with important impacts for species delimitation and identification (Willis et al., 2012; Mourão et al., 2017; Diamante et al., 2021).
Cichlinae, the clade representing Neotropical cichlids, contains about one third (566 species) of all valid species for the family (Fricke et al., 2021). Among these, approximately half belong to Geophagini, a well-supported clade within Cichlinae with approximately 18 genera and 250 species distributed in South America and southern Panama (López-Fernández et al., 2010; Ilves et al., 2018). Gymnogeophagus Miranda Ribeiro, 1918 contains 19 valid species (Turcati et al., 2018; Alonso et al., 2019) showing two synapomorphies: a spinous process directed forward on top of the first dorsal pterygiophore (unique among Neotropical cichlids), and the absence of supraneurals (Reis, Malabarba, 1988). Representatives of this genus are distributed among the Paraná, Paraguay and Uruguay basins and in small coastal drainages of Uruguay and southern Brazil, with the exception of G. balzanii (Perugia, 1891), which also occurs in the Guaporé River, in the Amazon drainage (Malabarba et al., 2015; Loureiro et al., 2016; Casciotta et al., 2017).
Gymnogeophagus labiatus (Hensel, 1870) and G. lacustris Reis & Malabarba, 1988 have been recovered as sister species in morphological and mitochondrial DNA phylogenies (Reis, Malabarba, 1988; Wimberger, Reis, Thornton, 1998), and have been differentiated by the presence of hypertrophied lips in G. labiatus. This trait possibly represents an adaptation for foraging in rocky environments (Elmer et al., 2010; Burress et al., 2013), as shown by experimental studies in other cichlid species (Baumgarten et al., 2015; Henning et al., 2017). Indeed, G. labiatus has been recorded in rock bottom streams associated with lotic environments with transparent water (Reis, Malabarba, 1988) in the hydrographic basins of Patos Lagoon (HBP) and Tramandaí River (HBT) (Reis, Malabarba, 1988), with additional records from the Mampituba River, an isolated coastal drainage (Malabarba et al., 2013). In contrast, G. lacustris is restricted to lentic environments, in sandy bottom coastal lagoons in the HBT (Reis, Malabarba, 1988), where it shows a preference for environments with little submerged or emergent vegetation or with no vegetation at all (Malabarba et al., 2013). Both species are oral incubators and have marked sexual dimorphism in the reproductive season, when the dominant males develop a hump in the anterior region of the head. This feature may be used for display during the reproductive period or as an energy reserve during the period of parental care (Lowe-McConnell, 1999).
The HBT can be divided into two main ecological subregions (Malabarba, Isaia 1992) that match the habitats of G. labiatus and G. lacustris, respectively. The first is represented by the ancient rocky bottomed rivers and streams that flow in the Serra Geral slopes, where the Maquiné and Três Forquilhas rivers are the major water courses. The second is represented by the sandy lagoons of the Coastal Plain formed in the last 5,000 years following recurrent episodes of Laguna-Barreira marine transgressions that have been occurring since the last 400,000 years (Schwarzbold, Schäfer 1984; Villwock, 1984; Tomazelli, Villwock, 2000). The HBP also possesses rocky bottomed rivers and streams, widely inhabited by G. labiatus, but also sandy lagoons where no populations assignable to either G. labiatus or G. lacustris are found. These ecological differences make these species interesting biological models to study the emergence of ecological specialization. However, understanding such specialization requires a more thorough characterization of the evolutionary scenario involving these lineages.
For example, if the divergence between G. labiatus and G. lacustris represent reciprocally monophyletic lineages, the occurrence of the former species in HBT and HBP would probably represent a recent dispersal event from one drainage to another. Alternatively, the late emergence of HBT lagoons may suggest that G. lacustris originated from a relatively recent speciation event, in which populations related to G. labiatus occurring in HBT slopes colonized and adapted to this lentic environment. In this case, HBT populations assigned to G. labiatus and G. lacustris would be more related, making G. labiatus paraphyletic relative to G. lacustris. Thus, to be recognized as separate species, G. lacustris and G. labiatus populations from HBT must represent recognizable independent lineages (Wiley, 1978; de Queiroz, 2007; Malabarba et al., 2020). In either case, if enough genetic, ecological and morphological differences have accumulated in each of these three lineages (G. labiatus HBP, G. labiatus HBT, G. lacustris), they could be recognized as three different species.
However, because hypertrophic lips, the main feature separating G. labiatus from G. lacustris, have independently evolved several times among cichlids (Henning, Meyer, 2014), and is a polymorphic trait in some species (Machado-Schiaffino et al., 2014), another hypothesis is that the HBT populations could constitute a single cohesive evolutionary lineage, so that the morphological differences between species could be interpreted as ontogenetic and ecological differences between populations. In this case, G. labiatus and G. lacustris populations from the HBT should not be recognized as independent evolutionary lineages. Here, we used genetic markers, morphological measurements and color pattern to discuss these alternatives, which may have important taxonomic implications.
Material and methods
Sampling and laboratory methods. All individuals used in the study are deposited in the scientific collection of the Laboratory of Ichthyology, Departamento de Zoologia, Universidade Federal do Rio Grande do Sul, Porto Alegre (UFRGS). The taxonomic identification of all specimens was based on their external morphology (Reis, Malabarba, 1988). We used 78 individuals (60 G. labiatus and 18 G. lacustris) for the morphological analysis, and tissue samples from 61 individuals (36 G. labiatus and 25 G. lacustris) for the genetic analysis (Fig. 1; Tab. 1).
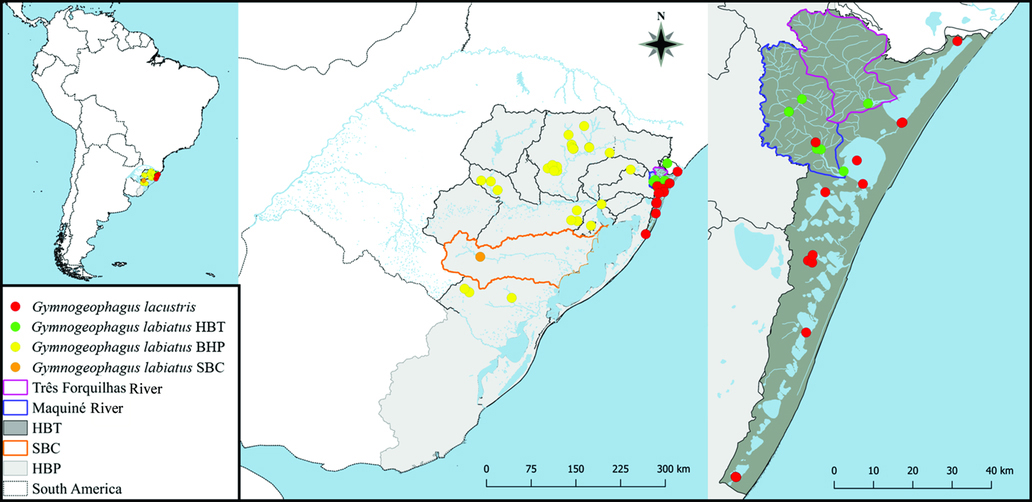
FIGURE 1 | Map with the distribution of all individuals used in the present study. The hydrographic basins of the Patos Lagoon (HBP) and the Tramandaí River (HBT), as well as the Camaquã Sub-Basin (CSB), are indicated on the map. The gray lines represent the watershed between basins or sub-basins in the study area. The red dots correspond to Gymnogeophagus lacustris, the green to G. labiatus HBT, the yellow to G. labiatus HBP and the orange to G. labiatus CSB.
TABLE 1 | Individuals and locations of Gymnogeophagus labiatus and G. lacustris included in the present study. 1Sample size for the molecular markers consider individuals characterized for both cytB and D-loop. 2Located in the Camaquã River sub-basin.
Voucher UFRGS | Species | Basin | Sampling size | Coordinates | Locality | |
Molecular1 | Morphology | |||||
3904 | G. labiatus | Patos | – | 2 | 31°37’00”S
53°41’00”W | Bagé, RS |
5924 | G. labiatus | Patos | – | 1 | 28°32’24”S
51°33’36”W | Guaporé, RS |
6381 | G. labiatus | Patos | – | 4 | 28°57’40”S
51°45’17”W | Cotiporã, RS |
6402 | G. labiatus | Patos | – | 1 | 28°53’04”S
51°47’28”W | Guaporé, RS |
6409 | G. labiatus | Patos | – | 2 | 28°56’23”S
51°46’47”W | Dois Lajeados,
RS |
6464 | G. labiatus | Patos | – | 1 | 28°56’01”S
51°28’01”W | Vila Flores, RS |
6596 | G. labiatus | Patos | – | 1 | 29°33’54”S
53°17’09”W | Agudo, RS |
6606 | G. labiatus | Patos | – | 1 | 31°32’59”S
53°46’17”W | Candiota, RS |
6962 | G. labiatus | Patos | – | 2 | – | Rio Carreiro,
RS |
8402 | G. labiatus | Patos | – | 2 | 31°43’10”S
52°53’59”W | Pedro Osório,
RS |
8800 | G. labiatus | Patos | – | 1 | 29°22’08”S
52°03’30”W | Lageado, RS |
8807 | G. labiatus | Patos | – | 1 | 29°19’21”S
52°14’03”W | Lageado, RS |
9978 | G. labiatus | Patos | – | 3 | 28°56’15”S
51°27’54”W | Veranópolis, RS |
10099 | G. labiatus | Patos | – | 1 | 28°57’47”S
51°45’43”W | Dois Lajeados,
RS |
10746 | G. labiatus | Patos | 1 | 1 | 30°06’02”S 51°41’40”W | Eldorado do Sul, RS |
14174 | G. labiatus | Patos | – | 4 | 29°17’35”S
52°03’44”W | Travesseiro, RS |
14317 | G. labiatus | Patos | – | 2 | 29°15’44”S
52°08’50”W | Marques de Souza, RS |
19659 | G. labiatus | Patos | – | 2 | 29°20’47”S
50°42’04”W | Canela, RS |
20360 | G. labiatus | Patos | 4 | 1 | 29°32’56”S
53°27’50”W | Faxinal do Soturno,
RS |
20396 | G. labiatus | Patos | 1 | – | 29°22’12”S
52°07’01”W | Forquetinha, RS |
20407 | G. labiatus | Patos | 2 | – | 29°43’31”S
53°09’39”W | Paraíso do Sul, RS |
22378 | G. labiatus | Patos | 2 | 2 | 30°23’00”S
51°26’00”W | Barra do Ribeiro, RS |
22379 | G. labiatus | Patos | 8 | 3 | 29°59’15”S
51°14’24”W | Eldorado do Sul, RS |
22380 | G. labiatus | Patos | – | 1 | 30°17’53”S
51°41’03”W | Barão do Triunfo,
RS |
22524 | G. labiatus | Patos | – | 2 | 28°42’12”S
51°50’57”W | Serafina Corrêa,
RS |
22719 | G. labiatus | Patos | – | 1 | 29°02’08”S
51°05’16”W | São Marcos, RS |
23018 | G. labiatus | Patos | 4 | 6 | 30°17’00”S
51°48’00”W | Barra do Ribeiro, RS |
22132 | G. labiatus | Patos2 | 1 | – | 30°57’35”S
53°28’52”W | Caçapava do Sul, RS |
17753 | G. labiatus | Tramandaí | 3 | 2 | 29°34’13”S
50°16’49”W | Maquiné, RS |
17761 | G. labiatus | Tramandaí | 2 | 5 | 29°32’56”S
50°04’13”W | Três Forquilhas,
RS |
18279 | G. labiatus | Tramandaí | – | 1 | 29°43’42”S
50°08’06”W | Maquiné, RS |
18437 | G. labiatus | Tramandaí | 1 | – | 29°34’14”S
50°16’49”W | Maquiné, RS |
18457 | G. labiatus | Tramandaí | 1 | – | 29°40’09”S
50°04’59”W | Maquiné, RS |
18464 | G. labiatus | Tramandaí | 2 | – | 29°40’08”S
50°12’24”W | Maquiné, RS |
19594 | G. labiatus | Tramandaí | 1 | – | 29°32’13”S
50°14’45”W | Barra do Ouro,
RS |
21101 | G. labiatus | Tramandaí | 3 | 2 | 29°39’07”S
50°12’34”W | Maquiné, RS |
21912 | G. labiatus | Tramandaí | – | 2 | 29°13’44”S
50°01’18”W | Praia Grande, SC |
3885 | G. lacustris | Tramandaí | – | 1 | 29°42’00”S
50°05’59”W | Capão da Canoa, RS |
3894 | G. lacustris | Tramandaí | – | 2 | 29°22’60”S
49°49’59”W | Torres, RS |
10751 | G. lacustris | Tramandaí | 6 | – | 30°32’26”S
50°25’12”W | Mostardas, RS |
16751 | G. lacustris | Tramandaí | – | 6 | 30°32’22”S
50°25’18”W | Mostardas, RS |
16915 | G. lacustris | Tramandaí | – | 1 | 29°35’56”S
49°58’44”W | Terra de Areia,
RS |
17246 | G. lacustris | Tramandaí | 6 | 1 | 30°32’22”S
50°25’18”W | Mostardas, RS |
17345 | G. lacustris | Tramandaí | – | 2 | 29°36’01”S
49°58’53”W | Terra de Areia,
RS |
17481 | G. lacustris | Tramandaí | 1 | 1 | 30°09’23”S
50°14’04”W | Cidreira, RS |
18273 | G. lacustris | Tramandaí | – | 1 | 29°39’07”S
50°12’33”W | Maquiné, RS |
18405 | G. lacustris | Tramandaí | – | 1 | 29°45’44”S
50°05’02”W | Capão da Canoa, RS |
18406 | G. lacustris | Tramandaí | – | 2 | 30°32’26”S
50°25’16”W | Mostardas, RS |
19081 | G. lacustris | Tramandaí | 4 | – | 29°57’56”S
50°13’46”W | Osório, RS |
19511 | G. lacustris | Tramandaí | 4 | – | 29°47’03”S
50°11’02”W | Osório, RS |
19570 | G. lacustris | Tramandaí | 3 | – | 29°58’16”S
50°13’07”W | Osório, RS |
19586 | G. lacustris | Tramandaí | 1 | – | 29°57’04”S
50°13’02”W | Osório, RS |
Specimens were obtained from the Patos Lagoon and Tramandaí-Mampituba ecoregions (Abell et al., 2008). The first includes all interconnected rivers and lagoons draining to the Patos Lagoon estuary. The second includes all interconnected lagoons draining to the Tramandaí Lagoon estuary, and can be further divided into two subsystems of interconnected lagoons (Schwarzbold, Schäfer 1984): one to the north of the Tramandaí Lagoon (formed by the Tramandaí River itself, Itapeva Lake, Quadros Lake, and a set of small lagoons in the municipality of Osório), and one to the south (including a string of interconnected lagoons reaching the Porteira Lake). We also included individuals sampled from isolated coastal lagoons (Bacopari Lake and Corvina Lake) that are presently mapped to the Patos Lagoon ecoregion (Abell et al., 2008) in order to understand the origin of its fish fauna.
For the molecular analysis, genomic DNA was obtained using the CTAB method adapted from Doyle, Doyle (1987). Two mitochondrial DNA (mtDNA) markers: Cytochrome B (cytB) and Control Region (D-loop) were amplified using the polymerase chain reaction (PCR) technique and specific primers (Palumbi et al., 2002; Sivasundar et al., 2001). The amplification reactions were prepared with 0.4 mM dNTP, 1.5 mM MgCl2, 0.5 μM of each primer, 1U Taq Polymerase and 40ng of genomic DNA. Amplification conditions for cytB consisted of 94ºC for 5’ and 10 cycles of 94ºC for 1’, 55ºC (−0.5ºC/cycle) for 1’ and 72ºC for 1’30”, followed by 30 cycles of 94ºC for 1’, 50ºC for 1’ and 72ºC for 1’30”, with a final extension of 72ºC for 5’. For D-loop, amplification conditions were 94ºC for 5’ and 10 cycles of 94ºC for 1’, 70ºC (−0.5ºC/cycle) for 1’ and 72ºC for 1’30”, followed by 30 cycles of 94ºC for 1’, 65ºC for 1’ and 72ºC for 1’30”, with a final extension of 72ºC for 5’. The success of the amplification was checked on a 1% agarose gel stained with GelRedTM (Biotium). The PCR products were enzymatically purified with Exonuclease I and Alkaline Phosphatase (ExoSAP) and sequenced by the Sanger method (Ludwig Biotec, Porto Alegre, Brazil). DNA sequencing was carried out in both directions (forward and reverse) for cytB, and only in the forward direction for the D-loop due to the presence of a repetitive region close to the annealing site of the reverse primer that caused poor reading quality. DNA sequencing was repeated from independent PCR amplifications whenever necessary to resolve ambiguities. We used Geneious 11.1.2 program (http://www.geneious.com/) to check the quality of the chromatograms and to assemble the consensus sequence for all individuals. The sequences were automatically aligned using ClustalW (Thompson et al., 1994) and edited in BioEdit (Hall, 1999). Sequences produced in the present study are available from the GenBank (cytB: MZ667483 – MZ667543; D-loop: MZ667544 – MZ667609).
Molecular data analysis. All analyses were performed with the concatenated cytB and D-loop mitochondrial markers. We retrieved from the GenBank cytB and D-loop sequences (GU736952 and MG581478, respectively) for G. setequedas Reis, Malabarba & Pavanelli, 1992, which was used as an outgroup. The list of distinct haplotypes was generated in the DnaSP 5.10.01 software (Librado, Rozas, 2009). The evolutionary relationship between haplotypes was estimated by the median-joining method (Bandelt et al., 1999) in the Network program (http://www.fluxus-engineering.com/) and by the Bayesian phylogenetic framework implemented in the package BEAST2 (Bouckaert et al., 2014). The best evolutionary model for each marker was estimated in Partition Finder (Lanfear et al., 2012) based on the Bayesian information criterion (BIC) (Sullivan, Joyce, 2005), which indicated four different substitution models: one for each cytB codon position (K80, HKY; TrN+G) and another for D-loop (HKY+I+G).
We estimated the age of the major clades by assuming, for both markers, a strict molecular clock model, which is generally well justified for analysis between closely related species (Li, Drummond, 2012; dos Reis et al., 2016). We assumed an evolutionary rate of 0.0024/site/million years (0.0019 – 0.0029/s/My) for cytB, which was inferred for Neotropical cichlids using a dataset with cytB and COI markers and fossil data to calibrate the phylogeny (Tougard et al., 2017). Because there was no prior information for the evolutionary rate of the D-loop, we assigned it to an unlinked clock partition whose rate was estimated relative to the cytB rate (e.g., Lambert et al., 2015; Ramos-Fregonezi et al., 2017). We assumed a lognormal prior distribution (M = 0.0, S = 2.0) for the D-loop rate can be estimated relative to the cytB rate. We used 100,000,000 steps in the Markov Chain Monte Carlo (MCMC) sampling every 1,000 steps and discarding the first 10,000,000 samples as burnin. We checked for convergence and sampling sufficiency in Tracer 1.7 (Rambaut et al., 2018) ensuring an effective sample size (ESS) >200 for all parameters.
The evolutionary relationship among populations was estimated using the STACEY module (Jones, 2017) implemented in BEAST2 (Bouckaert et al., 2014). In this strategy, individuals are classified into N “minimal clusters” a priori, and the number of potential species (ranging from one to N) is estimated based on the depth of coalescence of the genetic lineages within and between potential species, which is controlled by parameters collapse height (e) and collapse weight (w). In other words, the minimal clusters may be merged but not split to form potential species (Jones et al., 2015). Smaller values for e are more sensitive to recent divergences but may inflate the number of potential species. The parameter ω controls the number of potential species and can be used as a proxy for prior taxonomic knowledge (Matos-Maraví et al., 2019). We assumed minimal clusters of individuals: Gymnogeophagus setequedas, G. lacustris, G. labiatus HBT, G. labiatus HBP, and G. labiatus CSB (from the Camaquã River drainage), which showed a very divergent haplotype (see Results). We used different values for e between 0.001 and 0.00001 to evaluate its impact over species delimitation. The prior for w was set using a beta distribution between [0,1], with an initial value of 0.5. Priors for the Yule birth-death model were set to the default distributions. Priorsfor population size parameters were changed according to the program manual. For popPriorScale we used a lognormal prior distribution (M = -4.0, S = 2.0, respectively), while for the parameter popPriorInvGamma we used a mixture of four gamma distributions (a=1.0 b=1.0). The clock model was set as explained previously. We used 100,000,000 steps in the Markov Chain Monte Carlo (MCMC) sampling every 1,000 steps and discarding the first 10,000,000 steps as burnin. As before, we checked for convergence and sampling sufficiency in Tracer 1.7 (Rambaut et al., 2018) ensuring an effective sample size (ESS) >200 for all parameters.
We used the Analysis of Molecular Variance (AMOVA) (Excoffier et al., 1992) to measure the degree of genetic structure among groups based on Ф-statistics. For this analysis, we used the “minimal clusters” (with the exception of G. setequedas, see above) as populations: G. labiatus HBP, G. labiatus CSB G. labiatus HBT and G. lacustris (from HBT). We also estimated pairwise population differentiation based on Ф-statistics. All calculations were performed in Arlequin 3.5 (Excoffier, Lischer, 2010) using 10,000 permutations to assess statistical significance.
Morphological data analysis. For the morphological analyzes we use the linear measurements and counts following Malabarba et al. (2015), which are represented in Fig. 2A. The measurements were taken using a caliper with a precision of 0.05 mm, and the counts were made under the stereomicroscope. For measuring the lip area we took standardized photographs of all individuals in lateral view and measured the lip area using the software ImageJ (Abràmoff et al., 2004) (Fig. 2B). All linear measurements and photographs were taken from the specimens’ left side. To correct for allometry effects, all linear measurements were divided by the body standard length, while the lip area was divided by the total body area. All measurements were also transformed using logarithms to normalize the scale of variation among variables. We did not include sexually dimorphic characters.
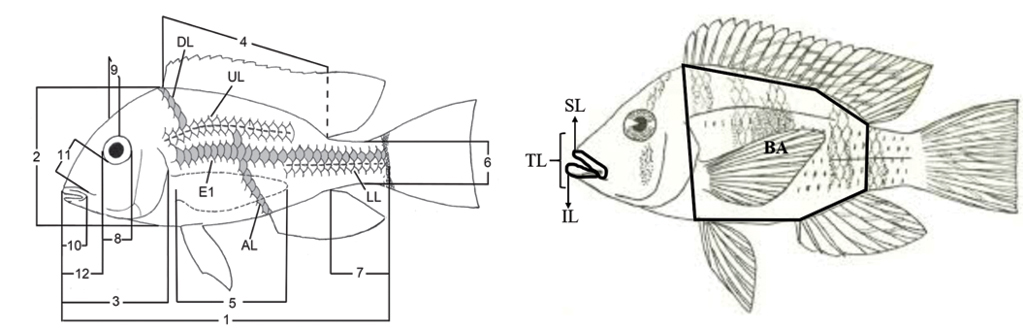
FIGURE 2 | Measurements and counts applied to specimens used in the present study, according to Malabarba et al. (2015). 1: Standard length; 2: Body depth; 3: Head length; 4: Dorsal-fin base length; 5: Pectoral-fin length; 6: Caudal peduncle depth; 7: Caudal peduncle length; 8: Eye diameter; 9: Interorbital width; 10: Upper jaw length; 11: Pre-orbital length; 12: Snout length; E1: Scales in a longitudinal series; DL: Scales between the origin of the dorsal fin and the upper part of the lateral line; UL: Scales in the upper portion of the lateral line; LL: Scales in the lower portion of the lateral line; AL: Scales between the origin of the anal fin and the top of the lateral line. Measurements of the lip area applied to the specimens used in the present study, modified by Buckup, Reis, (1985). SL: upper lip area; IL: lower lip area; TL: total lip area; BA: body area.
For the morphological analyses, three populations were considered: Gymnogeophagus labiatus HBP, G. labiatus HBT and G. lacustris. Gymnogeophagus labiatus CSB was not considered because only one individual was sampled. To check the role of lip area in the morphological differentiation among populations, we performed all analyses considering the linear measurements alone or combined to lip area. A principal component analysis (PCA) was performed to estimate the degree of morphological variation present in the sample, and population differentiation was tested using a non-parametric multivariate analysis of variance (PERMANOVA) from the Mahalanobis distance using 9,999 replications for the post-hoc pairwise test and considering Bonferroni’s correction for multiple tests. The degree of differentiation between populations was also estimated using a Discriminant Analysis or Canonical Variable Analysis (CVA). We used a Kruskal-Wallis test to check for interpopulation differences considering the three most informative morphological variables in CVA. All statistical tests were performed using the Past3.2 program (Hammer et al., 2001). Photographs of live specimens were analyzed to assess the color pattern of these groups.
Results
Considering both cytB and D-loop markers, we obtained a total alignment of 1367bp (773bp, 594bp, respectively), with 92 variable sites distributed among 32 haplotypes for a global haplotype diversity of 0.884 +/- 0.030. We found 36 sites separating HBP and HBT populations, irrespective of the taxonomic affiliation of the specimens. Samples from Bacopari and Corvina isolated lagoons grouped with HBT populations. As shown in the haplotype network (Fig. 3), G. labiatus and G. lacustris had 10 closely related haplotypes in the HBT, two of which are shared between species, while the remaining haplotypes were observed in a single individual (seven G. lacustris and one G. labiatus). Concerning the HBP, one individual identified as G. labiatus sampled in the Camaquã Sub-Basin (CSB) showed a very divergent haplotype, sister to the clade formed by HBT and the remaining HBP haplotypes, which was considered as a different genetic population in the remaining analyses (Fig. 4). Other individuals from CSB sequenced for CytB showed haplotypes closely related to this divergent lineage (Fig. S1), but were not included in the main analysis because we were not able to get data for their D-loop sequence. These divergent lineages came from good quality sequencing reactions, and do not show any obvious features of nuclear mitochondrial DNA insertions (NUMTs) such as “heterozygous” sites, frameshift and nonsense mutations. In some specimens from the Camaquã River basin, for which sequences of only one of the two markers were obtained, we also found haplotypes from the canonical HBP clade, indicating that both mtDNA lineages occur in this drainage (Fig. S1). The AMOVA corroborated the large genetic structure among populations, which accounted for nearly ~90% of the total variation (ФST = 0.909, P < 0.0001). Pairwise ФST values ranged between -0.034 and 0.997 (Tab. 2), with non-significant values between the two species in HBT and for the comparisons involving CSB due to the small sample size for this population.
TABLE 2 | Genetic structure (FST) between Gymnogeophagus populations. Values in bold values were statistically significant (P < 0.05)
Population | G. labiatus CSB | G. labiatus HBP | G. labiatus HBT | G. lacustris |
G. labiatus CSB | – | |||
G. labiatus HBP | 0.857 | – | ||
G. labiatus HBT | 0.997 | 0.895 | – | |
G. lacustris | 0.988 | 0.915 | -0.034 | – |
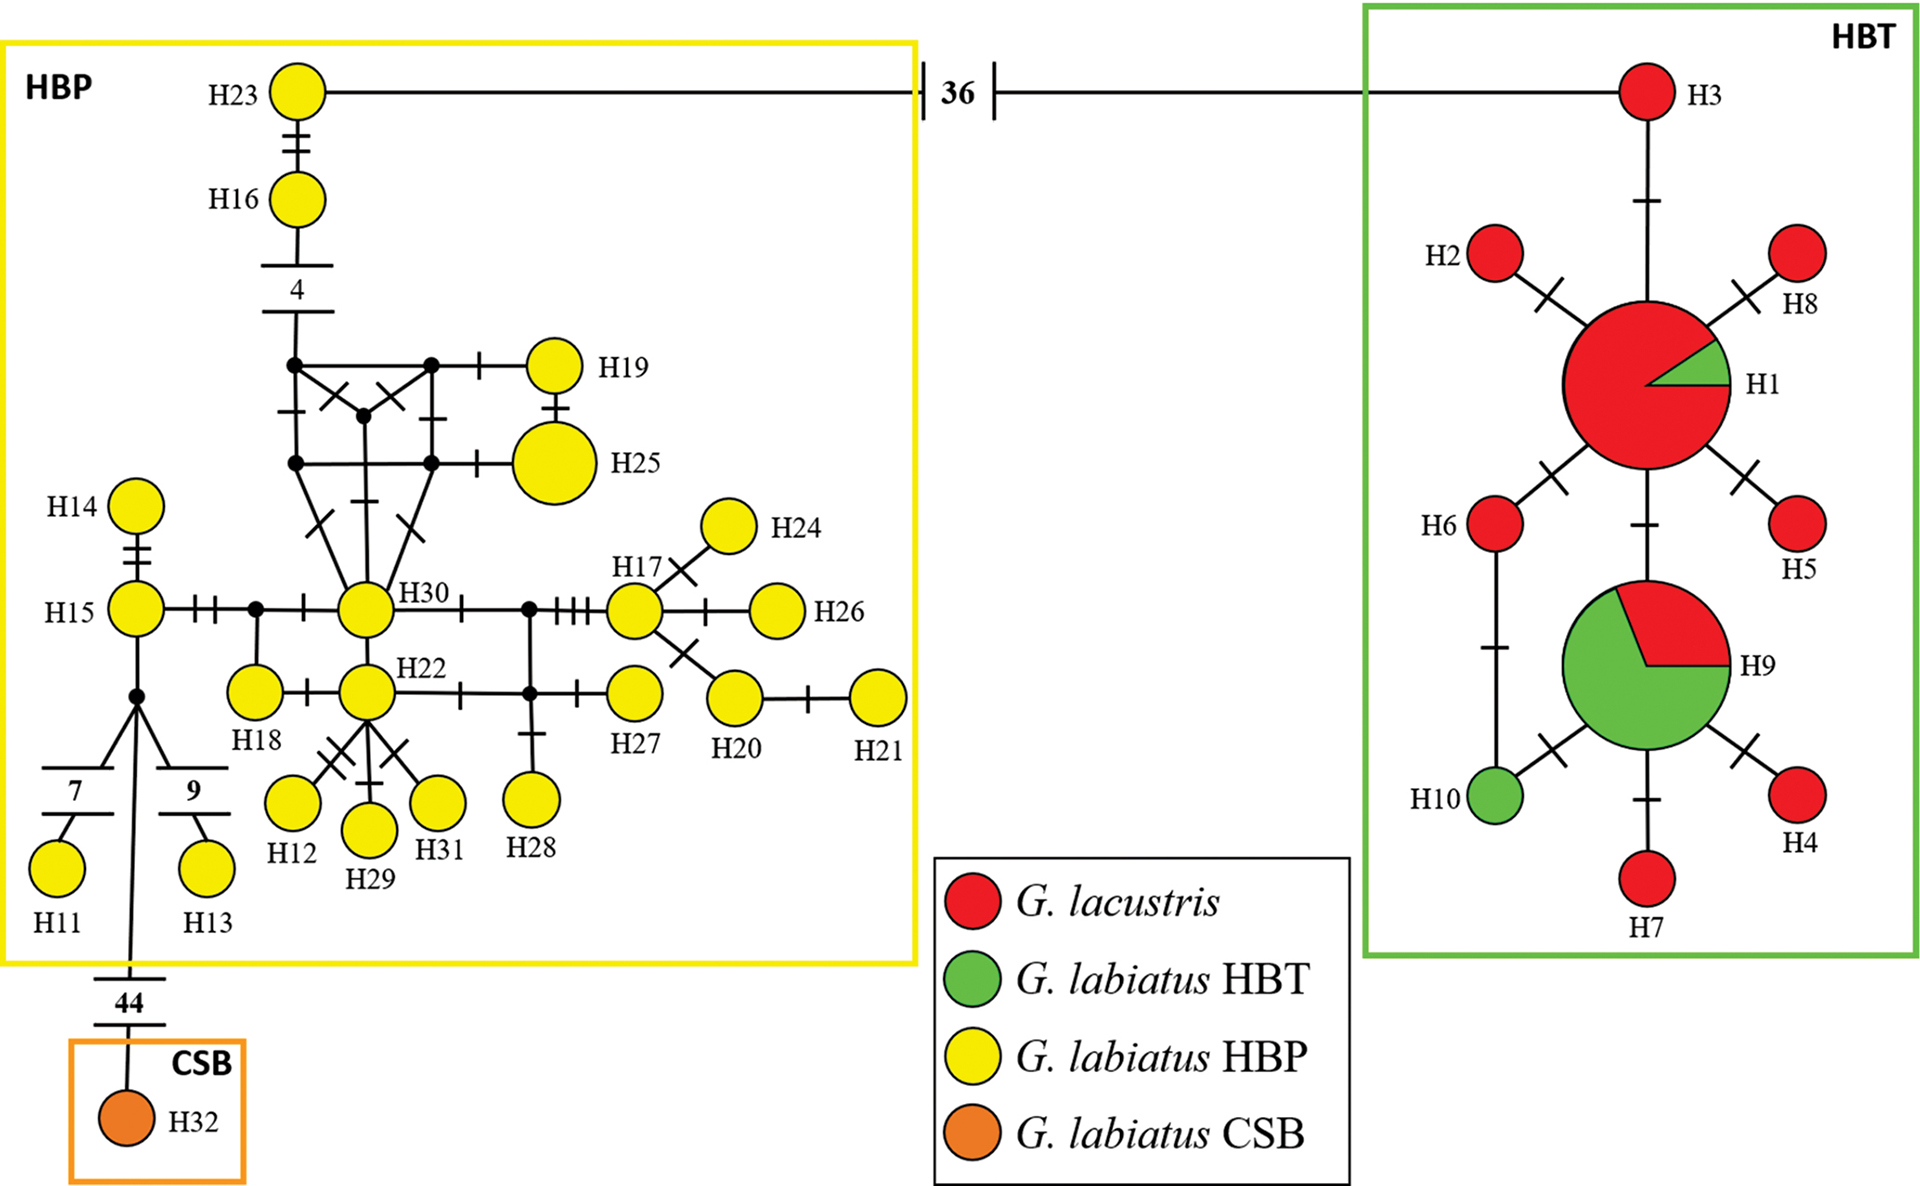
FIGURE 3 | Network of mitochondrial haplotypes of Gymnogeophagus considering the concatenated D-loop and CytB regions. The size of the circles is proportional to the number of individuals present in each haplotype. The colors represent the analyzed populations, according to the legend. Small circles represent medium vectors, and the number of traits or values associated with each branch corresponds to the mutational distance between haplotypes.
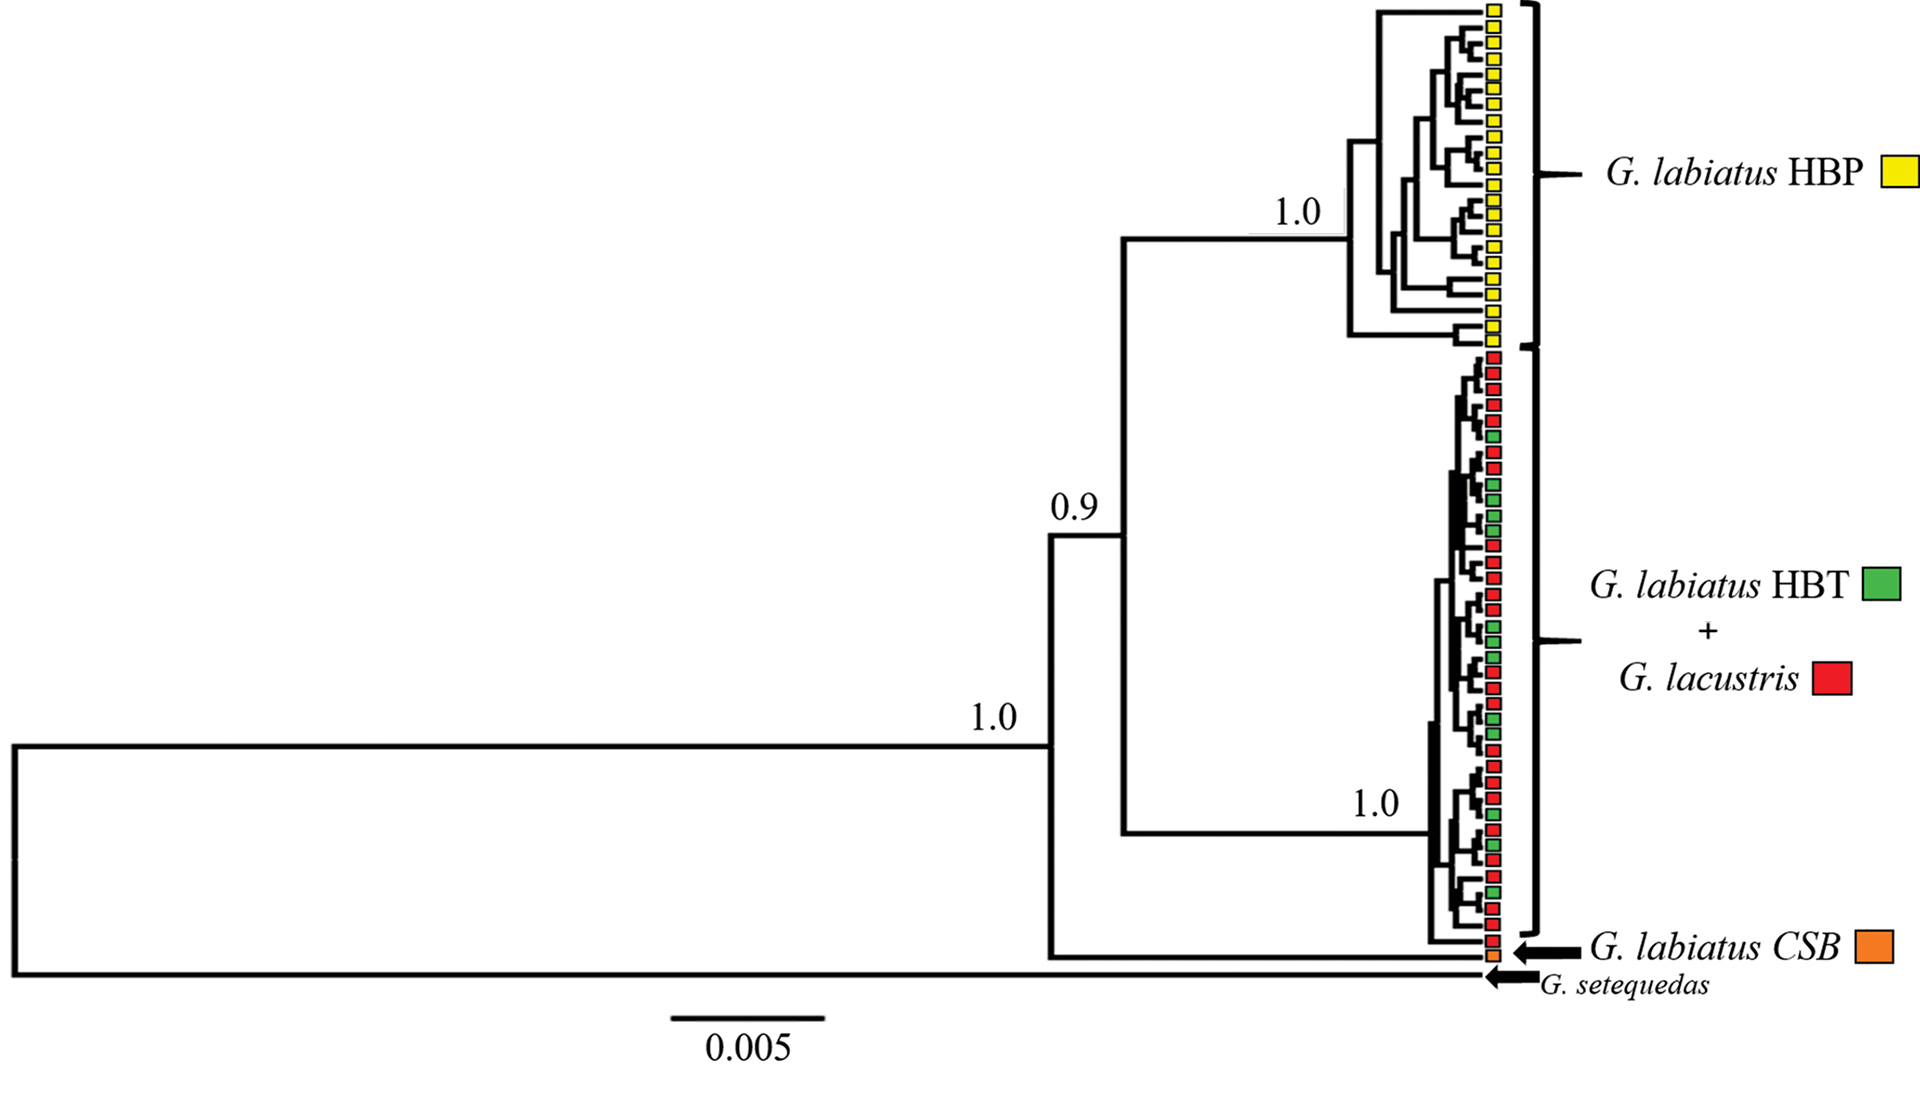
FIGURE 4 | MtDNA genealogy for the individuals analyzed. The values above the nodes correspond to the posterior probability of each clade. Only the values for the clades discussed in the text were presented. The colors represent the analyzed populations, according to the legend.
The population tree (Fig. 5) evidenced a very recent relationship between species in the HBT (~17,000 years, 95% CI 1,000 – 53,000 years). However, the divergence between the HBP and HBT clades dated ~ 3.6 Ma (95% CI 1.1 Ma – 6.0 Ma, while the divergence between the clade formed by these populations and the CSB lineage dated ~ 4.7 Ma (95% CI 2.8 Ma – 7.4 Ma). Under a coalescent criterion, the estimated number of putative species suggested, with high support, that G. labiatus HBT and G. lacustris belong to the same evolutionary lineage, while the other genetic populations of G. labiatus would constitute independent evolutionary lineages. These results were consistent regardless of the specific value of e (Tab. 3).
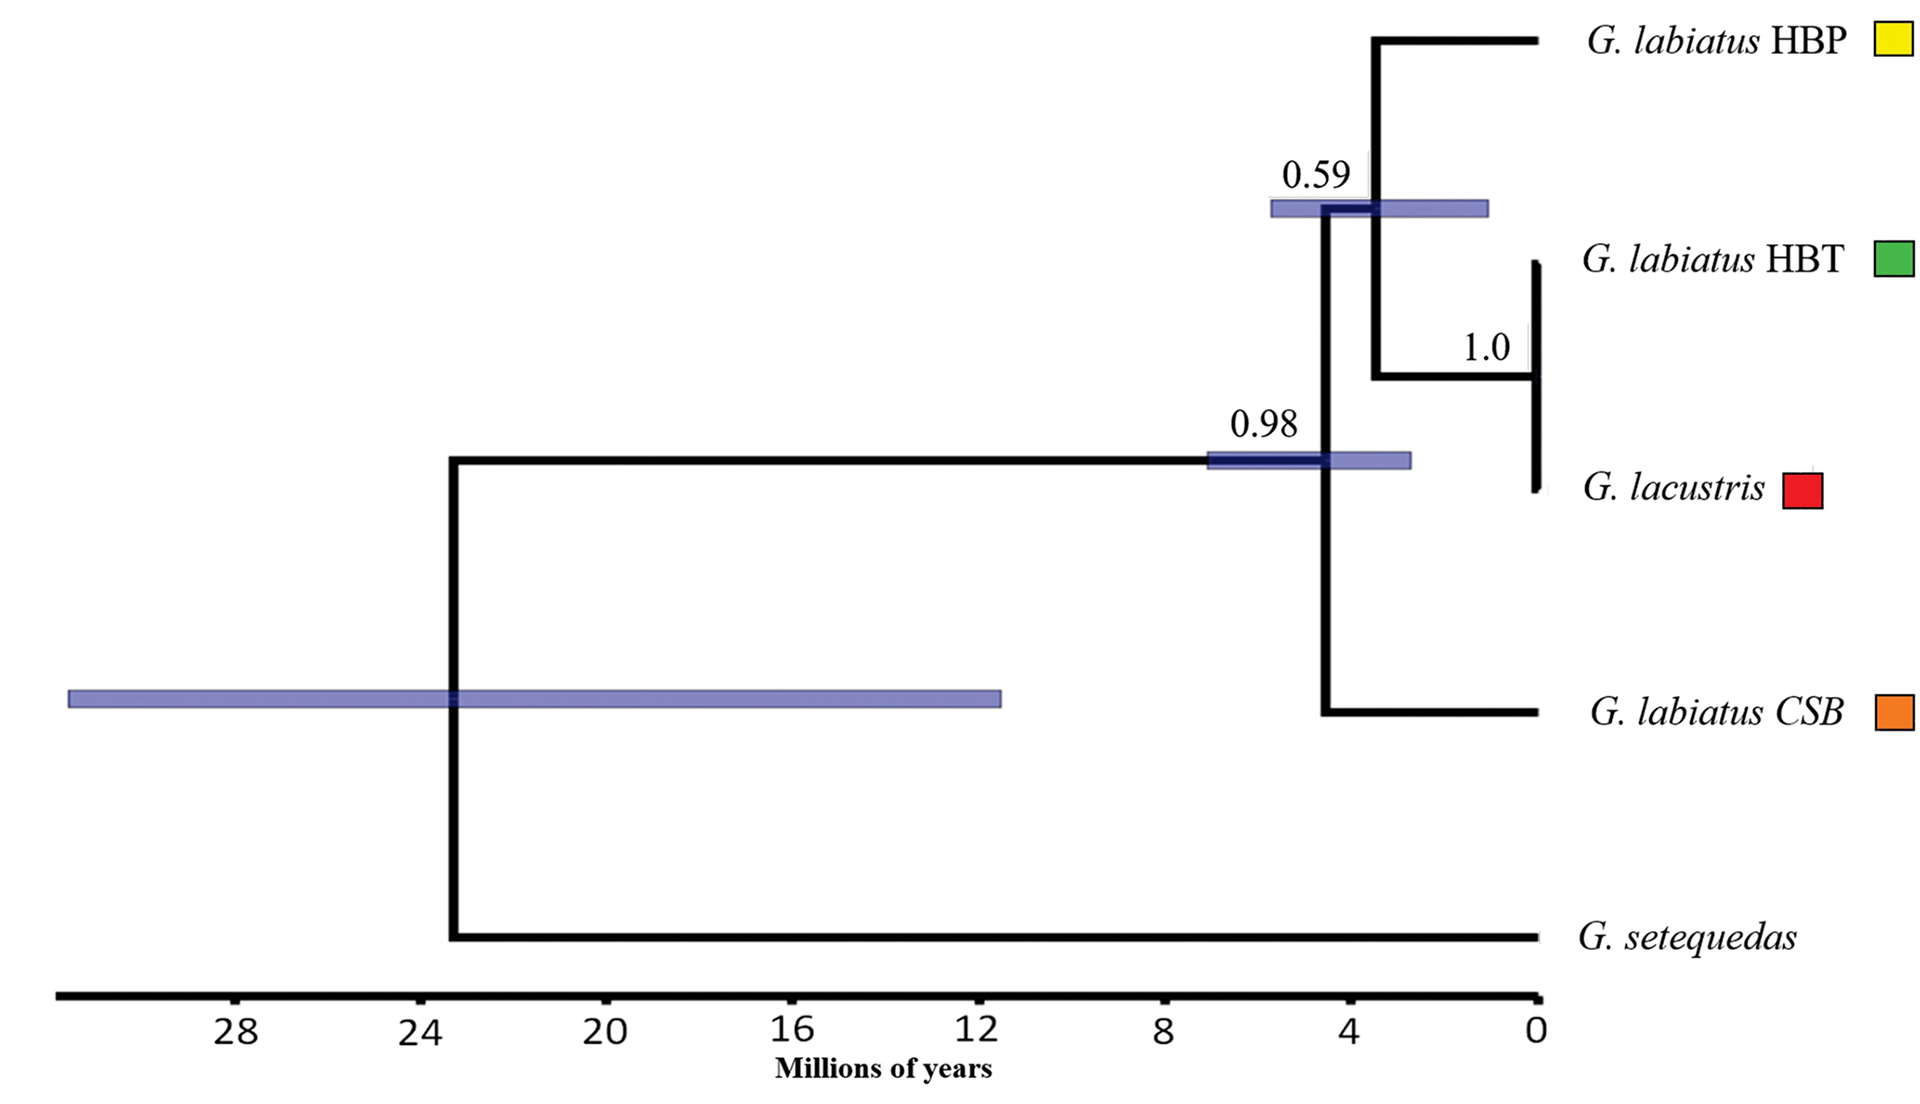
FIGURE 5 | Evolutionary relationship between populations of Gymnogeophagus based on mitochondrial haplotypes. The x-axis scale corresponds to millions of years. The values above the nodes correspond to the posterior probability of each clade. The bar associated with each node represents the 95% credibility interval for the date of the common ancestor. The colors represent the analyzed populations, according to the legend.
TABLE 3 | Delimitation of candidate species under a coalescent criterion. N species = number of candidate species; PP = Posterior probability for a specific arrangement, considering the number of species and which populations make up each group. The letters assigned to each population correspond to all candidate species suggested in the analysis. For a collapse height value of 0.001, three alternative arrangements were contained within the 95% credibility range. Note that in all arrangements Gymnogeophagus labiatus HBT and G. lacustris were assigned as the same candidate species.
Collapse Height | N species | PP | Populations | ||||
G. labiatus CSB | G. labiatus HBP | G. labiatus HBT | G. lacustris | G. setequedas | |||
0.00001 | 4 | 0.995 | A | B | C | C | D |
0.0001 | 4 | 0.962 | A | B | C | C | D |
0.001 | 2 | 0.387 | A | A | A | A | B |
3 | 0.276 | A | B | B | B | C | |
4 | 0.199 | A | B | C | C | D | |
Because the individual showing the CSB lineage had a small body size (69.7 mm), and to avoid having a group with a single individual in the morphological analysis, only individuals sampled in HBT and HBP (except CSB) were included and assigned to one out of three populations: Gymnogeophagus labiatus HBP, G. labiatus HBT and G. lacustris. Scale counts showed low variation among populations and, for this reason, were excluded from further analyses. All measures are shown in Tab. 4. The PCA did not show a strong separation among populations, either or not considering lip area in addition to linear measurements (Fig. 6). Considering linear measurements only, PC1 accounted for 39.75% while PC2 accounted for 19.83% of the total variance. Considering lip area, PC1 accounted for 81.37% while PC2 accounted for 6.69% of the total variance. In addition to lip area, other variables with heavy loadings in the PCA were the length of the pectoral fin, the size of the snout and the height of the body. PERMANOVA showed significant differences among populations, regardless of whether or not the lip area was included in the analysis (F = 3.359, P = 0.0001; F = 3.643, P = 0.0001, respectively), with all pairs being statistically different from each other in both analyses (P < 0.01 for all pairs).
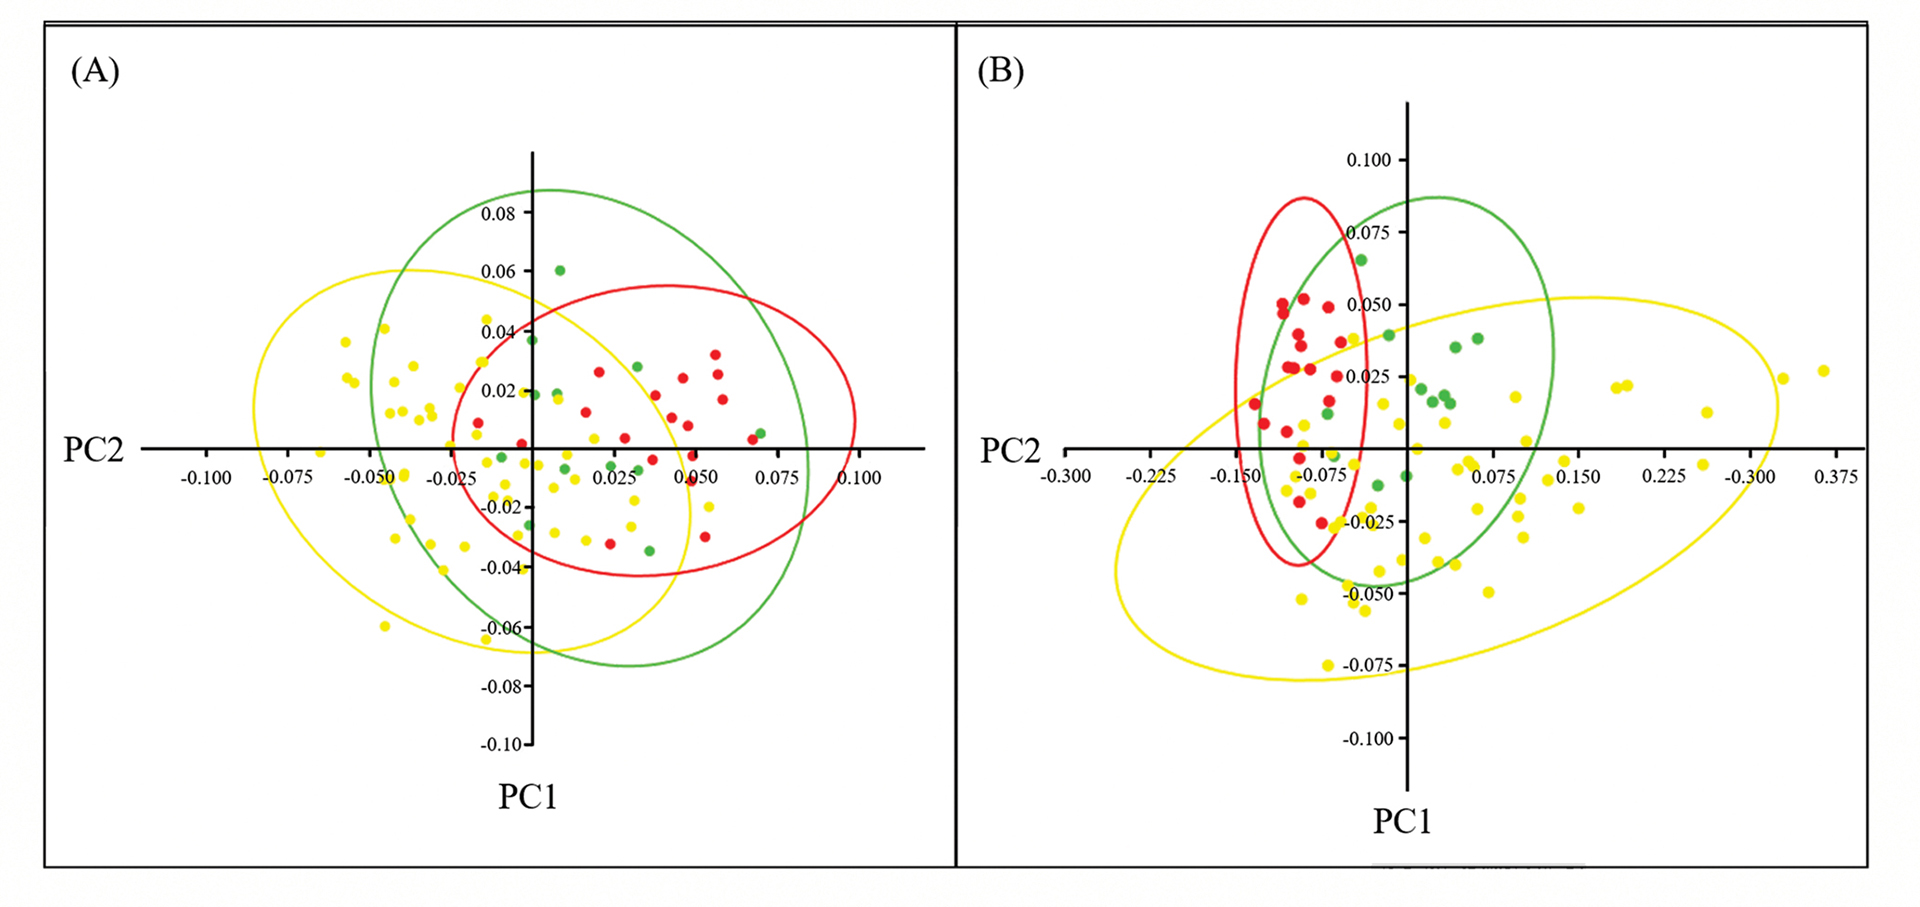
FIGURE 6 | Principal Component Analysis (PCA) for morphological data (A) disregarding the lip area; (B) considering the lip area. Gymnogeophagus lacustris is represented in red, G. labiatus HBT is represented in green and G. labiatus HBP is represented in yellow.
TABLE 4 | Morphological measurements for the analyzed Gymnogeophagus specimens. Min = minimum observed value; Max = maximum observed value; SD = standard deviation; *Values relative to standard length; **Values relative to body area; E1 = Scales in a longitudinal series; DL = Scales between the origin of the dorsal fin and the upper part of the lateral line; AL = Scales between the origin of the anal fin and the top of the lateral line.
| G. labiatus HBP
(N = 48) | G. labiatus HBT
(N = 12) | G. lacustris (N
= 18) | |||||||||
Min | Max | Mean | SD | Min | Max | Mean | SD | Min | Max | Mean | SD | |
Linear measurements (mm) | | | | | | | | | | | | |
Standard length (SL) | 80.9 | 180.2 | 111.4 | – | 80.3 | 133.5 | 100.6 | – | 80.43 | 146.2 | 100.8 | – |
Body depth* | 31.7 | 39.3 | 36.1 | 1.57 | 34.8 | 39.6 | 37.1 | 1.62 | 37.0 | 41.0 | 39.0 | 1.18 |
Head length* | 28.6 | 38.1 | 33.9 | 1.78 | 32.5 | 38.0 | 34.6 | 1.65 | 32.0 | 35.8 | 33.9 | 0.92 |
Dorsal-fin base length* | 47.7 | 56.5 | 52.3 | 2.02 | 48.1 | 54.9 | 51.5 | 2.01 | 51.0 | 57.1 | 52.9 | 1.49 |
Pectoral-fin length* | 24.0 | 34.4 | 27.7 | 2.31 | 27.7 | 36.4 | 31.0 | 2.32 | 25.4 | 35.2 | 32.0 | 2.51 |
Caudal peduncle depth* | 11.6 | 13.8 | 12.7 | 0.50 | 12.1 | 13.6 | 12.8 | 0.42 | 12.7 | 14.2 | 13.4 | 0.39 |
Caudal peduncle length* | 16.3 | 21.2 | 18.7 | 1.20 | 17.4 | 20.4 | 18.9 | 1.08 | 16.6 | 21.1 | 18.7 | 1.24 |
Eye diameter* | 5.7 | 9.7 | 7.4 | 0.82 | 6.8 | 9.6 | 8.2 | 1.17 | 6.9 | 10.2 | 8.6 | 0.92 |
Interorbital width* | 8.1 | 12.5 | 9.9 | 1.06 | 9.0 | 12.4 | 10.7 | 1.11 | 8.9 | 12.8 | 10.1 | 1.06 |
Upper jaw length* | 6.2 | 11.1 | 8.3 | 1.11 | 5.9 | 8.9 | 7.8 | 0.89 | 4.8 | 8.6 | 7.0 | 0.94 |
Pre-orbital length* | 9.2 | 14.5 | 12.0 | 1.24 | 10.6 | 15.0 | 12.4 | 1.33 | 10.8 | 15.6 | 13.1 | 1.45 |
Snout length * | 11.6 | 19.6 | 14.9 | 1.85 | 10.9 | 19.0 | 14.0 | 2.17 | 11.3 | 15.6 | 13.5 | 1.22 |
Area (cm²) | | | | | | | | | | | | |
Body area | 8.09 | 56.77 | 20.07 | – | 10.78 | 34.80 | 18.94 | – | 12.31 | 41.90 | 19.77 | – |
Upper lip area** | 0.3 | 2.5 | 1.2 | 0.58 | 0.5 | 1.3 | 0.9 | 0.24 | 0.2 | 0.7 | 0.4 | 0.12 |
Lower lip area** | 0.5 | 3.2 | 1.6 | 0.70 | 0.7 | 1.3 | 1.1 | 0.20 | 0.4 | 0.8 | 0.6 | 0.12 |
Total lip area** | 1.0 | 5.6 | 2.7 | 1.25 | 1.3 | 2.6 | 1.9 | 0.42 | 0.6 | 1.4 | 1.0 | 0.21 |
Counts | | | | | | | | | | | | |
Upper lateral line | 25 | 30 | 27.4 | 1.03 | 26 | 28 | 27.0 | 0.60 | 26 | 28 | 26.9 | 0.73 |
Lower lateral line | 11 | 15 | 12.4 | 0.98 | 10 | 14 | 11.8 | 1.22 | 10 | 13 | 11.7 | 0.84 |
E1 | 8 | 11 | 9.3 | 0.66 | 9 | 11 | 9.3 | 0.62 | 8 | 11 | 9.0 | 0.77 |
DL | 16 | 20 | 18.2 | 0.93 | 16 | 20 | 17.8 | 1.11 | 17 | 19 | 18.0 | 0.69 |
AL | 4 | 6 | 4.6 | 0.54 | 4 | 5 | 4.6 | 0.51 | 4 | 5 | 4.7 | 0.46 |
Spines | 12 | 15 | 13.7 | 0.69 | 12 | 14 | 12.9 | 0.51 | 12 | 14 | 12.8 | 0.55 |
Rays | 8 | 12 | 10.1 | 0.92 | 10 | 12 | 11.0 | 0.60 | 10 | 12 | 10.8 | 0.71 |
The CVA showed high discrimination among groups, with 89.74% and 87.18% of correct classifications, either considering or not lip area, respectively (Tab. 5). Considering each measure individually, no morphological character was able to differentiate among the three populations simultaneously. However, while the size of the pectoral fin and the size of the snout discriminated populations from HBP or HBT (Fig. 7), lip area and body height differentiated between G. lacustris and G. labiatus (Fig. 8).
TABLE 5 | Confusion matrix for the CVA of morphological data of Gymnogeophagus species.
Original population | Inferred population | |||
G. labiatus HBP | G. labiatus HBT | G. lacustris | Total | |
Linear measurements + lip area | ||||
G. labiatus HBP | 42 | 5 | 1 | 48 |
G. labiatus HBT | 0 | 11 | 1 | 12 |
G. lacustris | 1 | 0 | 17 | 18 |
Total | 43 | 16 | 19 | 78 |
Linear measurements only | ||||
G. labiatus HBP | 41 | 5 | 2 | 48 |
G. labiatus HBT | 1 | 10 | 1 | 12 |
G. lacustris | 1 | 0 | 17 | 18 |
Total | 43 | 15 | 20 | 78 |
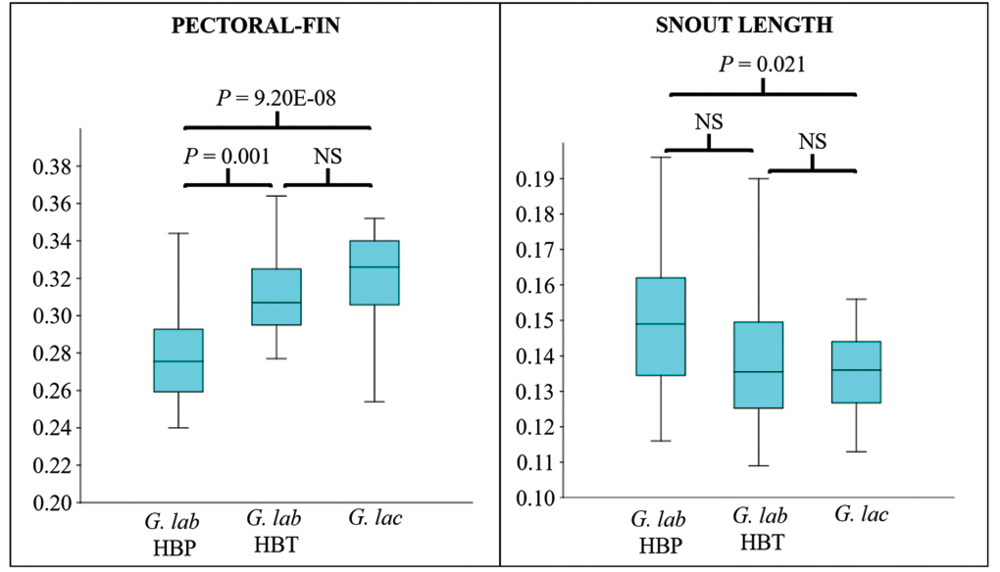
FIGURE 7 | Kruskal-Wallis box-plot and test for the length of the pectoral-fin (Hc = 32.18, P = 1.03E-8) and the snout length (Hc = 8.47, P = 0.014). The significance values for the peer-to-peer post-hoc tests are presented directly in the figure. G. lab = Gymnogeophagus labiatus, G. lac = G.lacustris.
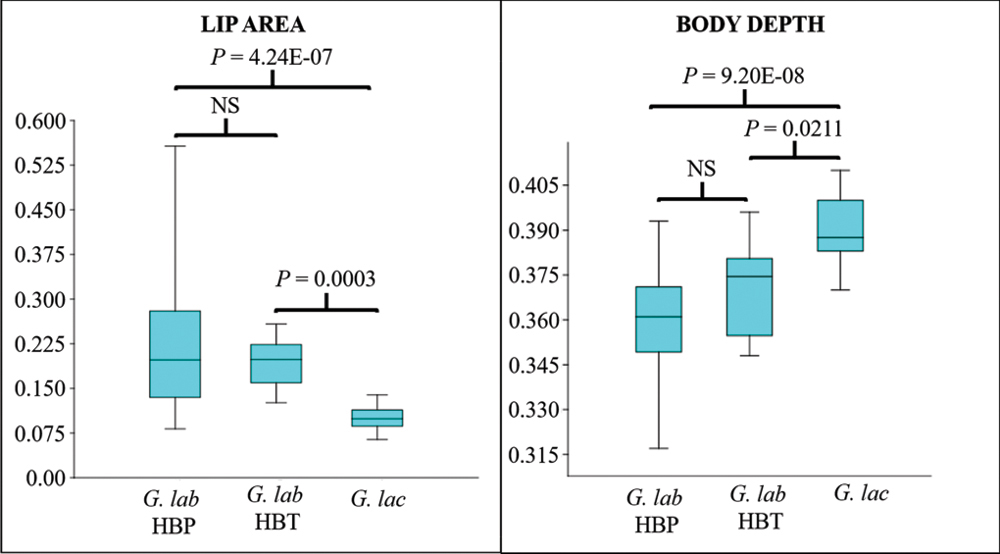
FIGURE 8 | Kruskal-Wallis box-plot and test for the lip area (Hc = 29.19, P = 4.59E-7) and the body depth (Hc = 30.78, P = 2.07E-7). The significance values for the peer-to-peer post-hoc tests are presented directly in the figure. G. lab = Gymnogeophagus labiatus, G. lac = G.lacustris.
The color pattern of live reproductive males and females corroborated the differences between hydrographic basins (HBP vs. HBT), but did not support the differentiation between G. labiatus HBT and G. lacustris. All analyzed populations from HBT with or without developed lips showed a similar color pattern (Fig. 9). The lips of fully developed males (nuptials) from HBT populations had a vibrant orange to red lip color, regardless of lip size (specimens G vs. I in Fig. 9). The upper lip had almost always a more vibrant orange hue than the lower lip. Orange pigmentation was also observed in females (Figs. 9B,D), even though this was not as intense as in males.
In HBP populations, in contrast, fully developed males (nuptials) had yellow to light orange lips, usually not very distinct from the coloration of nearby areas of the head (Fig. 10, specimens A‒B). Despite the small sample size, individuals belonging to the CSB lineage had a color pattern closer to the one observed in HBP (Fig. 10, specimens C‒D). The body scales of nuptial males had blue iridescent marks nearly all over the lateral of body in HBP populations, but were mostly absent in the lateral portion of the belly, behind the pectoral fin, and above the pelvic fin in HBT populations, making vertical black bars on body clearly visible behind translucent scales. Another difference was that in HBT populations the iris was mostly blue in the middle and lower portions and yellow in the upper portion, while in HBP populations the iris was mostly black with yellow marks. The branchiostegal membrane in HBT populations had a conspicuous orange color, which turned into a pale yellow color in HBP populations. No distinguishable color pattern was observed in the fins of nuptial males between HPT and HBP populations. The dorsal fin was red, with white or light blue marks arranged in stripes. The anal fin was red in the proximal portion and dark gray in the distal portion, with white or light blue dots, mostly distributed near the base of the anal fin. The caudal fin was brown to red, with interradial membranes white or slightly blue. Some specimens of the isolated lagoons of the HBT showed no colored fins, but these specimens coexist with colored specimens, denotating a local variation (Fig. 9, specimens I, J, respectively).
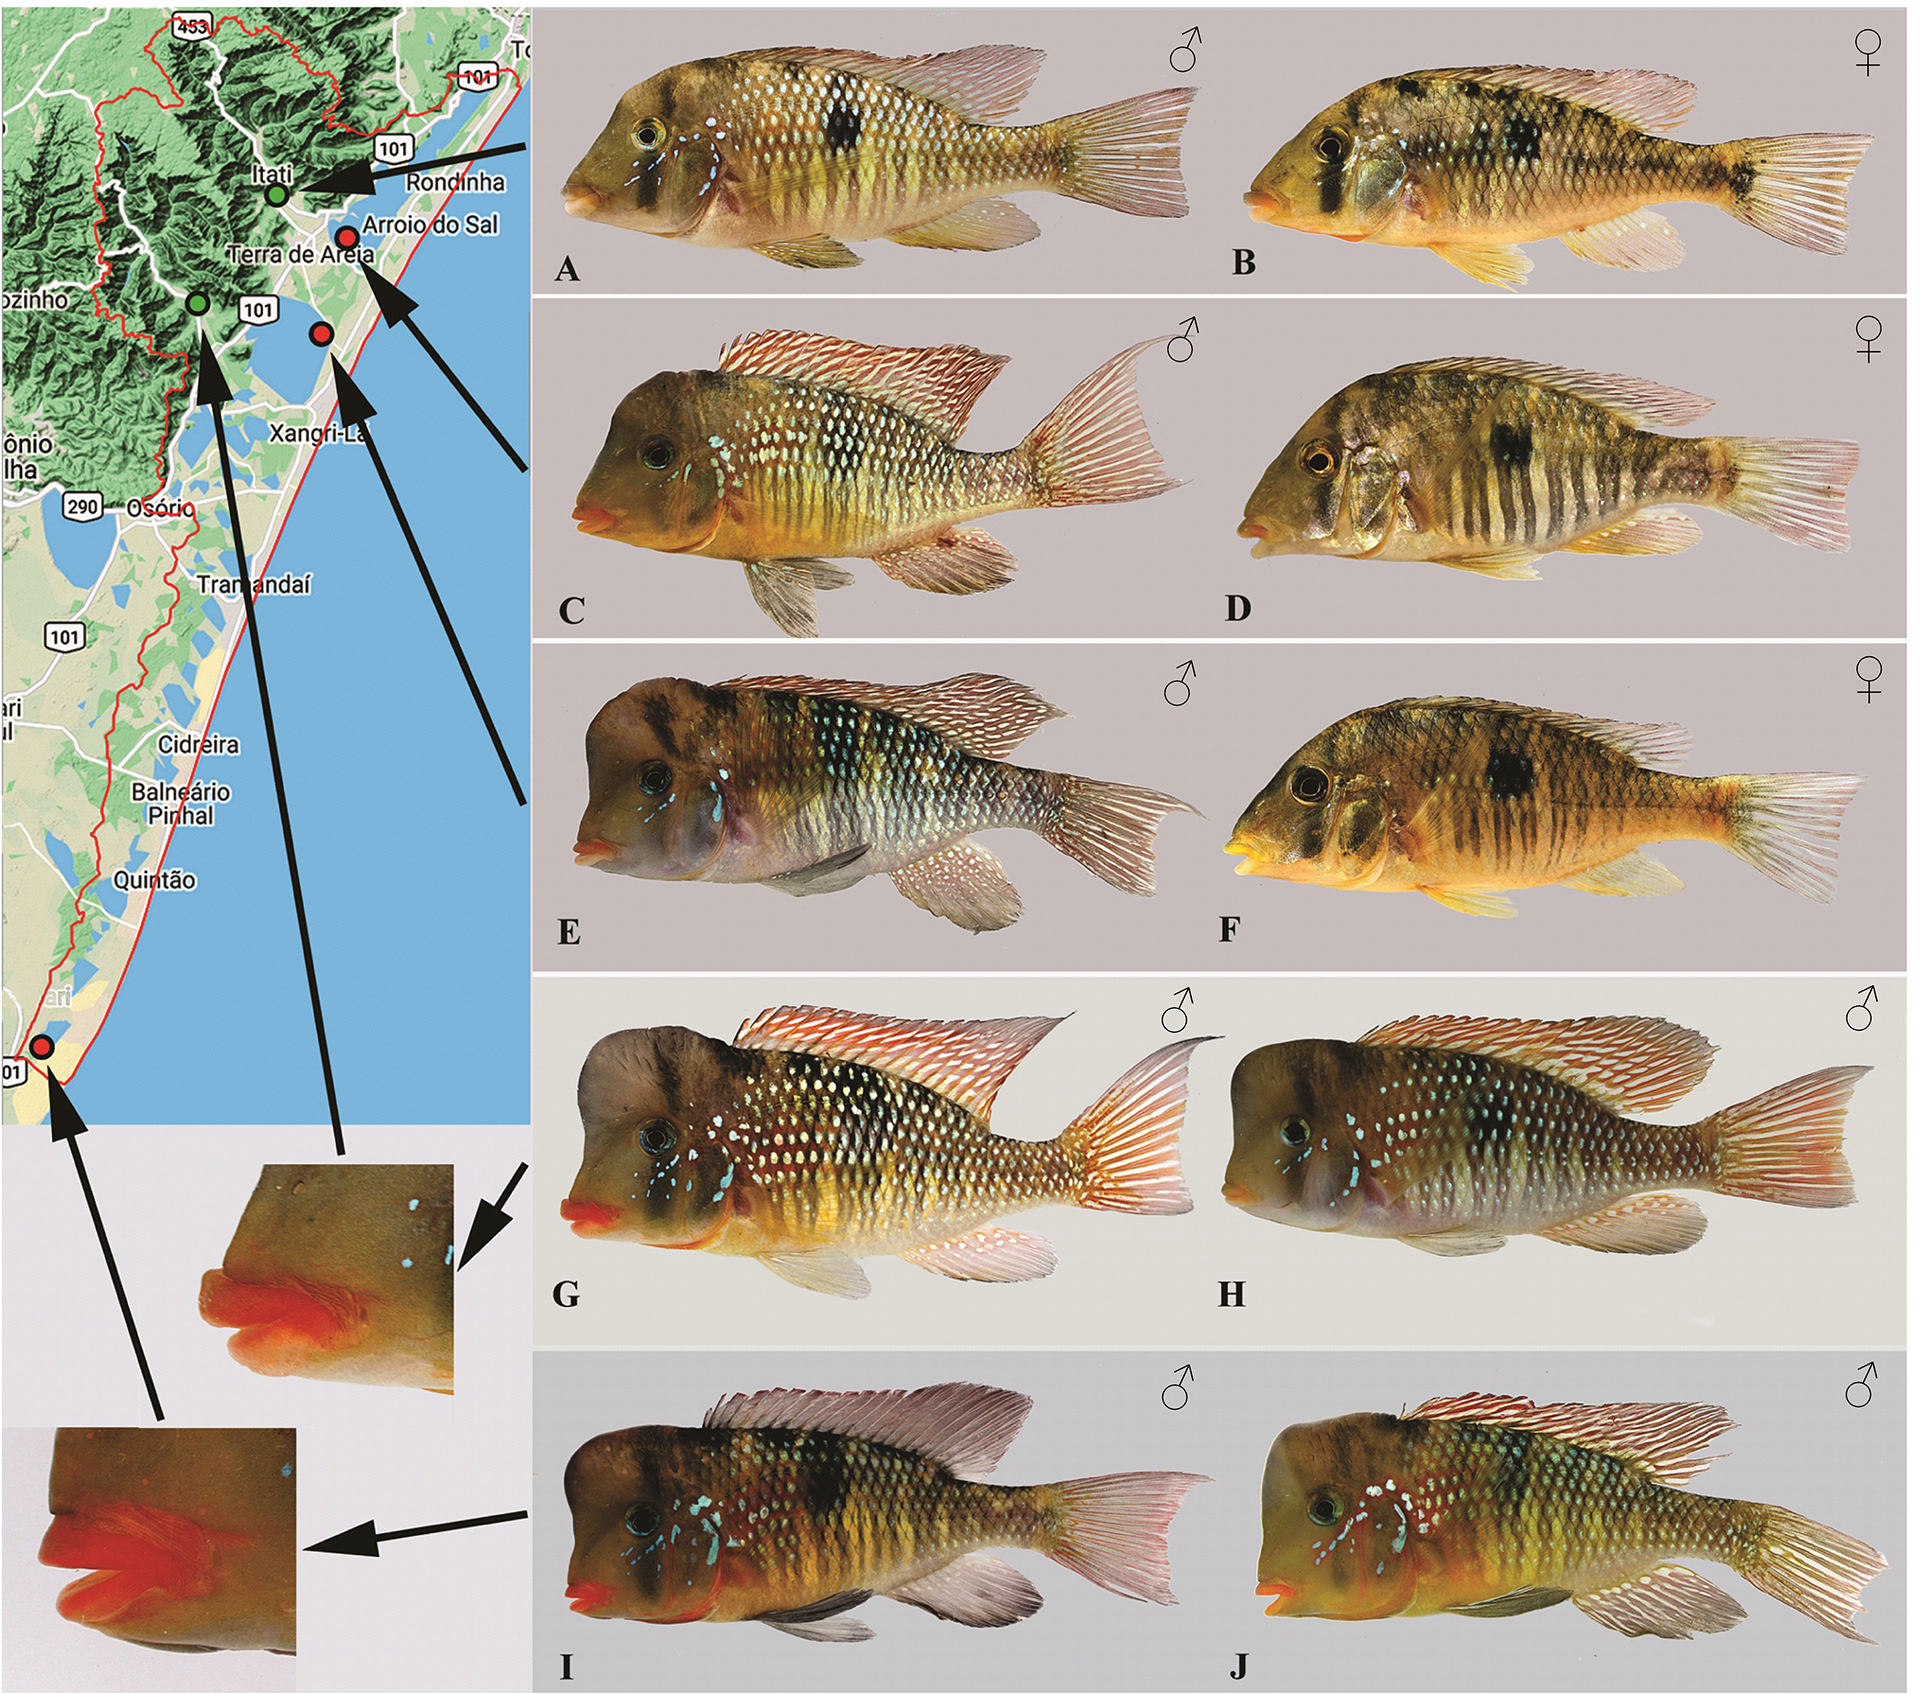
FIGURE 9 | Color pattern in the HBT. A. Male (UFRGS 26300) and B. Female (UFRGS 20302), Três Forquilhas River. C. Male (UFRGS 26311) and D. Female (UFRGS 26311), Itapeva Lake. E. Male (UFRGS 26265) and F. Female (not catalogued), Quadros Lake. G. Male (UFRGS 21101) and H. Male (UFRGS 26264), Maquiné River. I. Male (UFRGS 16751) and J. Male (UFRGS 16751), Bacopari Lake. Specimens A, B, and G, come from rivers draining the mountains (green dots) with rock bottom sharing hypertrophied lips and have been referred to as Gymnogeophagus labiatus HBT. Specimens C‒F, H‒J, come from sand bottom environments (red dots) and have been referred to as G. lacustris. Note that specimen H, with undeveloped lips, was collected syntopically with a specimen with hypertrophied lips (G). The color pattern of specimens from the currently isolated Bacopari Lake in the southernmost distribution of this species varies from plain dorsal, anal and caudal fins (I) to white striped or dotted fins (J).
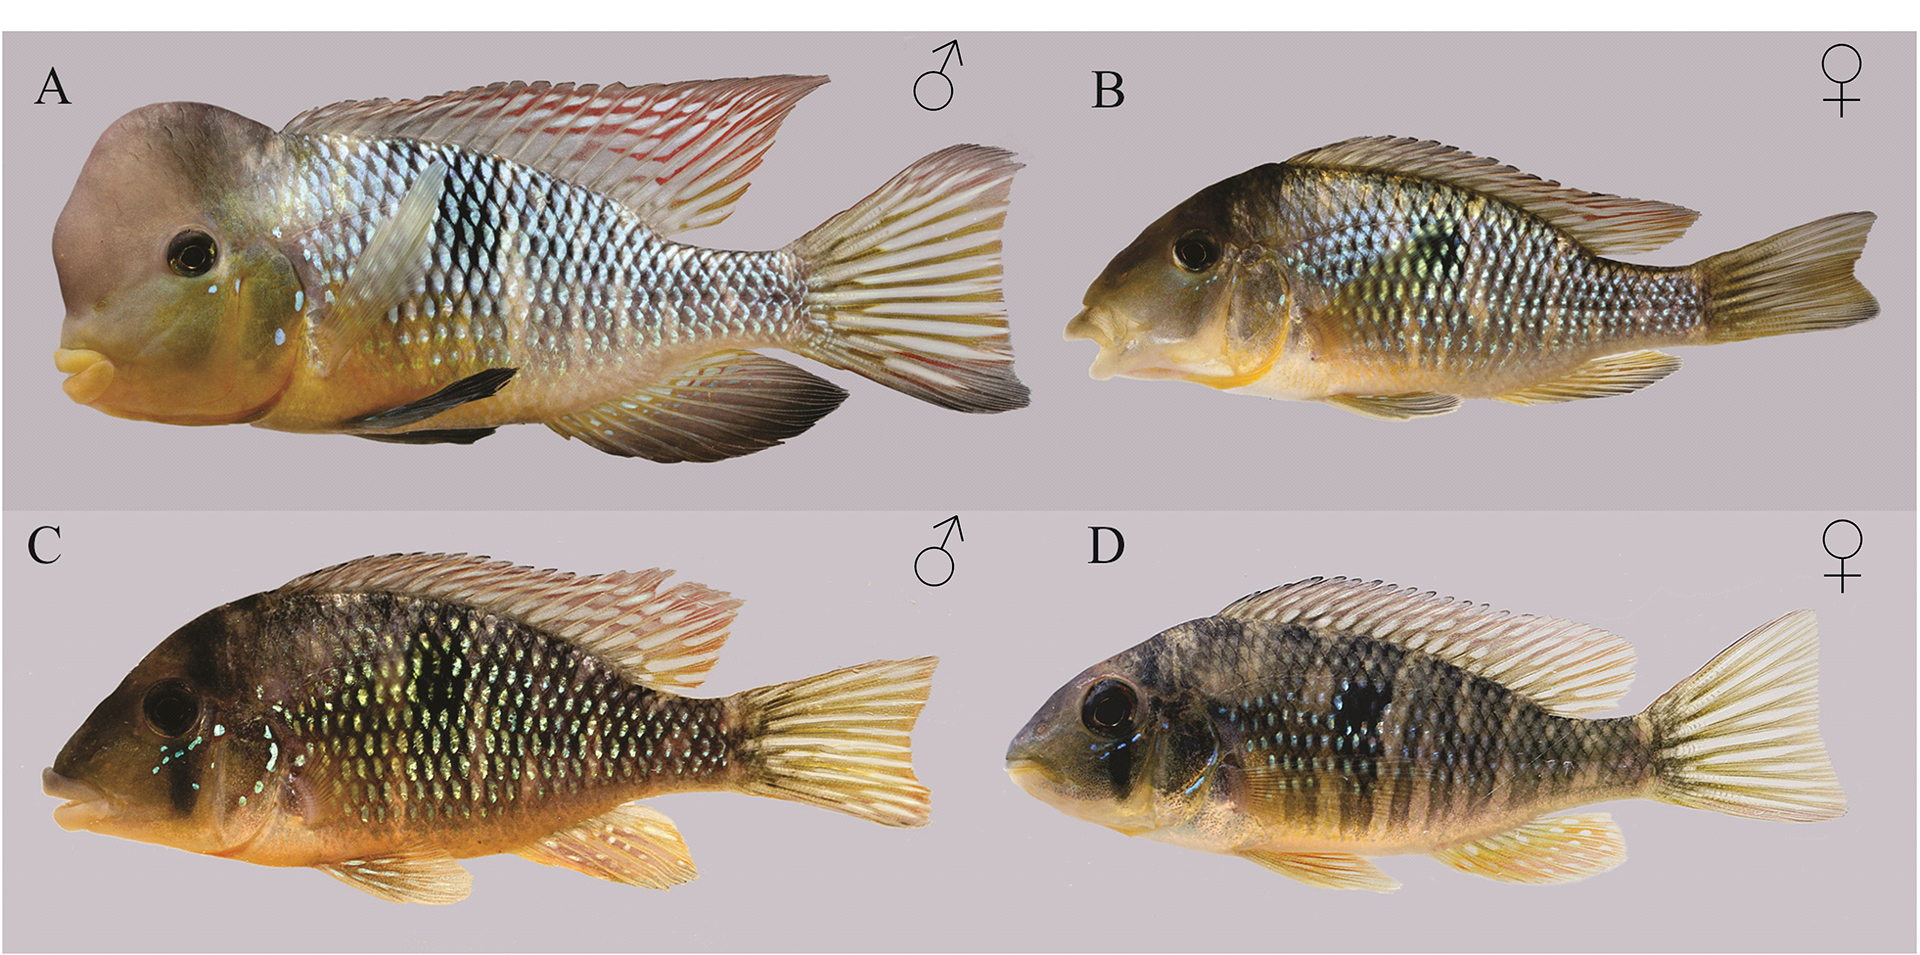
FIGURE 10 | Color pattern in the HBP and CSB. Gymnogeophagus labiatus. A. Male (117 mm SL; uncatalogued, Guaíba Lake near the mouth of the Celupa creek) and B. Female (104 mm SL; uncatalogued, Guaíba Lake, Barra do Ribeiro). C. Male (UFRGS 26425) and D. Female (UFRGS 26425), Camaquã Sub-Basin.
Discussion
Under a broad evolutionary perspective, one can evoke the unified species concept (USC, or general lineage concept (GLC)) and define species as “independent evolutionary lineages” (Wiley, 1978; de Queiroz, 2007). Thus, if we agree that species can be assessed by multiple operational criteria, the final decision on the recognition of one or multiple species must be based not on the choice of a preferred operational criteria, but on the demonstration that two metapopulations constitute distinct lineages or not (Malabarba et al., 2020). Although morphological data can be used in taxonomy without any evolutionary assumption, morphological differentiation can be understood as a step (or stage) in the divergence process between evolutionary lineages (Hey, 2001; de Queiroz, 2007), allowing this kind of data to be fully integrated into an iterative system (sensu Yeates et al., 2011) that uses several data sources (morphological, genetic, behavioral) to test evolutionary distinctness and make taxonomic decisions based on the evolutionary process (Carew et al., 2005; Yeates et al., 2011). Below, we argue that the current taxonomy of G. labiatus and G. lacustris does not properly represent evolutionary lineages in these species.
From the genetic point of view, G. labiatus presents a paraphyletic set of mitochondrial lineages distributed in three clades related the major hydrographic basins (or subbasins in the case of CSB). The precise evolutionary meaning of this pattern depends on how much the mtDNA gene tree reflects the species tree. Gene tree/species tree discordance is a relatively common phenomenon and may be originated by different processes, including incomplete lineage sorting and introgression following genetic contact (hybridization) (see Boussau, Scornavacca, 2020 for a review). Because we only used mtDNA markers, which do not recombine and therefore represent a single “genealogical unit”, it was not possible to discriminate among these alternatives (mtDNA gene tree does reflect the species tree; mtDNA is affected by incomplete lineage sorting; mtDNA is affected by hybridization/introgression). This is an important caveat to keep in mind when interpreting our results.
The HBT clade included all individuals from this basin irrespective of its taxonomic affiliation. There are even shared haplotypes between G. labiatus HBT and G. lacustris. However, we detected significant morphological differences between G. labiatus HBT and G. lacustris. These results could be reconciled under a scenario of recent speciation in which natural selection facilitates the morphological divergence between G. lacustris and G. labiatus, with a high probability of ancestral polymorphism being shared between species (Jamie, Meier, 2020). Alternatively, if there is hybridization between these species, the mtDNA gene tree could reflect a complete introgression of mtDNA lineages from one species into the other. In this scenario, it is difficult to speculate on the direction of such introgression, as the HBT clade could either reflect a phylogeographical variation in G. labiatus or the canonical lineages from G. lacustris.
A similar reasoning can be followed to put in context the HBP and CSB clades. Specimens belonging to the HBP clade are morphologically differentiated from the remaining G. labiatus from HBT. Unfortunately, we were not able to include individuals carrying the CSB lineage in the morphological analyses, but the deep divergence between CSB and HBP clades allows some alternative interpretations. Since we detected lineages from both clades in the Camaquã River, one alternative is that the CSB lineage could represent a new candidate species, sympatric to G. labiatus. Other evolutionary scenarios would involve introgression of some mtDNA lineages (probably from HBP) in the Camaquã River population of G. labiatus (whose canonical lineage belongs to the CSB clade) via stream capture or because the Jacuí and Camaquã systems have been connected through the Patos Lagoon from 120,000 years ago (Tomazelli, Villwock, 2000; Weschenfelder et al., 2010). Hybridization and introgression have been poorly studied in Neotropical cichlids, but recent findings from Cichla suggest these processes may have been pervasive, affecting both species delimitation and identification (Willis et al., 2012; Mourão et al., 2017; Diamante et al., 2021). However, discriminating among these alternatives will await a thorough characterization of the genomic variation for these populations.
No single measurement was sufficient to discriminate, simultaneously, among the three groups analyzed for morphology (G. labiatus HBP, G. labiatus HBT, and G. lacustris). As expected by its taxonomic description (Reis, Malabarba, 1988), lip area was the main trait differentiating G. labiatus from G. lacustris, followed by body height. However, other measurements with high loadings in the PCA (pectoral-fin size and snout size) showed a significant difference between HBP (G. labiatus) and HBT populations (G. labiatus HBT + G. lacustris), which was corroborated by the in vivo color pattern of nuptial males.
In deciding if separate lineages consist of separate species or structured populations, Malabarba et al. (2020) proposed a perspective based on the life history of the taxa – on the traits that can be more prone to differentiation. Cichlids are very diverse with regard to body color and pigmentation, this characteristic has been implicated, in some groups of the family, in female mate choice (Seehausen et al., 1999) and mimicry (Boileau et al., 2015). The relationship with sexual selection is especially important given its role in evolutionary isolation between emerging lineages. It has been shown that color diversity among cichlids, especially in relation to male nuptial color, is the result of strong sexual and natural selection (Seehausen et al., 1999; Kocher, 2004; Barson et al., 2007). Indeed, the relationship between sexual selection and speciation led some authors to propose that this is probably one of the main factors that drive diversification in cichlids (Kocher, 2004; Wagner et al., 2012). In this context, the difference in color shown by nuptial males from HBT vs. HBP can be interpreted as a strong character for the separation between these groups into independent evolutionary lineages. It must be acknowledged that this character is challenging given the impossibility to assess it in museum specimens for which no photographs have been taken from the live individual. However, other measurements (pectoral fin size and snout size) which are available from museum specimens were effective in evidencing the same differences between HBT and HBP.
The development of hypertrophied lips, which has been consistently linked to the specialization in foraging oriented towards rock crevices (Baumgarten et al., 2015), emerged independently in all major cichlid clades (Burress, 2014). In the Uruguay River basin, two examples include Gymnogeophagus pseudolabiatus Malabarba, Malabarba & Reis, 2015 and Crenicichla tendybaguassu Lucena & Kullander, 1992. Even though hypertrophied lips have been implicated in cases of incipient speciation (Elmer et al., 2010; Colombo et al., 2013; Manousaki et al., 2013), it has also been shown, as in the case of Amphilophus labiatus (Günther, 1864), that this phenotypic plasticity may be favored by selection, allowing the emergence of thin lip morphs in lentic environments (Machado-Schiaffino et al., 2014). Similarly, G. lacustris and G. labiatus HBT could be interpreted as ecomorphs, with the difference in lip area between reflecting the phenotypic plasticity of an evolutionary lineage adapted to both lotic (in rock bottom rivers) and lentic (in sandy bottom lagoons) environments. It must be noted that the co-occurrence of these two morphs has been recorded at least in one location (Fig. 9, specimens G and H).
Our results do not refute completely the hypothesis that variation in lip area could indicate a very recent or ongoing speciation between G. lacustris and G. labiatus HBT. In fact, recent speciation would be expected considering the recent (~5,000 years) geological history of the lagoon complex occupied by G. lacustris (Tomazelli, Villwock, 2000). Even though molecular dates should be viewed with caution in lineages with considerable rate heterogeneity such as Cichlids (López-Fernández et al., 2005; 2013), this is in line with the estimated genetic divergence between populations (~17,000 years). Moreover, as discussed previously, we used only a single genetic marker (mtDNA), which may fail to indicate independent “coalescent species” compared to genomic loci, especially in the presence of ILS and/or introgression (Bernardi, 2013; Nadeau, Kawakami, 2018).
In spite of these caveats, when considering the reciprocal monophyly, the degree of genetic divergence, and all the morphological evidences (characters such as the length of the pectoral fin and the length of the snout, and the distinct color of nuptial males), our data suggest that HBT and HBP represent sister lineages. Therefore, in order to recognize G. labiatus as monophyletic, we argue that it would correspond only to the Patos Lagoon basin populations. Also, considering the phenotypic plasticity exhibited by other cichlid species showing hypertrophied lips (Machado-Schiaffino et al., 2014), and in order to recognize G. lacustris as monophyletic, we argue that this taxon would correspond to both populations of the Tramandaí River basin. However, future studies including more individuals in the morphological analyses and considering genomic data will be necessary to clarify the evolutionary relationship between HBT populations, and to characterize the degree of genetic structure among HBP populations, with special emphasis in the individuals whose mitochondrial lineages belong to the CSB clade.
Acknowledgments
PICCF received a master’s scholarship from Coordenação de Aperfeiçoamento de Pessoal de Nível Superior (CAPES). LRM is supported by Conselho Nacional de Desenvolvimento Científico e Tecnológico (CNPq, grant number: 307890/2016–3 and 401204/2016–2). We also thank the PPGBAN-UFRGS for financial support. We thank Andrea Thomaz, Aline Ramos-Fregonezi and Filipe Michels Bianchi for their critical reading of a preliminary version of the manuscript. We are thankful to four anonymous reviewers whose comments and criticisms greatly improved the manuscript.
References
Abell R, Thieme ML, Revenga C, Bryer M, Kottelat M, Bogutskaya N et al. Freshwater ecoregions of the world: a new map of biogeographic units for freshwater biodiversity conservation. Bioscience. 2008; 58(5):403–14. https://doi.org/10.1641/B580507
Abràmoff MD, Magalhães PJ, Ram SJ. Image processing with imageJ. Biophotonics Int. 2004; 11(7):36–41. Available from: https://dspace.library.uu.nl/handle/1874/204900
Alonso F, Terán GE, Aguilera G, Říčan O, Casciotta J, Serra WS et al. Description of a new species of the Neotropical cichlid genus Gymnogeophagus Miranda Ribeiro, 1918 (Teleostei: Cichliformes) from the Middle Paraná basin, Misiones, Argentina. PLoS ONE. 2019; 14(2):1–19. https://doi.org/10.1371/journal.pone.0210166
Bandelt H-J, Forster P, Röhl A. Median-Joining networks for inferring intraspecific phylogenies. Mol Biol. 1999; 16(1):37–48. https://doi.org/10.1093/oxfordjournals.molbev.a026036
Barson NJ, Knight ME, Turner GF. The genetic architecture of male colour differences between a sympatric Lake Malawi cichlid species pair. J Evol Biol. 2007; 20(1):45–53. https://doi.org/10.1111/j.1420-9101.2006.01228.x
Baumgarten L, Machado-Schiaffino G, Henning F, Meyer A. What big lips are good for: On the adaptive function of repeatedly evolved hypertrophied lips of cichlid fishes. Biol J Linn Soc. 2015; 115(2):448–55. https://doi.org/10.1111/bij.12502
Bernardi G. Speciation in fishes. Mol Ecol. 2013; 22(22):5487–502. https://doi.org/10.1111/mec.12494
Boileau N, Cortesi F, Egger B, Muschick M, Indermaur A, Theis A et al. A complex mode of aggressive mimicry in a scale-eating cichlid fish. Biol Lett. 2015; 11(9):1–04. https://doi.org/10.1098/rsbl.2015.0521
Bouckaert R, Heled J, Kühnert D, Vaughan T, Wu CH, Xie D et al. BEAST 2: A Software Platform for Bayesian Evolutionary Analysis. PLoS Comput Biol. 2014; 10(4):1–06. https://doi.org/10.1371/journal.pcbi.1003537
Boussau B, Scornavacca C. Reconciling Gene trees with Species Trees. In: Scornavacca C, Delsuc F, Galtier N, editors. Phylogenetics in the Genomic Era. Montpellier: HAL; 2020. p.3.2:1-3.2:23. Available from: https://hal.inria.fr/PGE/hal-02535529
Burress ED. Cichlid fishes as models of ecological diversification: patterns, mechanisms, and consequences. Hydrobiologia. 2014; 748(1):7–27. https://doi.org/10.1007/s10750-014-1960-z
Burress ED, Duarte A, Serra WS, Loueiro M, Gangloff MM, Siefferman L. Functional diversification within a predatory species flock. PLoS ONE. 2013; 8(11):e80929. https://doi.org/10.1371/journal.pone.0080929
Carew ME, Pettigrove V, Hoffmann AA. The utility of DNA markers in classical taxonomy: using cytochrome oxidase i markers to differentiate Australian Cladopelma (Diptera: Chironomidae) Midges. Ann Entomol Soc Am. 2005; 98(4):587–94. https://doi.org/10.1603/0013-8746(2005)098[0587:TUODMI]2.0.CO;2
Casciotta J, Almirón A, Piálek L, Říčan O. Gymnogeophagus taroba (Teleostei: Cichlidae), a new species from the río Iguazú basin, Misiones, Argentina. Historia Natural, Tercera Serie. 2017; 7(2):5–22. Available from: http://naturalis.fcnym.unlp.edu.ar/repositorio/_documentos/sipcyt/bfa005979.pdf
Colombo M, Diepeveen ET, Muschick M, Santos ME, Indermaur A, Boileau N et al. The ecological and genetic basis of convergent thick-lipped phenotypes in cichlid fishes. Mol Ecol. 2013; 22(3):670–84. https://doi.org/10.1111/mec.12029
Diamante NA, Oliveira AV, Petry AC, Catelani PA, Pelicice FM, Mueller LP et al. Genomic markers confirm introgressive hybridization in Cichla (Teleostei) in an invaded coastal system. Int Rev Hydrobiol. 2021; 106(1):48–57. https://doi.org/10.1002/iroh.201902030
Doyle JJ, Doyle JL. A rapid DNA isolation procedure for small quantities of fresh leaf tissue. Phytochemical Bulletin. 1987; 19(1):11–15. Available from: https://worldveg.tind.io/record/33886/
Elmer KR, Lehtonen TK, Kautt AF, Harrod C, Meyer A. Rapid sympatric ecological differentiation of crater lake cichlid fishes within historic times. BMC Biol. 2010; 8(60). https://doi.org/10.1186/1741-7007-8-60
Excoffier L, Smouse PE, Quattro JM. Analysis of molecular variance inferred from metric distances among DNA haplotypes: application to human mitochondrial DNA. Genetics. 1992; 131(2):479–91. https://doi.org/10.1093/genetics/131.2.479
Excoffier L, Lischer HEL. Arlequin suite ver 3.5: A new series of programs to perform population genetics analyses under Linux and Windows. Mol Ecol Resour. 2010; 10(3):564–67. https://doi.org/10.1111/j.1755-0998.2010.02847.x
Fricke R, Eschmeyer WN, Van der Laan R. Eschmeyer’s catalog of fishes: genera, species, references [Internet]. San Francisco: California Academy of Science; 2021. Available from: http://researcharchive.calacademy.org/research/ichthyology/catalog/fishcatmain.asp
Hall TA. BioEdit: a user-friendly biological sequence alignment editor and analysis program for Windows 95/98/NT. Nucleic Acids Symp Ser. 1999; 41:95–98.
Hammer Ø, Harper DAT, Ryan PD. PAST: Paleontological statistics software package. Palaeontol Electron. 2001; 4(1):1–09. Available from: https://paleo.carleton.ca/2001_1/past/past.pdf
Henning F, Meyer A. The evolutionary genomics of cichlid fishes: explosive speciation and adaptation in the postgenomic era. Annu Rev Genomics Hum Genet. 2014; 15(1):417–41. https://doi.org/10.1146/annurev-genom-090413-025412
Henning F, Machado-Schiaffino G, Baumgarten L, Meyer A. Genetic dissection of adaptive form and function in rapidly speciating cichlid fishes. Evolution. 2017; 71(5):1297–312. https://doi.org/10.1111/evo.13206
Hey J. The mind of the species problem. Trends Ecol Evol. 2001; 16(7):326–29. https://doi.org/10.1016/S0169-5347(01)02145-0
Ilves KL, Torti D, López-Fernández H. Exon-based phylogenomics strengthens the phylogeny of Neotropical cichlids and identifies remaining conflicting clades (Cichliformes: Cichlidae: Cichlinae). Mol Phylogenet Evol. 2018; 118(July 2017):232–43. https://doi.org/10.1016/j.ympev.2017.10.008
Jamie GA, Meier JI. The persistence of polymorphisms across species radiations. Trends Ecol Evol. 2020; 35(9):795–808. https://doi.org/10.1016/j.tree.2020.04.007
Jones G, Aydin Z, Oxelman B. DISSECT: An assignment-free Bayesian discovery method for species delimitation under the multispecies coalescent. Bioinformatics. 2015; 31(7):991–98. https://doi.org/10.1093/bioinformatics/btu770
Jones G. Algorithmic improvements to species delimitation and phylogeny estimation under the multispecies coalescent. J Math Biol. 2017; 74(1–2):447–67. https://doi.org/10.1007/s00285-016-1034-0
Kocher TD. Adaptive evolution and explosive speciation: The cichlid fish model. Nat Rev Genet. 2004; 5(4):288–98. https://doi.org/10.1038/nrg1316
Lambert SM, Reeder TW, Wiens JJ. When do species-tree and concatenated estimates disagree? An empirical analysis with higher-level scincid lizard phylogeny. Mol Phylogenet Evol. 2015; 82(Part A):146–55. https://doi.org/10.1016/j.ympev.2014.10.004
Lanfear R, Calcott B, Ho SYW, Guindon S. PartitionFinder: Combined selection of partitioning schemes and substitution models for phylogenetic analyses. Mol Biol Evol. 2012; 29(6):1695–701. https://doi.org/10.1093/molbev/mss020
Li WLS, Drummond AJ. Model averaging and Bayes factor calculation of relaxed molecular clocks in Bayesian phylogenetics. Mol Biol Evol. 2012; 29(2):751–61. https://doi.org/10.1093/molbev/msr232
Librado P, Rozas J. DnaSP v5: A software for comprehensive analysis of DNA polymorphism data. Bioinformatics. 2009; 25(11):1451–52. https://doi.org/10.1093/bioinformatics/btp187
López-Fernández H, Honeycutt RL, Winemiller KO. Molecular phylogeny and evidence for an adaptive radiation of geophagine cichlids from South America (Perciformes: Labroidei). Mol Phylogenet Evol. 2005; 43(1):227–44. https://doi.org/10.1016/j.ympev.2004.09.004
López-Fernández H, Winemiller KO, Honeycutt RL. Multilocus phylogeny and rapid radiations in Neotropical cichlid fishes (Perciformes: Cichlidae: Cichlinae). Mol Phylogenet Evol. 2010; 55(3):1070–86. https://doi.org/10.1016/j.ympev.2010.02.020
López-Fernández H, Arbour JH, Winemiller KO, Honeycutt RL. Testing for ancient adaptive radiations in Neotropical cichlid fishes. Evolution 2013; 67(5):1321–37. https://doi.org/10.1111/evo.12038
Loureiro M, Zarucki M, Malabarba LR, González-Bergonzoni I. A new species of Gymnogeophagus Miranda Ribeiro from Uruguay (Teleostei: Cichliformes). Neotrop Ichthyol. 2016; 14(1):e150082. https://doi.org/10.1590/1982-0224-20150082
Lowe-McConnell RH. Estudos ecológicos de comunidades de peixes tropicais. São Paulo: EDUSP; 1999.
Machado-Schiaffino G, Henning F, Meyer A. Species-specific differences in adaptive phenotypic plasticity in an ecologically relevant trophic trait: Hypertrophic lips in midas cichlid fishes. Evolution (NY). 2014; 68(7):2086–91. https://doi.org/10.1111/evo.12367
Malabarba LR, Isaia EA. The fresh-water fish fauna of the rio Tramandaí drainage, Rio Grande do Sul, Brazil, with a discussion of its historical origin. Comun Mus Ciênc PUCRS, sér zool. 1992; 5(12):97–223.
Malabarba LR, Neto PC, Bertaco VA, Carvalho TP, Santos JF, Artioli LGS. Guia de identificação dos peixes da bacia do rio Tramandaí. Via Sapiens. 2013. Available from: https://www.onganama.org.br/pesquisas/Livros/Guia_Peixes_Bacia_Rio_Tramandai_marco_2013.pdf
Malabarba LR, Malabarba MC, Reis RE. Descriptions of five new species of the Neotropical cichlid genus Gymnogeophagus Miranda Ribeiro, 1918 (Teleostei: Cichliformes) from the rio Uruguay drainage. Neotrop Ichthyol. 2015; 13(4):637–62. https://doi.org/10.1590/1982-0224-20140188
Malabarba LR, Chuctaya J, Hirschmann A, de Oliveira EB, Thomaz AT. Hidden or unnoticed? Multiple lines of evidence support the recognition of a new species of Pseudocorynopoma (Characidae: Corynopomini). J Fish Biol. 2020; 98(1):219–36. https://doi.org/10.1111/jfb.14572
Manousaki T, Hull PM, Kusche H, MacHado-Schiaffino G, Franchini P, Harrod C et al. Parsing parallel evolution: Ecological divergence and differential gene expression in the adaptive radiations of thick-lipped Midas cichlid fishes from Nicaragua. Mol Ecol. 2013; 22(3):650–69. https://doi.org/10.1111/mec.12034
Matos-Maraví P, Wahlberg N, Antonelli A, Penz CM. Species limits in butterflies (Lepidoptera: Nymphalidae): reconciling classical taxonomy with the multispecies coalescent. Syst Entomol. 2019; 44(4):745–56. https://doi.org/10.1111/syen.12352
Meier JI, Marques DA, Mwaiko S, Wagner CE, Excoffier L, Seehausen O. Ancient hybridization fuels rapid cichlid fish adaptive radiations. Nat Commun. 2017; 8:1–11. https://doi.org/10.1038/ncomms14363
Mourão AAF, Freitas-Souza D, Hashimoto DT, Ferreira DC, do Prado FD, Silveira RV et al. Molecular and morphological approaches for species delimitation and hybridization investigations of two Cichla species. Iheringia, Sér Zool. 2017; 107:1–09. https://doi.org/10.1590/1678-4766e2017016
Nadeau NJ, Kawakami T. Population Genomics of Speciation and Admixture 2018:613–53. https://doi.org/10.1007/13836_2018_24
Palumbi SR, Martin A, Romano S, McMillan WO, Stice L, Grabowski G. The simple fool’s guide to PCR version 2. Univ Hawaii, 2002; 96822(808):1–45.
de Queiroz K. Species concepts and species delimitation. Syst Biol. 2007; 56(6):879–86. https://doi.org/10.1080/10635150701701083
Rambaut A, Drummond AJ, Xie D, Baele G, Suchard MA. Posterior summarization in Bayesian phylogenetics using Tracer 1.7. Syst Biol. 2018; 67(5):901–04. https://doi.org/10.1093/sysbio/syy032
Ramos-Fregonezi AMC, Malabarba LR, Fagundes NJR. Population genetic structure of Cnesterodon decemmaculatus (Poeciliidae): A freshwater look at the Pampa biome in Southern South America. Front Genet. 2017; 8:1–10. https://doi.org/10.3389/fgene.2017.00214
dos Reis M, Donoghue PCJ, Yang Z. Bayesian molecular clock dating of species divergences in the genomics era. Nat Rev Genet. 2016; 17(2):71–80. https://doi.org/10.1038/nrg.2015.8
Reis RE, Malabarba LR. Revision of the neotropical cichlid genus Gymnogeophagus Ribeiro, 1918, with descriptions of two new species (Pisces, Perciformes). Rev Bras Zool. 1988; 4(4):259–305. https://doi.org/10.1590/S0101-81751987000400002
Salzburger W. Understanding explosive diversification through cichlid fish genomics. Nat Rev Genet. 2018; 19(11):705–17. https://doi.org/10.1038/s41576-018-0043-9
Seehausen O, Mayhew PJ, Van Alphen JJM. Evolution of colour patterns in East African cichlid fish. J Evol Biol. 1999; 12(3):514–34. https://doi.org/10.1046/j.1420-9101.1999.00055.x
Schwarzbold A, Schäfer A. Gênese e morfologia das lagoas costeiras do Rio Grande do Sul – Brasil. Amazoniana, 1984; 9(1):87–104.
Sivasundar A, Bermingham E, Orti G. Population structure and biogeography of migratory freshwater fishes (Prochilodus: Characiformes). Mol Ecol. 2001; 10:407–17. https://doi.org/10.1046/j.1365-294x.2001.01194.x
Sullivan J, Joyce P. Model Selection in Phylogenetics. Annu Rev Ecol Evol Syst. 2005; 36(1):445–66. https://doi.org/10.1146/annurev.ecolsys.36.102003.152633
Thompson JD, Higgins DG, Gibson TJ. CLUSTAL W: Improving the sensitivity of progressive multiple sequence alignment through sequence weighting, position-specific gap penalties and weight matrix choice. Nucleic Acids Res. 1994; 22(22):4673–80. https://doi.org/10.1093/nar/22.22.4673
Tomazelli LJ, Villwock JA. O Cenozóico costeiro do Rio Grande do Sul: geologia da planície costeira. In: Holz M, De Ros LF, editors. Geologia do Rio Grande do Sul. Edições CIGO/UFRGS, Porto Alegre. 2000. p.375–406.
Tougard C, García Dávila CR, Römer U, Duponchelle F, Cerqueira F, Paradis E et al. Tempo and rates of diversification in the South American cichlid genus Apistogramma (Teleostei: Perciformes: Cichlidae). PLoS ONE. 2017; 12(9):1–19. https://doi.org/10.1371/journal.pone.0182618
Turcati A, Serra-Alanis WS, Malabarba LR. A new mouth brooder species of Gymnogeophagus with hypertrophied lips (Cichliformes: Cichlidae). Neotrop Ichthyol. 2018; 16(4):1–09. https://doi.org/10.1590/1982-0224-20180118
Villwock JA. Geology of the coastal province of Rio Grande do Sul, Southern Brazil. A synthesis. Pesquisa em Geociências. 1984; 16(16):5–49. https://doi.org/10.22456/1807-9806.21711
Wagner CE, Harmon LJ, Seehausen O. Ecological opportunity and sexual selection together predict adaptive radiation. Nature, 2012; 487(7407):366–69. https://doi.org/10.1038/nature11144
Weschenfelder J, Corrêa ICS, Toldo Jr EE, Baitelli R. A drenagem pretérita do rio Camaquã na costa do Rio Grande do Sul. Pesqui. em Geocicienc. 2010; 37(1):13–23.
Wiley EO. The Evolutionary Species Concept Reconsidered. Syst Zool. 1978; 27(1):17. https://doi.org/10.2307/2412809
Willis SC, Macrander J, Farias IP, Ortí G. Simultaneous delimitation of species and quantification of interspecific hybridization in Amazonian peacock cichlids (genus Cichla) using multi-locus data. BMC Evol Biol. 2012; 12(96). https://doi.org/10.1186/1471-2148-12-96
Wimberger PH, Reis RE, Thornton KR. Mitochondrial phylogenetics, biogeography, and evolution of parental care and mating systems in Gymnogeophagus (Perciformes: Cichlidae). In: Malabarba LR, Reis RE, Vari RP, Lucena ZM, Lucena CA, editors. Phylogeny and classification of Neotropical fishes. Porto Alegre: Edipucrs; 1998.
Yeates DK, Seago A, Nelson L, Cameron SL, Joseph L, Trueman JWH. Integrative taxonomy, or iterative taxonomy? Syst Entomol. 2011; 36(2):209–17. https://doi.org/10.1111/j.1365-3113.2010.00558.x
Authors

![]() Pedro Ivo C. C. Figueiredo1,2,
Pedro Ivo C. C. Figueiredo1,2, ![]() Luiz R. Malabarba1,3 and
Luiz R. Malabarba1,3 and ![]() Nelson J. R. Fagundes1,2,4
Nelson J. R. Fagundes1,2,4 ![]()
[1] Programa de Pós-Graduação em Biologia Animal, Instituto de Biociências, Universidade Federal do Rio Grande do Sul, 91501-970 Porto Alegre, RS, Brazil. (PICCF) pedrocampani@gmail.com, (LRM) malabarb@ufrgs.br, (NJRF) nelson.fagundes@ufrgs.br (corresponding author).
[2] Programa de Pós-Graduação em Genética e Biologia Molecular, Instituto de Biociências, Universidade Federal do Rio Grande do Sul, 91501-970 Porto Alegre, RS, Brazil.
[3] Departamento de Zoologia, Instituto de Biociências, Universidade Federal do Rio Grande do Sul, 91501-970 Porto Alegre, RS, Brazil.
[4] Departamento de Genética, Instituto de Biociências, Universidade Federal do Rio Grande do Sul, 91501-970 Porto Alegre, RS, Brazil.
Authors Contribution
Pedro Ivo C. C. Figueiredo: Conceptualization, Formal analysis, Methodology, Writing-original draft.
Luiz R. Malabarba: Conceptualization, Formal analysis, Funding acquisition, Methodology, Resources, Supervision, Writing-original draft.
Nelson J. R. Fagundes: Conceptualization, Formal analysis, Funding acquisition, Methodology, Resources, Supervision, Writing-original draft.
Ethical Statement
All individuals used in the study came from the scientific collection of the Laboratory of Ichthyology, Department of Zoology, Universidade Federal do Rio Grande do Sul (UFRGS). We did not collect new specimens for this study, which was approved by the Research Committee of the Institute of Biosciences from the UFRGS (COMPESQ-IB) under project number 38299.
Competing Interests
The authors declare no competing interests.
How to cite this article
Figueiredo PICC, Malabarba LR, Fagundes NJR. Hydrography rather than lip morphology better explains the evolutionary relationship between Gymnogeophagus labiatus and G. lacustris in Southern Brazil (Cichlidae: Geophagini). Neotrop Ichthyol. 2021; 19(4):e200154. https://doi.org/10.1590/1982-0224-2020-0154
Copyright
This is an open access article under the terms of the Creative Commons Attribution License, which permits use, distribution and reproduction in any medium, provided the original work is properly cited.
Distributed under
Creative Commons CC-BY 4.0

© 2021 The Authors.
Diversity and Distributions Published by SBI
![]() Accepted July 22, 2021 by Lisa Whitenack
Accepted July 22, 2021 by Lisa Whitenack
![]() Submitted December 29, 2020
Submitted December 29, 2020
![]() Epub November 30, 2021
Epub November 30, 2021