![]() Gabriela O. Costa1
Gabriela O. Costa1 ![]() ,
, ![]() André B. Nobile1,
André B. Nobile1, ![]() Bruno F. Morales2,
Bruno F. Morales2, ![]() Bruno C. Rossini3,
Bruno C. Rossini3, ![]() Diogo Freitas Souza1,
Diogo Freitas Souza1, ![]() Érica A. Serrano Freitas1 and
Érica A. Serrano Freitas1 and ![]() Claudio Oliveira1
Claudio Oliveira1
PDF: EN XML: EN | Supplementary: S1 S2 | Cite this article
Associate Editor: ![]() José Birindelli
José Birindelli
Section Editor: ![]() William Crampton
William Crampton
Editor-in-chief: ![]() Carla PavanelliCarla Pavanelli
Carla PavanelliCarla Pavanelli
Abstract
O aumento alarmante no número de espécies ameaçadas ressalta a necessidade urgente de estratégias de conservação mais eficazes. Nesse contexto, os avanços em técnicas moleculares e em sequenciamento de alto rendimento têm sido fundamentais para fornecer abordagens mais rápidas e precisas para a avaliação da biodiversidade, em comparação com as metodologias tradicionais. A técnica de DNA metabarcoding facilita a identificação simultânea de múltiplas espécies a partir de amostras de DNA genômico, agrupadas usando primers universais. Para abordar a limitação das sequências de leitura curta, desenvolvemos um novo conjunto de primers que, em combinação com primers existentes, permite a montagem de sequências longas do gene COI por meio da sobreposição de leituras. Este estudo compara a eficácia do DNA barcoding e do metabarcoding em amostras de ictioplâncton, com foco em sua capacidade de recuperação de espécies. Usando amostras semelhantes, o DNA barcoding identificou 40 táxons, enquanto o DNA metabarcoding identificou 47 táxons. Essas descobertas destacam o potencial do DNA metabarcoding como uma abordagem robusta para a análise da comunidade ictioplanctônica, oferecendo dados abrangentes em nível de espécie, a custos reduzidos, e estabelecendo-o como uma ferramenta valiosa para iniciativas de conservação e gestão da biodiversidade.
Palavras-chave: Comunidades naturais, Ictioplâncton, Metagenômica, Montadores, NGS.
Introduction
The increasing disturbance and fragmentation of inland aquatic ecosystems has direct and often irreversible effects on their biota (Latrubesse et al., 2019). The principal threats to aquatic biodiversity, especially in urbanized regions with high population density, include deforestation, industrial and domestic pollution, farming, river impoundment, eutrophication, silting, flood controls, mining, aquaculture, fishing, and the introduction of exotic species (Dudgeon, 2019; Grill et al., 2019; Albert et al., 2021; Pelicice et al., 2021). These pressures intensify the level of threat to the ecological integrity of aquatic organisms, exacerbating the potential for extinction at local, regional, and global levels (Barnosky et al., 2011).
The impacts of these processes extend across all taxonomic groups, including organisms that are of special interest to humans, such as freshwater fishes, which are particularly sensitive to environmental disturbance (Brander, 2007; Dudgeon, 2010), and are prone to impacts on their diversity (Pelicice et al., 2017; Gordon et al., 2018; Dudgeon, 2019). Given their financial constraints, most official entities responsible for the conservation of biodiversity are obliged to adopt the most efficient possible practices, to minimize costs (Martin et al., 2018). A reliable understanding of biodiversity, and in particular, the capacity to identify specimens accurately, preferably to species, is fundamental for the development of effective conservation practices, by providing the data necessary for the assessment of taxonomic richness and abundance, and the detection of potential ecological imbalances (Simberloff et al., 2013; Imtiaz et al., 2017). An integrated approach, which combines the analysis of morphological traits and molecular parameters, can provide a valuable perspective for the resolution of taxonomic problems, such as the presence of homoplastic characters (Pedersen et al., 2019), phenotypic plasticity (Fernández-Osuna, Scarabotti, 2016), and the identification of early developmental stages (Chu et al., 2019) at the species level (Nakatani et al., 2001; Zacardi et al., 2014).
In the specific case of fish, integrated studies of the ichthyoplankton can provide valuable insights into the timing of the breeding season, and the location of spawning grounds and nursery areas (Miller, Kendall, 2019). Reliable data on these parameters can be extremely important for the development of conservation practices (Nakatani, 2001; Reynalte-Tataje et al., 2012), such as the delimitation of priority areas for conservation, and the development of management strategies and measures for the protection of fishery resources (Zacardi et al., 2020). This data can be vital to adequate decision-making by the federal or state agencies responsible for the conservation of a region’s fauna. The advances in molecular techniques are especially important for the identification of fish eggs and larvae, given the general lack of diagnostic traits in these initial developmental stages for traditional morphology-based taxonomy (Baumgartner et al., 2004; Reynalte-Tataje et al., 2012).
In recent years, the use of molecular techniques, such as DNA barcoding, proposed by Hebert et al. (2003), has been expanding in many areas, and has been shown to be effective for the diagnosis of many groups, including Neotropical fish, which are notoriously diverse, in terms of their taxonomy, phylogenetic relationships, and ecological functions (de Carvalho et al., 2011; Serrano et al., 2019; Pandey et al., 2020). While effective for the identification of species, DNA barcoding has certain limitations for the processing of large samples, especially those that contain a mixture of taxa, which may require extensive, often time-consuming analyses (Porter, Hajibabaei, 2018a,b). In this context, Next Generation Sequencing (NGS) has emerged as an evolving alternative, facilitating large-scale sequencing of numerous fragments with heightened efficiency, precision, and substantial cost reduction (Metzker et al., 2010; Koboldt et al., 2013; Pavan-Kumar et al., 2015). DNA metabarcoding, integrating DNA barcoding with NGS, offers the potential for high-throughput taxon identification from diverse samples (Taberlet, Coissac, 2012). This technique can swiftly generate extensive taxonomic data at a comparatively lower cost (Wicker et al., 2007; Novák et al., 2010; Taberlet, Coissac, 2012; Ghanbari et al., 2015; Maggia et al., 2017).
The use of DNA metabarcoding for the analysis of ichthyoplankton samples can provide an almost complete identification of the taxa present in an assemblage (Nobile et al., 2019; Govender et al., 2023). This data can contribute to the understanding of the general and systematic biology of the fish, as well as the identification of spawning grounds and reproductive periods (Burrows et al., 2019; De Lima et al., 2020; Mariac et al., 2021; Jiang et al., 2022; Silva et al., 2023). However, while some studies, such as that of Maggia et al. (2017), have highlighted the effectiveness of this approach for the recovery of a large percentage of species, the procedures required to achieve this level of success are still poorly documented. In fact, the approach may be limited by restricting the analysis to the single-end sequencing of short fragments of the COI gene, which can compromise the samples identification at species level (Nobile et al., 2019).Furthermore, the effectiveness of metabarcoding is highly dependent on the subsequent bioinformatics pipeline, particularly the choice and performance of assembly algorithms used to reconstruct full-length sequences from short reads (Hakimzadeh et al., 2024). Different assembly methodologies, such as those employing graph-based or overlap-greedy algorithms, exist and their comparative performance can vary significantly with the characteristics of the sequencing data and specific amplification strategies (Wajid, Serpedin, 2012).
Given this, the present study evaluated the viability of an adapted approach to the DNA metabarcoding of fish, which is compared with the traditional DNA barcoding technique. The protocol developed here was designed to amplify the COI gene by overlapping the reads generated by different sets of primers and thus overcome the principal limitation of the DNA metabarcoding approach. The dataset obtained from the sequencing of the ichthyoplankton samples was processed using three assemblers, to compare their potential differences in the recovery of taxa during the bioinformatic analyses.
Material and methods
Study area and field sampling. Samples were collected at six sites distributed longitudinally along the course of the Mogi-Guaçu River in São Paulo State, southeastern Brazil. These sites were in areas of rapids and on the floodplain and were selected to determine the existence of spawning grounds and nursery areas. The first three sites (S1–S3) were in an area of the river subject to impoundment, with site S1 approximately 20 km upstream from the Emas SHP (small hydroelectric plant) dam, site S2 immediately downstream from the dam, and site S3, 15 km further downstream, in rapids on a rocky mesa formation (Fig. 1; Tab. 1). The other three sites (S4–S6) were approximately 100 km downstream from site S3, in a meandering floodplain stretch of the Mogi-Guaçu River, with numerous marginal lakes. Sites S4 and S6 were separated by almost 40 km, and sites S1 and S6, by 175 km.
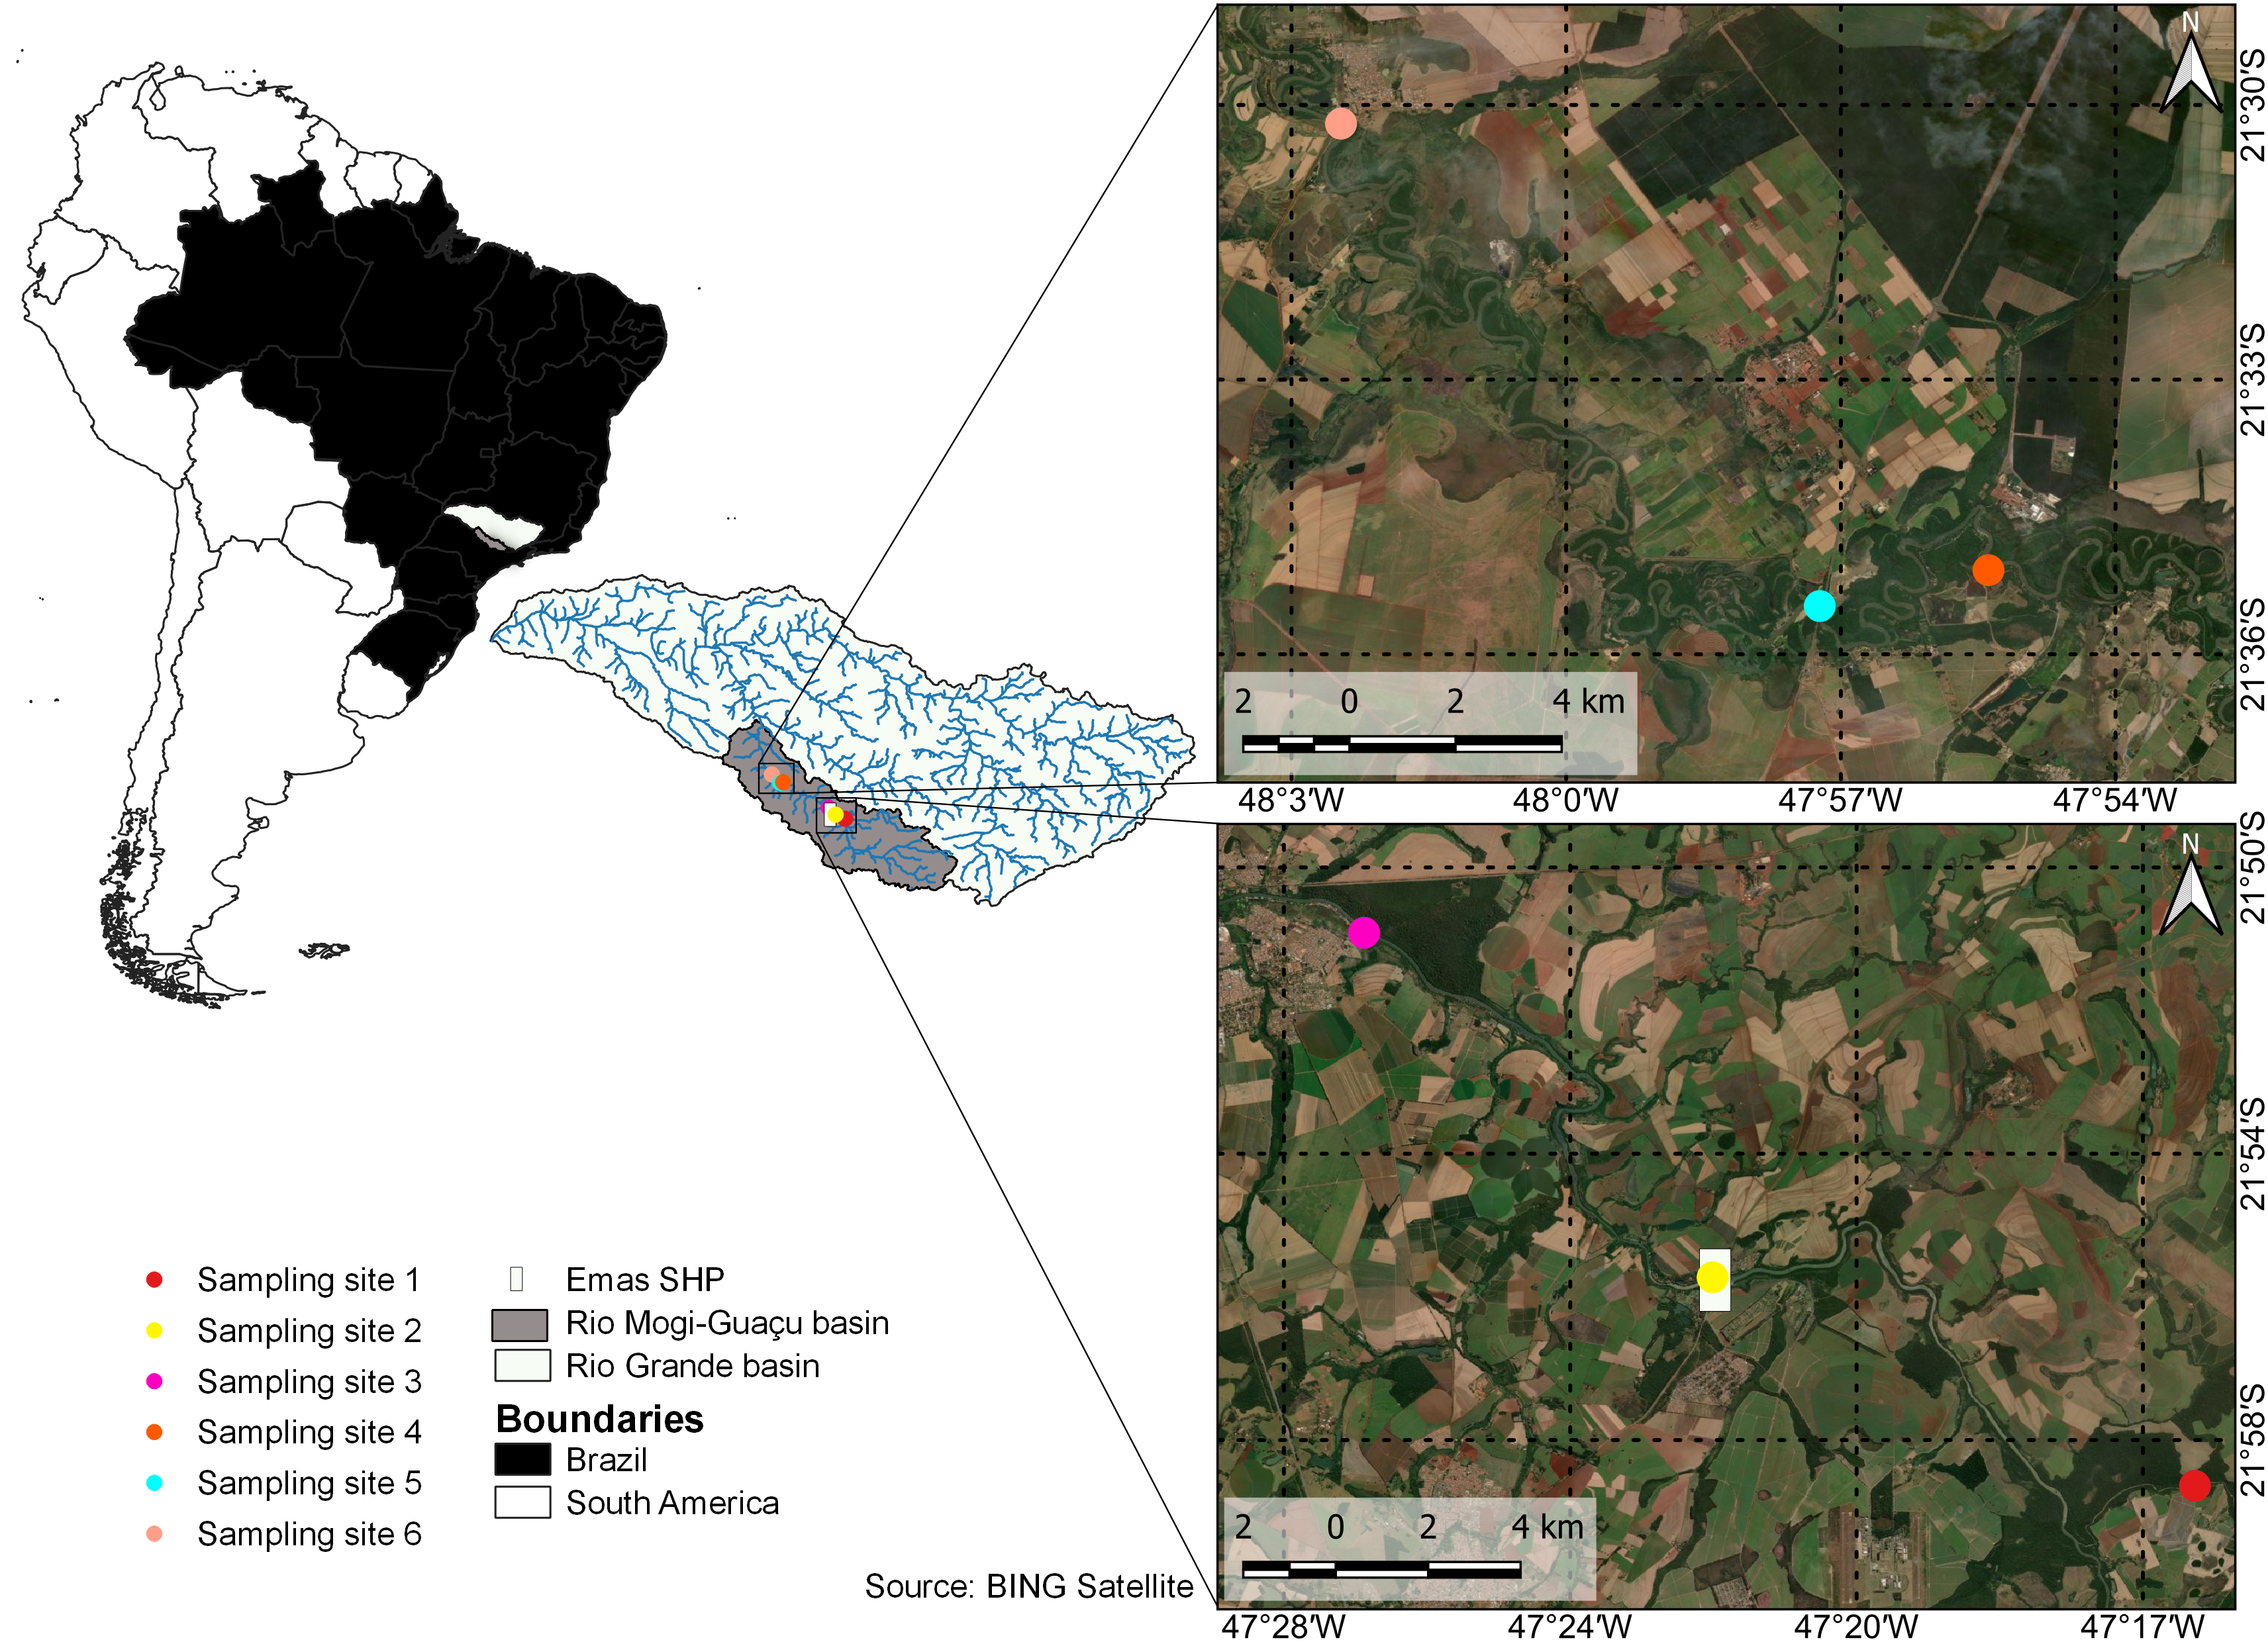
FIGURE 1| Sites sampled in the present study to collect the ichthyoplankton of the Mogi-Guaçu River in São Paulo, southeastern Brazil.
TABLE 1 | Geographic coordinates of the sites sampled during the present study on the Mogi-Guaçu River, in São Paulo, Brazil.
Site | Environment |
Location
in relation | Latitude | Longitude |
S1 | Rapids | Upstream | 21°58’10.70”S | 47°16’8.52”W |
S2 | Rapids | Downstream | 21°55’33.34”S | 47°22’12.53”W |
S3 | Rapids | Downstream | 21°51’13.30”S | 47°26’35.43”W |
S4 | Floodplain | Downstream | 21°35’4.95”S | 47°55’23.12”W |
S5 | Floodplain | Downstream | 21°35’28.48”S | 47°57’13.71”W |
S6 | Floodplain | Downstream | 21°30’12.20”S | 48°2’27.52”W |
The samples analyzed in the present study were collected during the rainy season, that is, between November and February, which is known to be the period most favorable for studies of the local ichthyoplankton (Oliveira et al., 2010; Barzotto, Mateus, 2017; Zacardi et al., 2017; Zoccal et al., 2018). Given this, monthly samples were collected in this period over four reproductive cycles. The first two cycles (November 2015 to February 2016 and November 2016 to February 2017) provided 48 samples for DNA barcoding, while the second two (December 2017 to February 2018 and November 2018 to February 2019) provided 42 samples for the DNA metabarcoding. A total of 90 samples were collected over the four years of the study period.
Samples were collected using a conical-cylindrical plankton net with a 0.5 mm mesh and a mouth with an area of 0.1104 m2, to which a General OceanicsTM flowmeter was attached, to measure the volume of water filtered by the net. All the samples were collected at night, given that previous studies, such as that of Zoccal et al. (2018), have shown that larval densities tend to be higher after dusk. As all the sites are lotic, it was possible to collect the samples by maintaining the net under the water in a fixed position for a 10 min period, standardized for all sites. The samples collected in the net were immediately immersed in a 3% eugenol solution before being fixed in 96% ethanol. In the laboratory, a stereomicroscope was used to examine the samples and separate the eggs and larvae from the other material (leaves, sediments, and other organic matter) present in the water. These specimens were maintained in 96% ethanol until sequencing in the laboratory.
DNA barcoding. For the DNA barcoding, the total DNA was extracted from the fish eggs and larvae following the protocol described by Ivanova et al. (2007). The barcoding region of the cytochrome c oxidase subunit I (COI) gene was amplified using the FishF1 and FishR1 primers described by Ward et al. (2005). PCR conditions were: 1 min at 96 °C followed by 35 cycles of 10 s at 96 °C, 5 s at 50 °C and 4 min at 60 °C. The PCR product was sequenced using a Big Dye 3.1 Terminator kit (Applied Biosystems) in an ABI Prism 3130 (Applied Biosystems), generating two complementary sequences of 654 bp. The consensus sequences were assembled and edited in Geneious Pro 4.8.5 (Kearse et al., 2012, available at: http://www.geneious.com) and then compared with reference sequences obtained from the BOLD (Barcode of Life – BOLD Systems) and GenBank (National Center for Biotechnology Information – NCBI) databases. The sequences were classified taxonomically based on their similarity with the reference sequences, being assigned to a taxon when their coverage and similarity was at least 97%. The classification and taxonomic nomenclature adopted follow the criteria established by Fricke et al. (2025), with the families identified in Tab. S1 arranged in alphabetical order within their respective orders.
DNA metabarcoding. For the DNA metabarcoding approach, each sample found to contain ichthyoplankton was pooled for analysis, although the eggs and larvae were stored separately. Each pool (i.e., bulk samples) contained all the biological material found in the sample, except in the case of two samples that contained more than 300 larvae, which were each divided into two subsamples for analysis. This sorting resulted in a total of 37 pools, consisting of 25 pools of eggs, containing 11–703 individuals, and 12 pools of larvae, with between 11 and 255 individuals. To ensure the identification of the largest possible number of species, all the larvae were included in the respective pools, regardless of their size, following the protocol of Nobile et al. (2019). The total genomic DNA was obtained from each of the pools (of eggs and larvae) using the protocol of Green, Sambrook (2012).
Once the DNA had been extracted from each pool, it was visualized on an 2% agarose gel prior to the amplification of the COI region. Half of the primers used here were developed previously by Ward et al. (2005) and Jennings et al. (2019), while the others were designed specifically for the present study and contained adapters for the P5 and P7 regions for use on the Illumina sequencing platform (Tab. 2; Fig. 2). These primers were designed based on the COI gene sequences of approximately 200 fish species from both fresh- and saltwater environments. The internal primers contain degenerate bases, which enhance the capacity of the sequences to identify a broad range of species. The two PCR steps involve the amplification of the COI gene in fragments of approximately 450 bp. This approach aims to optimize the sequencing by using 2 x 250 bp or 2 x 300 bp cartridges (Illumina MiSeq), which ensures a minimum overlap of 30 bp between the pairs of reads and provides complete coverage of the target fragment.
TABLE 2 | Nucleotide sequences of the primers used in the present study to amplify the Cytochrome c oxidase subunit I (COI) gene, linked to the Illumina adapter sequences. These sequences include both external (FishF1, FishF2, FishF6, FishR1, FishR2, and FishR7) and internal primers (219F, 217F, 214F, 433R, 432R, and 434R).
Primer | Sequence: 5’–3’ | Source |
FishF1 | TCGTCGGCAGCGTCAGATGTGTATAAGAGACAGTCAACCAACCACAAAGACATTGGCAC | Ward et al. (2005) |
FishF2 | TCGTCGGCAGCGTCAGATGTGTATAAGAGACAGTCGACTAATCATAAAGATATCGGCAC | Ward et al. (2005) |
FishF6 | TCGTCGGCAGCGTCAGATGTGTATAAGAGACAGACYAAYCACAAAGAYATTGGCA | Jennings et al. (2019) |
219F | TCGTCGGCAGCGTCAGATGTGTATAAGAGACAGCCCGACATRGCATTCCCYC | Present study |
217F | TCGTCGGCAGCGTCAGATGTGTATAAGAGACAGCCCCCGACATRGCMTTCCC | Present study |
214F | TCGTCGGCAGCGTCAGATGTGTATAAGAGACAGGDGCCCCCGACATAGCATTY | Present study |
FishR1 | GTCTCGTGGGCTCGGAGATGTGTATAAGAGACAGTAGACTTCTGGGTGGCCAAAGAATCA | Ward et al. (2005) |
FishR2 | GTCTCGTGGGCTCGGAGATGTGTATAAGAGACAGACTTCAGGGTGACCGAAGAATCAGAA | Ward et al. (2005) |
FishR7 | GTCTCGTGGGCTCGGAGATGTGTATAAGAGACAGTARACTTCTGGRTGDCCRAAGAAYCA | Jennings et al. (2019) |
433R | GTCTCGTGGGCTCGGAGATGTGTATAAGAGACAGCCCGACATAGYATTCCCHC | Present study |
432R | GTCTCGTGGGCTCGGAGATGTGTATAAGAGACAG CCCCTAGAATTGAGRAAACHCC | Present study |
434R | GTCTCGTGGGCTCGGAGATGTGTATAAGAGACAG AGCCCCTAGAATTGAGGARACHC | Present study |
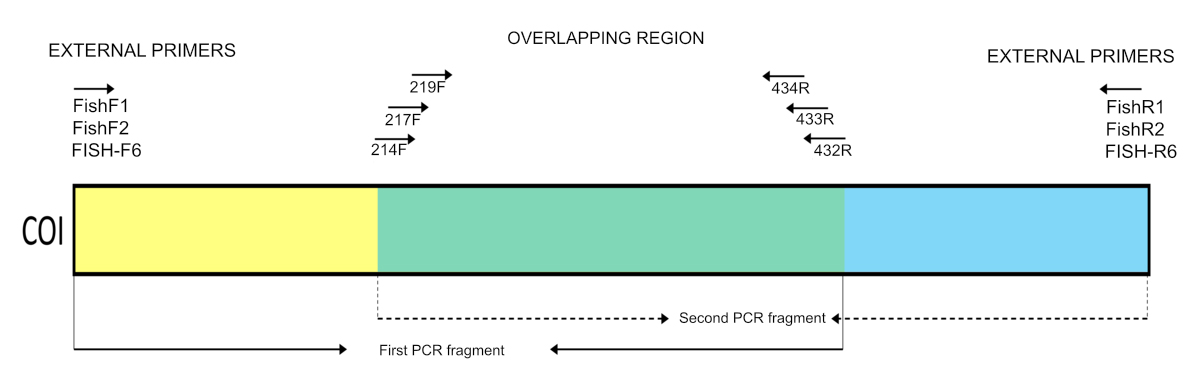
FIGURE 2| Overview of the set of primers used in the present study to amplify the Cytochrome c oxidase subunit I (COI) gene on the Illumina platform.
We employed two PCRs to amplify the fragments. Upon conducting a single amplification using six pairs of primers, we noted the presence of numerous bands within the agarose gel. Considering this circumstance, we adopted a modified approach wherein three long fragments and three short fragments were alternately interleaved. In the first PCR, the solution contained 0.2 μL of the DNA (≅ 35 ng/µL), 12.5 μL of Master Mix (Promega), 10 μL of the first set of primers (FishF1+FishF2+FishF6+433R+432R+434R), each primer at 10mM, and 2.3 µL of water, for a final volume of 25 µL. The PCR conditions were 95°C for 3 min, followed by five cycles of 95°C for 30 s, 50°C for 1 min, and 72°C for 1 min, and then 30 cycles of 95°C for 30 s, 54°C for 1 min, and 72°C for 1 min, with a final extension at 72°C for 20 min. In the second PCR, each reaction contained 0.2 μL of the DNA (≅ 35ng/ul), 12.5 μL of Master Mix (Promega), 10 μL of the second set of primers (FishR1+FishR2+FishR7+219F+217F+214F), each primer at 10mM, and 2.3 μL of water, resulting in a final volume of 25 μL. In this case, the PCR conditions were 95°C for 3 min, followed by 30 cycles of 95°C for 30 s, 56°C for 1 min, and 72°C for 1 min, and then final extension at 72°C for 20 min. The integrity and size of the products were verified on a 2% agarose gel, with a 1kb plus ladder.
Libraries were prepared according to the procedure described in the Illumina 16S Metagenomic Sequencing Library guide (Illumina, San Diego). The amplicons were purified using Agencourt AMPure XP magnetic beads (Beckman Coulter), according to the manufacturer’s protocol, and the DNA was then resuspended in 50μL of 10mM Tris-HCl (pH 8.5). The purified amplicons were double indexed with the Nextera Index kit (Illumina), Index 1 (N7XX), and Index 2 (S5XX), and further purified according to the protocol. The indexing reaction was run in 25μL of Master Mix, with 5 μL of each Index (N7XX and S5XX), 10 μL of sterile ultrapure water, and 5μL of the DNA, with a final reaction volume of 50μL. The PCR cycle applied here was: 3 min at 95°C, followed by eight cycles of 30 s at 95°C, 30 s at 52°C, and 30 s at 72°C, with a final extension of 5 min at 72°C.
The libraries were quantified in a Qubit 4.0 fluorometer (Invitrogen) with the Qubit dsDNA HS Assay kit (Invitrogen), and the concentration of each sample was then standardized, and all the samples were pooled. The libraries were quantified for one last time by qPCR using the Qubit dsDNA HS Assay kit (KAPA Library Quantification Kit, Roche), normalized to 10 nM, diluted in 10 mM Tris-HCl pH 8.5 with 0.1% Tween 20, with 30% PhiX added to a final concentration of 12 pM. The samples were then sequenced on the MiSeq Illumina platform with the MiSeq Reagent Nano kit v. 2 (500 cycles), with the aim of a mean coverage of 20k reads per pool.
The sequences were pre-processed by checking the quality of each library containing the raw reads in FastQC (Andrews, 2010) and excluding those with a Q score of less than 30 (<Q30). The reads were paired using Paired-End reAd mergeR (PEAR) v. 0.9.5 (Zhang et al., 2014), considering only those with an overlap of at least 30 base pairs (bp) and a minimum contig size of 400 bp. The adapters, and the forward and reverse primers were removed using CUTADAPT v. 3.4 (Martin, 2011) to reduce the chances of alignment between the sequences of different species. The reads were then dereplicated in the USEARCH algorithm, v. 11.0.667 (Edgar, 2010) to eliminate identical reads (using the -fastx_uniques option) and chimera sequences (-uchime3_denovo option). The libraries were then assembled using three assemblers, two of which are specific for metagenomic studies, that is, Geneious, v. 8.0.3 (Biomatters Ltd, High sensitivity/medium option) and Megahit (k 35–255, k-step 28; Li et al., 2015), as well as MetaSpades (with the -meta option, and k values of 31, 55, 75, 95, 127; Nurk et al., 2017). To determine the species, the contigs obtained by each assembler were compared with the NCBI (BLAST) database to identify contigs with 97% or more similarity. The classification and taxonomic nomenclature adopted follow the criteria established by Fricke et al. (2025), with the families identified in Tab. S1 arranged in alphabetical order within their respective orders. The cd-hit-est option of the CD-HIT software (Fu et al., 2012) was used to compare the results of the three assemblers, applying a threshold of 0.98 to minimize duplicated sequences.
To analyze the variation in the number of species recovered among the assemblers, used individually or in combination, and across sampling points, an analysis of variance (ANOVA) was conducted, followed by Tukey’s post hoc tests. The assumptions for performing the ANOVA were met through the Shapiro-Wilk normality test (p = 0.26) and Levene’s homoscedasticity test (p = 0.99). Statistical analyses were performed using RStudio software version 2022.07.2 (RStudio Team, 2022) and the packages “vegan” (Oksanen et al., 2016), “CAR” (Fox, Weisberg, 2019), “MASS” (Venables, Ripley, 2002), and “postHoc” (Labouriau, 2020). The graphs were produced in RStudio v. 2022.07.2 (RStudio Team, 2022), and the “vegan” (Oksanen et al., 2016), “ggplot2” (Wickham, 2016), “dplyr” (Wickham et al., 2022), and “tidyr” packages (Wickham, Girlich, 2022).
The relationship between the number of reads and abundance was assessed using generalized linear models (GLMs) with a quasipoisson distribution and a logarithmic link function. The quasipoisson distribution was chosen due to the presence of overdispersion (where the variance of the data exceeds the mean). Accordingly, the expected number of reads was tested based on the abundance (βa) for each species (βe), in accordance with the equation log µae = βa:βe. The β coefficients represent the joint contributions of the variable (abundance) and the factor (species), estimated using maximum likelihood. Relationships were tested separately for isolated and combined assemblers, as well as for the overall dataset, which included all data from both isolated and combined assemblers.
Results
DNA barcoding. A total of 13,609 individuals, including 12,507 eggs and 1,102 larvae, were collected during the first two years of the present study. The application of the DNA barcoding technique to a subset of 1,811 organisms (randomly selected from samples with large quantities of captured individuals) enabled the differentiation of 40 taxa, of which 38 were identified to species level, and the other two, to subfamily (Cheirodontinae I and II). These taxa represented four orders and 18 families. While four other taxa were also recovered during a preliminary analysis, and were added to the inventory, they were not included in the comparative analyses presented here.
The frequency of occurrence (FO) of the species identified by DNA barcoding was determined from the 12 samples. These species were classified into two groups: FO ≥ 25% (22 taxa) and FO < 25%, with 18 taxa. The species with the highest FO value was Pimelodus maculatus Lacepède, 1803, which was recorded in 83.3% of the samples, followed by Megaleporinus obtusidens (Valenciennes, 1837) (66.7%) and Cheirodontinae I (66.7%). The species with the lowest frequencies of occurrence were Megalamphodus eques (Steindachner, 1882) (16.7%), Cyphocharax naegelii (Steindachner, 1881) (8.3%), and Phenacorhamdia tenebrosa (Schubart, 1964) (8.3%).
DNA Metabarcoding. Overall, 35 of the 42 samples collected during the two years of the present study contained eggs or larvae. These samples were sorted by the life stage (egg or larva), month, and site. A total of 5,125 organisms were captured, including 3,567 eggs and 1,558 larvae, divided into 37 pools (due to the division of two of the pools). Two of these pools were nevertheless excluded from the analyses due to their insufficient concentration of DNA. The remaining pools generated a total of 683,653 paired-end reads on the Illumina MiSeq platform, with a mean of 19,532 reads (standard deviation = 5,887) per pool. Approximately 84% of the reads returned Q values of over 30, and the contigs with fragments of less than 600 bp were excluded. The sequencing of the libraries resulted in the identification of 47 taxa, representing four orders and 14 families. Seven of these taxa were identified to genus, and the remaining 40 to species (Tab. S1).
Comparison of the methods. A total of 44 species were identified using DNA barcoding and 47 species were detected by DNA metabarcoding, with 24 species shared between both methods (Tab. S1). The DNA metabarcoding technique recovered a larger number of exclusively taxa at sites S1 and S6 (both with 19 taxa), while the DNA barcoding exclusively identified more taxa at site S5 (17 taxa) (Fig. 3). Sites S1 and S6 had the largest number of taxa identified by both techniques, each with eight shared taxa. Site S6 was also the site with the largest number of identified taxa (N = 43), followed by S4, with 35, and S5, with 31. The smallest number of taxa (N = 22) was recorded at site S1.
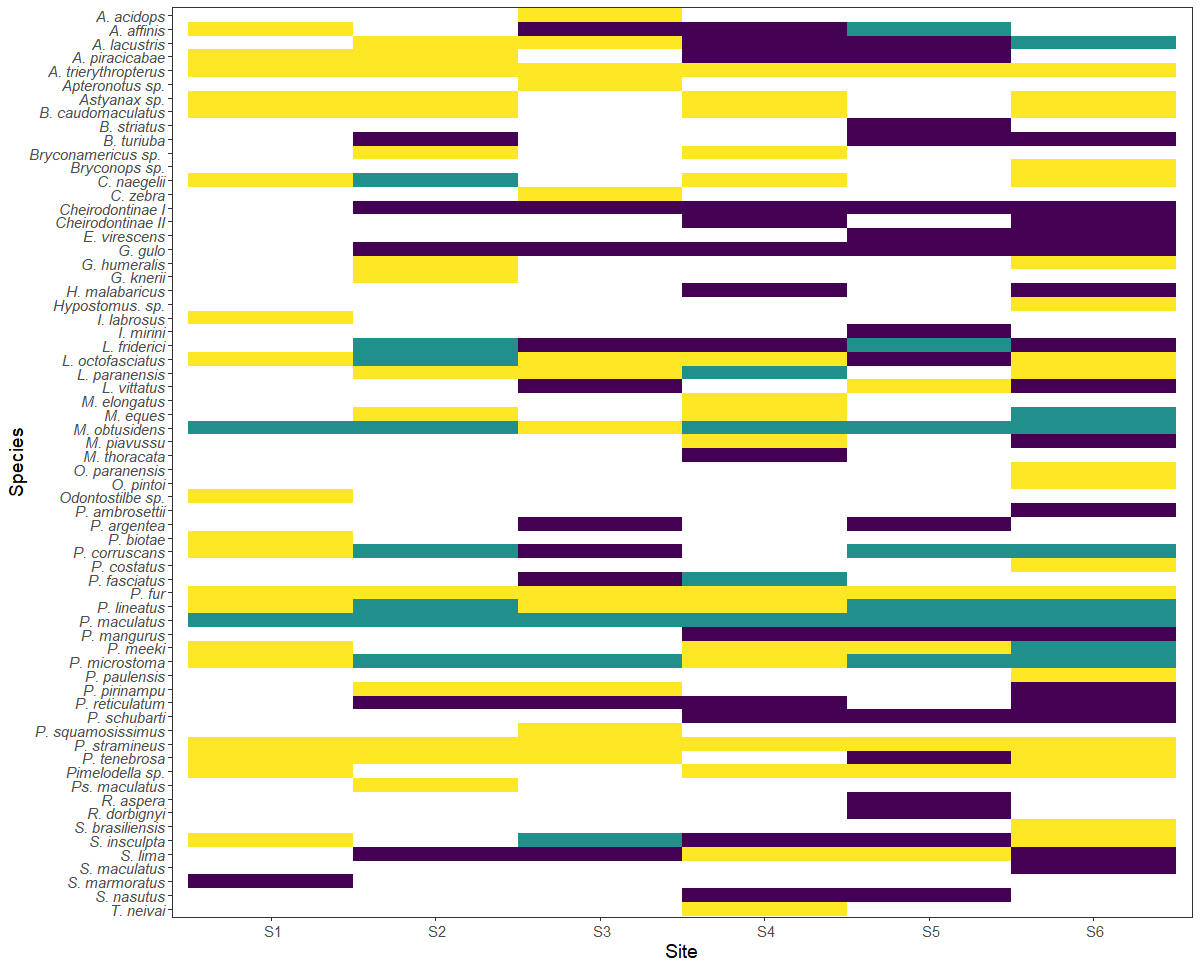
FIGURE 3| Fish species identified by the DNA barcoding and metabarcoding techniques per site. Yellow bars = DNA metabarcoding, Purple bars = DNA barcoding, Green bars = both techniques. See full taxon names in Tab. S1.
Most (68.75%) of the 22 most common species (FO > 25%) identified by DNA barcoding were also identified by metabarcoding, with seven species, Apareiodon affinis (Steindachner, 1879), Leporinus octofasciatus Steindachner, 1915, M. obtusidens, Prochilodus lineatus (Valenciennes, 1837), P. maculatus, Pseudoplatystoma corruscans (Spix & Agassiz, 1829), and Sorubim lima (Bloch & Schneider, 1801), recovered by all three assemblers. In the case of the less common species (FO < 25%), by contrast, less than half (45.84%) of the taxa, that includes Psalidodon fasciatus (Cuvier, 1819), C. naegelii, M. eques, Leporellus vittatus (Valenciennes, 1850), Leporinus paranensis Garavello & Britski, 1987, Megaleporinus piavussu (Britski, Birindelli & Garavello, 2012), P. tenebrosa and Pinirampus pirinampu (Spix & Agassiz, 1829), identified by both DNA barcoding and metabarcoding. Among these species, only C. naegelii, M. eques, P. tenebrosa and P. pirinampu were recovered by all three assemblers. In the rarest taxa (FO < 10%), the DNA metabarcoding only recorded 38.46% of the species recovered by the DNA barcoding (Fig. 3; Tab. S1). Geneious had the best recovery performance of the three assemblers for the more common species (FO > 25%), with a total of 12 taxa, followed by Megahit with 10 taxa, and MetaSpades with only seven. In the case of the uncommon species (FO < 25%), Geneious and MetaSpades recovered six taxa and Megahit recovered five. More than two-thirds (69.23%) of the species recovered by the DNA metabarcoding were present at site 6 (Fig. 3).
Comparison of the assemblers. The species richness recovered by DNA metabarcoding varied considerably among the three assemblers (Geneious, Megahit, and MetaSpades) and their different combinations (Fig. 4). Overall, 42.55% of the species identified in the present study were recovered by only one of the three assemblers. An additional 8.51% of the species were recovered by two assemblers, but from different pools, whereas 14.89% were identified by all three assemblers, but once again, not in the same pools. This indicates a very limited number of shared species.
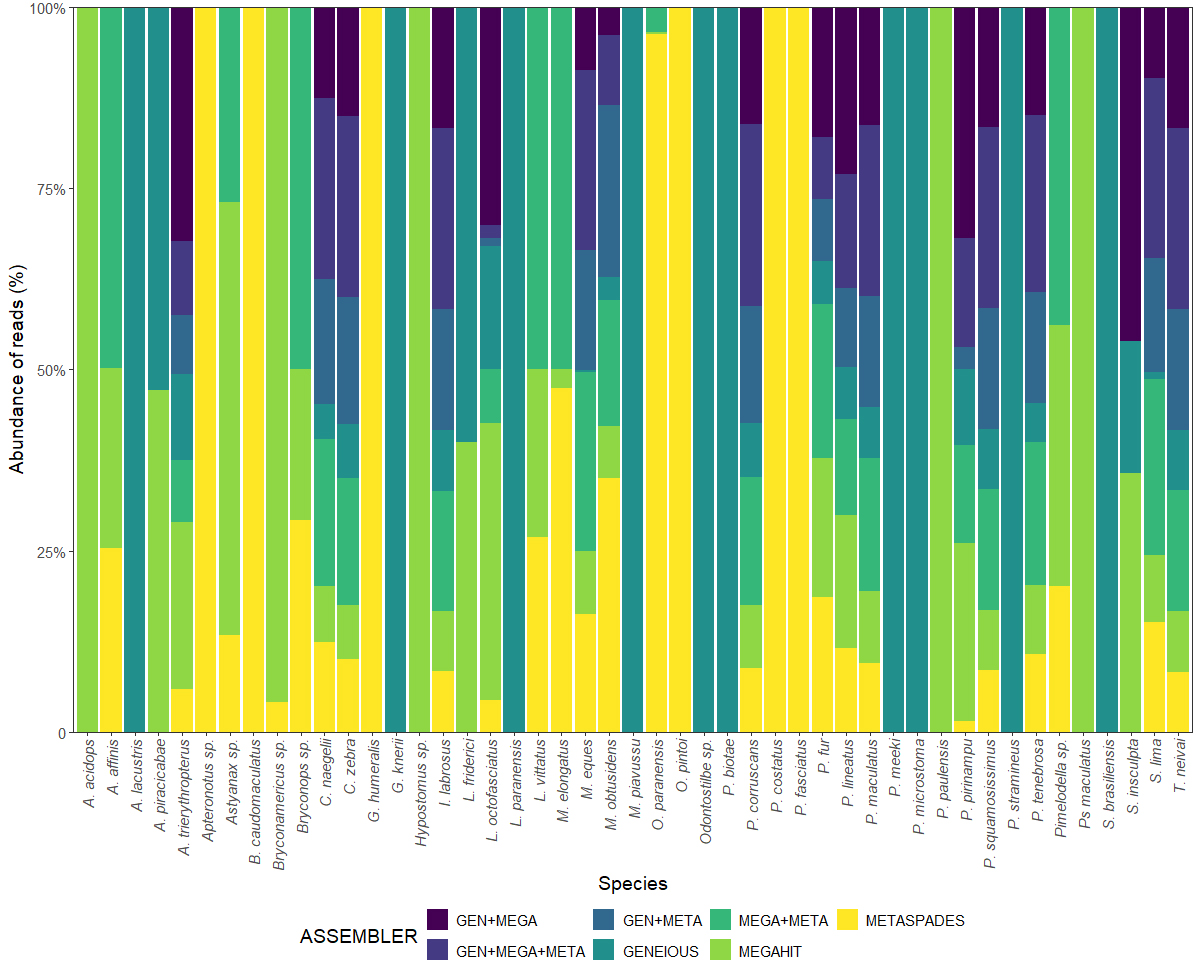
FIGURE 4| Barplot of the relative abundance of reads of the different fish species recovered by the different assemblers employed in the present study. GEN = Geneious, MEGA = Megahit, META = MetaSpades. See full taxon names in Tab. S1.
Using only the Geneious assembler, it was possible to recover 100% of the reads of only nine species and one genus, while Megahit was able to recover 100% of the reads of only three species and one genus, and MetaSpades, five species and one genus. It was necessary to use two different assemblers to recover 100% of the reads of three species and one genus, and all three assemblers to recover 100% of the reads of four species and three genera. For 15 species, data from the individual assemblers and their four combinations were necessary to recover 100% of the reads.
Considering analyses conducted with data obtained from isolated or combined assemblers, we observed a significant relationship between the number of reads and abundance only for P. maculatus (p = 0.027) using the assembler Geneious. No significant relationships were identified for the other assemblers or their combinations concerning the recovered species (p > 0.05). For the overall dataset, a significant relationship was found between the number of reads and abundance (p < 0.05) for the species Leporinus friderici (Bloch, 1794), A. lacustris, Astyanax sp., L. paranensis, P. costatus, A. piracicabae, P. stramineus, P. meeki, M. obtusidens, P. squamosissimus, O. paranensis, A. affinis, P. microstoma, Pimelodella sp., P. pirinampu, P. corruscans, I. labrosus, M. eques, and P. maculatus. Except for P. maculatus, which exhibited the highest total number of reads, the other species with significant relationships had their total reads within the range of 5,000 to 90,000 reads. Below and above this range, no relationship was verified (p > 0.05).
In the case of density, the three assemblers also revealed distinct trends, with Megahit and Geneious recovering a wider range of resolution of the data, and Metaspades, a much more limited resolution (Fig. 5). In addition, while Megahit and Geneious found little variation across the different pools, Metaspades recorded a higher density of species in pools 1–15, followed by an abrupt, and then progressive decline in the subsequent pools (see Fig. 5).
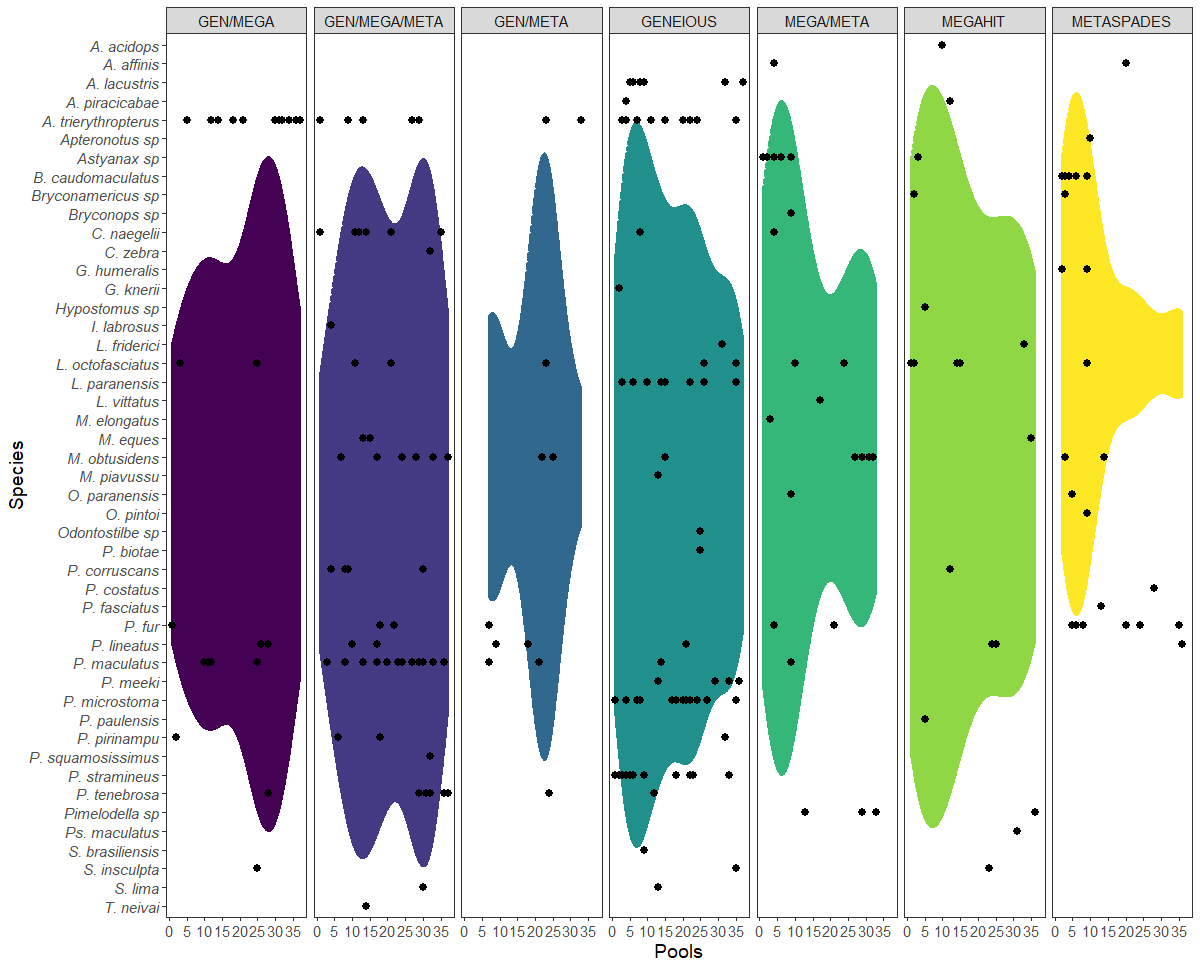
FIGURE 5| Violin graph showing the trends of the distribution of the species identified among the pools and the assemblers used in the present study. The black dots indicate the presence of a given species in the respective pool. See full taxon names in Tab. S1.
The overlap in the taxa detected by the three assemblers (Fig. S2), shows that the largest number of species (N = 31) was recovered by Megahit, followed by Geneious and MetaSpades, each with 29. Megahit and MetaSpades recovered the largest number of shared species (N = 23). The combination of Geneious and Megahit recovered 17 shared species, while the combination of Geneious and MetaSpades, and all three assemblers together, recovered the smallest number of shared species (N = 16). Megahit also recovered the largest number of reads (461,619) for the assembly of the contigs, followed by MetaSpades (421,633 reads), and Geneious (307,290 reads).
Based on the statistical inferences, we found significant differences in the number of species recovered among the assemblers (p < 0.05), while Tukey’s post hoc tests indicated that the significant differences (p < 0.05, Tab. 3) are attributable to the isolated versus combined use of the assemblers (e.g., Geneious versus Geneious+Metaspades, Metaspades versus Megahit+Metaspades, etc.). The taxa detected by the three assemblers are listed in Fig. S2 At most sites, Geneious (N = 29) recovered the largest number of species, while Metaspades (N = 29) tended to recover the smallest number, except at site S5, where it recorded the largest number (although the smallest number of taxa (N = 10) was recovered from this site), and S6, where all three assemblers recovered the same number of taxa. This pattern was reversed in the recovery of reads, however, given that Metaspades (N = 29) and Megahit (N = 31) obtained the largest numbers of reads, and Geneious (N = 29) recorded the smallest numbers.
TABLE 3 | Results of Tukey post hoc tests, with comparison of all possible linear hypotheses between assemblers. * = p < 0.05, indicating statistical significance.
Linear hypotheses | Estimate | Std. Error | z value | Pr(>|z|) |
GEN+MEGA+META(N=16) ↔ GEN+MEGA(N=17) | -3.99E+02 | 3.59E+02 | -1.110 | 0.91971 |
GEN+META(N=16) ↔ GEN+MEGA(N=17) | -2.04E+02 | 3.40E+02 | -0.599 | 0.99655 |
GENEIOUS(N=29) ↔ GEN+MEGA(N=17) | 1.06E+03 | 2.64E+02 | 4.006 | 0.00119* |
MEGA+META(N=23) ↔ GEN+MEGA(N=17) | -2.67E+01 | 3.24E+02 | -0.082 | 100.000 |
MEGAHIT(N=31) ↔ GEN+MEGA(N=17) | 1.06E+03 | 2.64E+02 | 4.006 | 0.00127* |
METASPADES(N=29) ↔ GEN+MEGA(N=17) | 1.06E+03 | 2.64E+02 | 4.006 | 0.00107* |
GEN+META(N=16) ↔ GEN+MEGA+META(N=16) | 1.95E+02 | 3.75E+02 | 0.521 | 0.99843 |
GENEIOUS(N=29) ↔ GEN+MEGA+META(N=16) | 1.46E+03 | 3.09E+02 | 4.723 | < 0.001* |
MEGA+META(N=23) ↔ GEN+MEGA+META(N=16) | 3.72E+02 | 3.61E+02 | 1.031 | 0.94301 |
MEGAHIT(N=31) ↔ GEN+MEGA+META(N=16) | 1.46E+03 | 3.09E+02 | 4.723 | < 0.001* |
METASPADES(N=29) ↔ GEN+MEGA+META(N=16) | 1.46E+03 | 3.09E+02 | 4.723 | < 0.001* |
GENEIOUS(N=29) ↔ GEN+META(N=16) | 1.26E+03 | 2.86E+02 | 4.420 | < 0.001* |
MEGA+META(N=23)↔ GEN+META(N=16) | 1.77E+02 | 3.42E+02 | 0.518 | 0.99848 |
MEGAHIT(N=31) ↔ GEN+META(N=16) | 1.26E+03 | 2.86E+02 | 4.420 | < 0.001* |
METASPADES(N=29) ↔ GEN+META(N=16) | 1.26E+03 | 2.86E+02 | 4.420 | < 0.001* |
MEGA+META(N=23) ↔ GENEIOUS(N=29) | -1.09E+03 | 2.67E+02 | -4.066 | < 0.001* |
MEGAHIT(N=31) ↔ GENEIOUS(N=29) | 4.44E-13 | 1.90E+02 | 0.000 | 100.000 |
METASPADES(N=29) ↔ GENEIOUS(N=29) | 2.22E-13 | 1.90E+02 | 0.000 | 100.000 |
MEGAHIT(N=31) ↔ MEGA+META(N=23) | 1.09E+03 | 2.67E+02 | 4.066 | < 0.001* |
METASPADES(N=29) ↔ MEGA+META(N=23) | 1.09E+03 | 2.67E+02 | 4.066 | < 0.001* |
METASPADES(N=29) ↔ MEGAHIT(N=31) | -2.22E-13 | 1.90E+02 | 0.000 | 100.000 |
Statistical differences were verified in the number of species recovered among sites (p < 0.05), while Tukey’s post hoc tests indicated that the significant differences (p < 0.05, Tab. 4) are focused on the number of species recovered only for site 6, when compared with the other sampling sites.
TABLE 4 | Results of Tukey post hoc tests, with comparison of all possible linear hypotheses between sampling sites. * = p < 0.05, indicating statistical significance.
Linear hypotheses | Estimate | Std. Error | t value | Pr(>|t|) |
2 ↔ 1 | 94.286 | 35.519 | 2.655 | 0.11516 |
3 ↔ 1 | 75.714 | 35.519 | 2.132 | 0.29898 |
4 ↔ 1 | 61.429 | 35.519 | 1.729 | 0.52397 |
5 ↔ 1 | 0.8571 | 35.519 | 0.241 | 0.99988 |
6 ↔ 1 | 242.857 | 35.519 | 6.837 | < 0.001* |
3 ↔ 2 | -18.571 | 35.519 | -0.523 | 0.99482 |
4 ↔ 2 | -32.857 | 35.519 | -0.925 | 0.93688 |
5 ↔ 2 | -85.714 | 35.519 | -2.413 | 0.18402 |
6 ↔ 2 | 148.571 | 35.519 | 4.183 | 0.00289* |
4 ↔ 3 | -14.286 | 35.519 | -0.402 | 0.99850 |
5 ↔ 3 | -67.143 | 35.519 | -1.890 | 0.42719 |
6 ↔ 3 | 167.143 | 35.519 | 4.706 | < 0.001* |
5 ↔ 4 | -52.857 | 35.519 | -1.488 | 0.67411 |
6 ↔ 4 | 181.429 | 35.519 | 5.108 | < 0.001* |
6 ↔ 5 | 234.286 | 35.519 | 6.596 | < 0.001* |
Discussion
Two alternative molecular approaches were applied in the present study to amplify both short and long fragments of the COI gene, using a combination of existing primers and primers developed specifically for this study. This combined approach was adopted not only to obtain the barcoding COI sequence (about 650 bp), but also to mitigate potential issues related to incomplete assemblages derived from complex genomic regions, such as repetitive sequences (Tørresenet al., 2019).
Both DNA barcoding and metabarcoding recovered a comparable number of species (44 and 47, respectively); however, the overlap between the two techniques was relatively low, which is uncommon in metabarcoding studies where greater congruence is typically expected (Taberlet et al., 2012; Teixeira et al., 2023). This divergence may be explained by unusually high rainfall during the reproductive cycles sampled, which drastically altered environmental conditions and affected the distribution and abundance of ichthyoplankton (Brambilla et al., 2025).
Oligosarcus paranensis was the only identified taxon with a sequence similarity below 97%. In this case, the sequences were initially identified as Oligosarcus jenynsii (Günther, 1864), based on reference database comparisons. However, since this species is not known to occur in the study area, the species was assumed to be O. paranensis, which has been recorded in previous fish inventories in the study region (Maier et al., 2008; de Araújo et al., 2011; Viana et al., 2013). One possible explanation for this case is the misidentification of the reference sequence in the databases, which may result in taxonomic inconsistencies (Collins, Cruickshank, 2013; Salvi et al., 2020).
A significant correlation as observed between the number of reads and organism abundance in species with intermediate read counts. This pattern is consistent with findings of Sickel et al. (2023), who reported that species within median abundance ranges often show positive correlations, while high and low abundance extremes are impacted by saturation bias and amplification efficiency. In metabarcoding approaches, it is important to acknowledge that there is a species detection limit, mainly because low-abundance species might be missed if their DNA is present in insufficient quantities to be detected in the sequencing process (Deagle et al., 2014). Alongside these findings, it is essential to account for potential biases, as highlighted, the efficiency of PCR amplification efficiency (Jusino et al., 2019; Skelton et al., 2022) can skew the representation of specific taxa, and sequencing platform choice (Leray, Knowlton, 2017) may further affect read counts and, consequently, community structure and abundance estimations.
In addition, several other biases may also distort the relationship between the abundance of individuals and the reads generated, ranging as the limitations of the storage and integrity of the DNA (Martin-Laurent et al., 2001; Brannock, Halanych, 2015; Deiner et al., 2015). In the present study, the sorting of the pools of organisms by their total number, rather than their biomass, may have led to certain distortions, given that Elbrecht et al. (2017) found that the recovery of taxa was 30% higher when the samples were grouped by size.
Although a general relationship often exists between the number of reads and the abundance of an organism in a metabarcoding approach, this relationship is subject to numerous biases and influencing factors. As a result, inferring actual abundance of organisms solely from the number of sequences read requires careful consideration of methodological limitations and the application of appropriate bioinformatic tools to normalize the data.
One other pattern that is apparent here is that the metabarcoding identification rate tends to decrease as the frequency of occurrence decreases. In addition, many organisms in the same pool may contribute to an increase in a type of bias known as “species masking”, in which the presence of larger organisms or exceptionally abundant species contributes to an accumulation of biomass, which disfavors the detection of the rarer or less abundant species (Evans et al., 2016; Hollatz et al., 2017; Deagle et al., 2018). Nevertheless, the number of species detected by DNA metabarcoding was higher than that recovered by DNA barcoding, which may be related to the considerable number of absent species that had a more restricted distribution (present at only one site). These findings underscore the importance of applying metabarcoding to all the organisms captured when conducting extensive studies (Evans et al., 2016; Elbrecht, Leese, 2018; Mariac et al., 2018).
The Geneious assembler, which is based on a greedy algorithm, outperformed the other assemblers in terms of the size and recovery of the contigs, indicating a smaller proportion of small reads and, therefore, a less fragmented assembly. This advantage may be related to the fact that, in assemblers based on de Bruijn graphs, such as MetaSpades and Megahit, the length of the scaffold is limited by the read size and not by the K-mer size. Although these tools are efficient, they have lower read mapping rates, which may be reflected in the recovery of a lower diversity in the resulting montage. This limitation resulted in a lack of any major differences in the number of taxa recovered by the different assemblers. A comparison of the results obtained by the three assemblers revealed no evidence of convergence in any taxonomic category. The overall predominance of taxa belonging to the orders Characiformes and Siluriformes is consistent with the pattern expected for a Neotropical river (Lowe-McConnell, 1987; Reynalte-Tataje et al., 2011; Silva et al., 2017), although each assembler did vary somewhat in the species it identified. Different assemblers are known to produce different results given their application of varying criteria, such as the N50 statistic, and any comparisons are limited by a lack of data on the true composition of the communities (Deng et al., 2015; Vollmers et al., 2017).
Sutton et al. (2019) found that the Geneious assembler recovered a larger fraction of low-abundance genomes using fewer contigs compared to other assemblers, although Megahit, MetaSpades, and other assemblers recovered the largest fraction of the genomes overall. One of the suggestions offered by these authors to reduce bias was to increase the overall sequencing depth or the length of reads, which would increase the probability of recovering less abundant genomes. They also recommended using multiple assemblers to mitigate the unique limitations of each approach. Similarly, our findings reveal significant differences in results when comparing individual assemblers to combinations of two or more, supporting the use of multiple assemblers. This approach allows for a more robust analysis by compensating for biases and errors inherent to individual assemblers, ultimately enhancing the accuracy of taxon detection and community profiling in complex datasets. In the present study, differences were also observed in the recovery of taxa from the same sample, and a detailed comparison of the data obtained by the three assemblers used here indicated that the choice of the best assembler may vary considerably, according to the objective of the analysis. As the present study focused on samples from a natural assemblage, comparisons are complex, although it was possible to confirm that, in the case of the species with frequency of occurrence data, Geneious was more efficient at the recovery of the more common taxa, whereas MetaSpades produced better results for the least common taxa.
Other considerations are more practical and may depend on the experience of the operator in the application of command lines. As it is available as a Graphical User Interface (GUI), Geneious may be easier to apply, depending on the computational power available for data analysis, which may make it unviable for analyses with considerable sequencing depth (Vollmers et al., 2017). Overall, then, technical (the reading size, quality, and inclusion of single or paired-end reads) and biological factors (genetic complexity, heterogeneity, and abundance) should be considered carefully to determine the most appropriate approach for any study of this type.
The results of the present study demonstrate the effectiveness of the NGS approach, based on the sequencing of the COI gene, for the analysis of large pools of organisms, given that it facilitates the detection of ichthyoplankton diversity, even to the species level in most cases, albeit with significant variation among the analytical approaches employed. A pivotal factor in the success of the present study was the availability of an extensive and well-established reference database, given that species can only be identified reliably with a comprehensive coverage of the taxa known to occur in the study area.
Given the various potential applications of the DNA metabarcoding technique, the approach adopted in the present study aimed to provide important new perspectives for several areas of research on the ichthyoplankton, such as the precise identification of the spawning grounds of migratory species, in particular threatened taxa, and the detection of invasive species. These parameters are fundamental to the development of effective management measures. The results of the present study also highlight the importance of selecting the most appropriate assemblers for a given scenario, given that they can be powerful tools for the recovery of species, if used correctly, and in an adequate amount. The strategies available for the collection, processing, and analysis of samples still have room for improvement, although they will evolve as new studies adopt this approach, and extend the method to novel scenarios, including marine and estuarine environments, and ecosystems with extreme fish diversity.
References
Albert JS, Destouni G, Duke-Sylvester SM, Magurran AE, Oberdorff T, Reis RE et al. Scientists’ warning to humanity on the freshwater biodiversity crisis. Ambio. 2021; 50:85–94. https://doi.org/10.1007/s13280-020-01318-8
Andrews S. FastQC: a quality control tool for high throughput sequence data. 2010.
de Araújo MI, Delariva RL, Bonato KO, Silva JC. Fishes in first order stream in Ivaí River drainage basin, upper Paraná River Basin, Paraná state, Brazil. Check List. 2011; 7(6):774–77. https://doi.org/10.15560/11023
Barnosky AD, Matzke N, Tomiya S, Wogan GOU, Swartz B, Quental TB et al. Has the Earth’s sixth mass extinction already arrived? Nature. 2011; 471:51–57. https://doi.org/10.1038/nature09678
Barzotto E, Mateus L. Reproductive biology of the migratory freshwater fish Salminus brasiliensis (Cuvier, 1816) in the Cuiabá River basin, Brazil. J Appl Ichthyol. 2017; 33:415–22. https://doi.org/10.1111/jai.13262
Baumgartner G, Nakatani K, Gomes LC, Bialetzki A, Sanches P. Identification of spawning sites and natural nurseries of fishes in the upper Paraná River, Brazil. Environ Biol Fish. 2004; 71:115–25. https://doi.org/10.1007/s10641-003-0098-z
Brambilla EM, Suiberto MR, Bialetzki A, Porto-Foresti F, Nogueira MG. Extreme climatic events affecting freshwater fish reproduction in the Neotropics. Braz J Biol. 2025; 85:e289459. https://doi.org/10.1590/1519-6984.289459
Brander KM. Global fish production and climate change. PNAS. 2007; 104(50):19709–14. https://doi.org/10.1073/pnas.0702059104
Brannock PM, Halanych KM. Meiofaunal community analysis by high-throughput sequencing: comparison of extraction, quality filtering, and clustering methods. Mar Genom. 2015; 23:67–75. https://doi.org/10.1016/j.margen.2015.05.007
Burrows M, Browning JS, Breitbart M, Murawski SA, Peebles EB. DNA barcoding reveals clear delineation between spawning sites for neritic versus oceanic fishes in the Gulf of Mexico. Fish Oceanogr. 2019; 28(2):228–39. https://doi.org/10.1111/fog.12404
De Carvalho DC, Oliveira DAA, Pompeu PS, Leal CG, Oliveira C, Hanner R. Deep barcode divergence in Brazilian freshwater fishes: the case of the São Francisco River basin. Mitochondrial DNA. 2011; 22(sup1):80–86. https://doi.org/10.3109/19401736.2011.588214
Chu C, Loh KH, Ng CC, Ooi AL, Konishi Y, Huang SP et al. Using DNA barcodes to aid the identification of larval fishes in tropical estuarine waters (Malacca Straits, Malaysia). Zool Stud. 2019; 58:e30. https://doi.org/10.6620/ZS.2019.58-30
Collins RA, Cruickshank RH. The seven deadly sins of DNA barcoding. Mol Ecol Resour. 2013;13(6):969–75. https://doi.org/10.1111/1755-0998.12046
Deagle BE, Jarman SN, Coissac E, Pompanon F, Taberlet P. DNA metabarcoding and the cytochrome c oxidase subunit I marker: not a perfect match. Biol Lett. 2014; 10(9):1020140562. http://doi.org/10.1098/rsbl.2014.0562
Deagle BE, Clarke LJ, Kitchener JA, Polanowski AM, Davidson AT. Genetic monitoring of open ocean biodiversity: an evaluation of DNA metabarcoding for processing continuous plankton recorder samples. Mol Ecol Resour. 2018; 18:391–406. https://doi.org/10.1111/1755-0998.12740
Deiner K, Walser JC, Mächler E, Altermatt F. Choice of capture and extraction methods affect detection of freshwater biodiversity from environmental DNA. Biol Cons. 2015; 183:53–63. https://doi.org/10.1016/j.biocon.2014.11.018
Dudgeon D. Prospects for sustaining freshwater biodiversity in the 21st century: linking ecosystem structure and function. COSUST. 2010; 2:422–30. https://doi.org/10.1016/j.cosust.2010.09.001
Dudgeon D. Multiple threats imperil freshwater biodiversity in the Anthropocene. Curr Biol. 2019; 29:960–67. https://doi.org/10.1016/j.cub.2019.08.002
Deng X, Naccache SN, Ng T, Federman S, Li L, Chiu CY et al. An ensemble strategy that significantly improves de novo assembly of microbial genomes from metagenomic next-generation sequencing data. Nucleic Acids Res. 2015; 43(7):e46. https://doi.org/10.1093/nar/gkv002
Edgar RC. Search and clustering orders of magnitude faster than BLAST. Bioinform. 2010; 26:2460–61. https://doi.org/10.1093/bioinformatics/btq461
Elbrecht V, Vamos EE, Meissner K, Aroviita J, Leese F. Assessing strengths and weaknesses of DNA metabarcoding-based macroinvertebrate identification for routine stream monitoring. Methods Ecol Evol. 2017; 8:1265–75. https://doi.org/10.1111/2041-210X.12789
Evans NT, Olds BP, Renshaw MA, Turner CR, Li Y, Jerde CL et al. Quantification of mesocosm fish and amphibian species diversity via environmental DNA metabarcoding. Mol Ecol Resour. 2016; 16:29–41. https://doi.org/10.1111/1755-0998.12433
Fernández-Osuna MA, Scarabotti PA. Phenotypic plasticity associated to environmental hypoxia in the Neotropical serrasalmid Piaractus mesopotamicus (Holmberg, 1887) (Characiformes: Serrasalmidae). Neotrop Ichthyol. 2016; 14(2):e150187. https://doi.org/10.1590/1982-0224-20150187
Fox J, Weisberg S. An R companion to applied regression (Third). Sage. 2019. Available from: https://socialsciences.mcmaster.ca/jfox/Books/Companion/
Fricke R, Eschmeyer WN, Van der Laan R, editors. Eschmeyer’s catalog of fishes: genera, species, references. [Internet]. San Francisco: California Academy of Science; 2025. Available from: http://researcharchive.calacademy.org/research/ichthyology/catalog/fishcatmain.asp
Fu L, Niu B, Zhu Z, Wu S, Li W. CD-HIT: accelerated for clustering the next-generation sequencing data. Bioinformatics. 2012; 28(23):3150–52. https://doi.org/10.1093/bioinformatics/bts565
Ghanbari M, Kneifel W, Domig KJ. A new view of the fish gut microbiome: advances from next-generation sequencing. Aquac Int. 2015; 448:464–75. https://doi.org/10.1016/j.aquaculture.2015.06.033
Gordon TAC, Harding HR, Clever FK, Davidson IK, Davison W, Montgomery DW et al. Fishes in a changing world: learning from the past to promote sustainability of fish populations: fishes in a changing world. J Fish Biol. 2018; 92:804–27. https://doi.org/10.1111/jfb.13546
Govender A, Fennessy ST, Porter SN, Groeneveld JC. Metabarcoding of ichthyoplankton communities associated with a highly dynamic shelf region of the southwest Indian Ocean. PLoS ONE. 2023; 18(4):e0284961. https://doi.org/10.1371/journal.pone.0284961
Green MR, Sambrook J. Molecular cloning, 4th ed. New York: Cold Spring Harbor Laboratory Press; 2012.
Grill G, Lehner B, Thieme M, Geenen B, Tickner D, Antonelli F et al. Mapping the world’s free-flowing rivers. Nature. 2019; 569:215–21. https://doi.org/10.1038/s41586-019-1111-9
Hebert PDN, Cywinska A, Ball SL, deWaard JR. Biological identifications through DNA barcodes. Proc R Soc Lond Ser B Biol Sci. 2003; 270(1512):313–21. https://doi.org/10.1098/rspb.2002.2218
Hakimzadeh S, Hakimzadeh A, Asbun AA, Albanese D, Bernard M, Buchner D et al. A pile of pipelines: an overview of the bioinformatics software for metabarcoding data analyses. Mol Ecol Resour. 2024; 24(5):e13847. https://doi.org/10.1111/1755-0998.13847
Hollatz C, Leite BR, Lobo J, Froufe H, Egas C, Costa FO. Priming of a DNA metabarcoding approach for species identification and inventory in marine macrobenthic communities. Genome. 2017; 60(3):260–71. https://doi.org/10.1139/gen-2015-0220
Imtiaz A, Nor SAM, Naim DMD. Review: Progress and potential of DNA barcoding for species identification of fish species. Biodiversitas. 2017; 18:1394–405. https://doi.org/10.13057/biodiv/d180415
Ivanova NV, Zemlak TS, Hanner RH, Hebert PD. Universal primer cocktails for fish DNA barcoding. Mol Ecol Notes. 2007; 7:544–48. https://doi.org/10.1111/j.1471-8286.2007.01748.x
Jennings WB, Ruschi PA, Ferraro G, Quijada CC, Silva-Malanski ACG, Prosdocimi F et al. Barcoding the Neotropical freshwater fish fauna using a new pair of universal COI primers with a discussion of primer dimers and M13 primer tails. Genome. 2019; 62:77–83. https://doi.org/10.1139/gen-2018-0145
Jiang R, Lusana JL, Chen Y. High-throughput DNA metabarcoding as an approach for ichthyoplankton survey in Oujiang River estuary, China. Diversity. 2022; 14(12):1111. https://doi.org/10.3390/d14121111
Jusino MA, Banik MT, Palmer JM, Wray AK, Xiao L, Pelton E et al. An improved method for utilizing high-throughput amplicon sequencing to determine the diets of insectivorous animals. Mol Ecol Resour. 2019; 19(1):176–90. https://doi.org/10.1111/1755-0998.12951
Kearse M, Moir R, Wilson A, Stones-Havas S, Cheung M, Sturrock S et al. Geneious basic: an integrated and extendable desktop software platform for the organization and analysis of sequence data. Bioinform. 2012; 28:1647–49. https://doi.org/10.1093/bioinformatics/bts199
Koboldt DC, Steinberg KM, Larson DE, Wilson RK, Mardis ER. The next-generation sequencing revolution and its impact on genomics. Cell. 2013; 155:27–38. https://doi.org/10.1016/j.cell.2013.09.006
Labouriau R. Posthoc: tools for post-hoc analysis. R-package version 0.1.1; 2020.
Latrubesse EM, Arima E, Ferreira ME, Nogueira SH, Wittmann F, Dias MS et al. Fostering water resource governance and conservation in the Brazilian Cerrado biome. Conserv Sci Pract. 2019; 1(9):e77. https://doi.org/10.1111/csp2.77
Leese F, Bouchez A, Abarenkov K, Altermatt F, Borja Á, Bruce K et al. Why we need sustainable networks bridging countries, disciplines, cultures and generations for aquatic biomonitoring 2.0: a perspective derived from the DNAqua-Net COST Action. Adv Ecol Res. 2018; 58:63–99. https://doi.org/10.1016/bs.aecr.2018.01.001
Leray M, Knowlton N. Random sampling causes the low reproducibility of rare eukaryotic OTUs in Illumina COI metabarcoding. PeerJ. 2017; 5:e3006. https://doi.org/10.7717/peerj.3006
Li D, Liu C-M, Luo R, Sadakane K, Lam T-W. MEGAHIT: an ultra-fast single-node solution for large and complex metagenomics assembly via succinct de Bruijn graph. Bioinformatics. 2015; 31(10):1674–76. https://doi.org/10.1093/bioinformatics/btv033
Lima MCC, Lima SC, Savada CS, Suzuki KM, Orsi ML, Almeida FS. Use of DNA barcode in the identification of fish eggs in tributaries of the Paranapanema River basin. Genet Mol Biol. 2020; 43(3):e20190352. https://doi.org/10.1590/1678-4685-GMB-2019-0352
Lowe-McConnell RH. Ecological studies in tropical fish communities. Cambridge: Cambridge University Press; 1987.
Maggia ME, Vigouroux Y, Renno JF, Duponchelle F, Desmarais E, Nunez J et al. DNA metabarcoding of Amazonian ichthyoplankton swarms. PLoS ONE. 2017; 12:e0170009. https://doi.org/10.1371/journal.pone.0170009
Maier A, Zawadzki CH, Graa WJ, Bifi AG. Fish, Barra Bonita River, upper Paraná River basin, state of Paraná, Brazil. Check List. 2008; 4(3):336–40. https://doi.org/10.15560/4.3.336
Mariac C, Vigouroux Y, Duponchelle F, García-Dávila C, Nunez J, Desmarais E et al. Metabarcoding by capture using a single COI probe (MCSP) to identify and quantify fish species in ichthyoplankton swarms. PLoS ONE. 2018; 13:e0202976. https://doi.org/10.1371/journal.pone.0202976
Martin M. Cutadapt removes adapter sequences from high-throughput sequencing reads. EMBnet J. 2011; 17(1):10–12. https://doi.org/10.14806/ej.17.1.200
Martin TG, Kehoe L, Mantyka-Pringle C, Chades I, Wilson S, Bloom RG et al. Prioritizing recovery funding to maximize conservation of endangered species. Conserv Lett. 2018; 11:e12604. https://doi.org/10.1111/conl.12604
Martin-Laurent F, Philippot L, Hallet S, Chaussod R, Germon JC, Soulas G et al. DNA extraction from soils: old bias for new microbial diversity analysis methods. Appl Environ Microbiol. 2001; 67(5):2354–59. https://doi.org/10.1128/AEM.67.5.2354-2359.2001
Meschiatti AJ, Arcifa MS. A review on the fishfauna of Mogi-Guaçu River basin: a century of studies. Acta Limnol Bras. 2009; 21:135–59.
Metzker, M. Sequencing technologies – the next generation. Nat Rev Genet. 2010; 11:31–46. https://doi.org/10.1038/nrg2626
Miller BS, Kendall AW. Early life history of marine fishes, 1st ed. Berkeley: University of California Press; 2009.
Nakatani K, Agostinho AA, Baumgartner G, Bialetzki A, Sanches PV, Makrakis MC et al. Ovos e larvas de peixes de água doce: desenvolvimento e manual de identificação. Maringá: EDUEM; 2001.
Nobile AB, Freitas-Souza D, Ruiz-Ruano FJ, Nobile MLMO, Costa GO, Lima FP et al. DNA metabarcoding of Neotropical ichthyoplankton: enabling high accuracy with lower cost. Metab Metag. 2019; 3:e35060. https://doi.org/10.3897/mbmg.3.35060
Novák P, Neumann P, Macas J. Graph-based clustering and characterization of repetitive sequences in next-generation sequencing data. BMC Bioinform. 2010a; 11:1–12. https://doi.org/10.1186/1471-2105-11-378
Nurk S, Meleshko D, Korobeynikov A, Pevzner PA. metaSPAdes: a new versatile metagenomic assembler. Genome Res. 2017; 27:824–34. https://doi/10.1101/gr.213959.116
Oliveira EF, Goulart E, Breda L, Minte-Vera CV, Paiva LRDS, Vismara MR. Ecomorphological patterns of the fish assemblage in a tropical floodplain: effects of trophic, spatial and phylogenetic structures. Neotrop Ichthyol. 2010; 8(3):569–86. https://doi.org/10.1590/S1679-62252010000300002
Oksanen J, Blanchet FG, Friendly M, Kindt R, Legendre P, Mcglinn D et al. Vegan: community ecology package. Ordination methods, diversity analysis and other functions for community and vegetation ecologists. Version 2.4-0. 2016.
Pandey PK, Singh YS, Tripathy PS, Kumar R, Abujam SK, Parhi J. DNA barcoding and phylogenetics of freshwater fish fauna of Ranganadi River, Arunachal Pradesh. Gene. 2020; 754:144860. https://doi.org/10.1016/j.gene.2020.144860
Pavan-Kumar A, Gireesh-Babu P, Lakra WS. DNA metabarcoding: a new approach for rapid biodiversity assessment. J Cell Sci Mol Biol. 2015; 2(1):111.
Pedersen HÆ, Petersen G, Gravendeel B, Barkman TJ, Boer H, Sulistyo BP et al. Phylogenetics of Dendrochilum (Orchidaceae): evidence of pronounced morphological homoplasy and predominantly centric endemism. Taxon. 2019; 68(6):1173–88. https://doi.org/10.1002/tax.12184
Pelicice FM, Azevedo-Santos VM, Vitule JRS, Orsi ML, Lima Junior DP, Magalhães ALB et al. Neotropical freshwater fishes imperilled by unsustainable policies. Fish Fish. 2017; 18(6):1119–33. https://doi.org/10.1111/faf.12228
Pelicice FM, Bialetzki A, Camelier P, Carvalho FR, García-Berthou E, Pompeu PS et al. Human impacts and the loss of Neotropical freshwater fish diversity. Neotrop Ichthyol. 2021; 19(3):e210134. https://doi.org/10.1590/1982-0224-2021-0134
Porter TM, Hajibabaei M. Automated high throughput animal CO1 metabarcode classification. Sci Rep. 2018a; 8:4226. https://doi.org/10.1038/s41598-018-22505-4
Porter TM, Hajibabaei M. Scaling up: a guide to high-throughput genomic approaches for biodiversity analysis. Mol Ecol. 2018b; 27:313–38. https://doi.org/10.1111/mec.14478
Reynalte-Tataje DA, Nakatani K, Fernandes R, Agostinho AA, Bialetzki A. Temporal distribution of ichthyoplankton in the Ivinhema River (Mato Grosso do Sul State/ Brazil): influence of environmental variables. Neotrop Ichthyol. 2011; 9(2):427–36. https://doi.org/10.1590/S1679-62252011005000017
Reynalte-Tataje DA, Agostinho AA, Bialetzki A, Hermes-Silva S, Fernandes R, Zaniboni-Filho E. Spatial and temporal variation of the ichthyoplankton in a subtropical river in Brazil. Environ Biol Fish. 2012; 94:403–19. https://doi.org/10.1007/s10641-011-9955-3
RStudio team: integrated development for R. RStudio, Inc., Boston, MA; 2022.
Salvi D, Berrilli E, D’Alessandro P, Biondi M. Sharpening the DNA barcoding tool through a posteriori taxonomic validation: The case of Longitarsus flea beetles (Coleoptera: Chrysomelidae). PLoS ONE. 2020; 15:e0233573. https://doi.org/10.1371/journal.pone.0233573
Serrano EA, Melo BF, Freitas–Souza D, Oliveira MLM, Utsunomia R, Oliveira C et al. Species delimitation in Neotropical fishes of the genus Characidium (Teleostei, Characiformes). Zool Scr. 2019; 48(1):69–80. https://doi.org/10.1111/zsc.12318
Sickel W, Zizka V, Scherges A, Bourlat SJ, Dieker P. Abundance estimation with DNA metabarcoding-recent advancements for terrestrial arthropods. MBMG. 2023; 7:e112290. https://doi.org/10.3897/mbmg.7.112290
Silva JC, Rosa RR, Galdioli EM, Soares CM, Domingues WM, Veríssimo S et al. Importance of dam-free stretches for fish reproduction: the last remnant in the upper Paraná River. Acta Limnol Bras. 2017; 29:e106. https://doi.org/10.1590/s2179-975×10216
Silva LE, Domingues RR, Sales NG, Villela PM, Silva CB, Hilsdorf AW. Amazonian ichthyoplankton assessment via DNA metabarcoding: a baseline for detecting spawning sites of migratory fishes. Biol Conserv. 2023; 284:110180. https://doi.org/10.1016/j.biocon.2023.110180
Simberloff D, Martin J-L, Genovesi P, Maris V, Wardle DA, Aronson J et al. Impacts of biological invasions: what’s what and the way forward. Trends Ecol Evol. 2013; 28(1):58–66. http://dx.doi.org/10.1016/j.tree.2012.07.013
Skelton J, Cauvin A, Hunter ME. Environmental DNA metabarcoding read numbers and their variability predict species abundance, but weakly in non dominant species. Environ DNA. 2022; 5(5):1092–104. https://doi.org/10.1002/edn3.355
Sutton TDS, Clooney AG, Ryan FJ, Ross RP, Hill C. Choice of assembly software has a critical impact on virome characterisation. Microbiome. 2019; 7:12. https://doi.org/10.1186/s40168-019-0626-5
Taberlet P, Coissac E, Pompanon F, Brochmann C, Willerslev E. Towards next-generation biodiversity assessment using DNA metabarcoding: next-generation DNA metabarcoding. Mol Ecol. 2012; 21(8):2045–50. https://doi.org/10.1111/j.1365-294X.2012.05470.x
Teixeira DFH, Santos HO, Carvalho GB, Cardoso D. DNA metabarcoding assessment of Neotropical ichthyoplankton communities is marker-dependent. Nat Ecol Evol. 2023; 13:e10649. https://doi.org/10.1002/ece3.10649
Tørresen OK, Star B, Mier P, Andrade-Navarro MA, Bateman A, Jarnot P et al. Tandem repeats lead to sequence assembly errors and impose multi-level challenges for genome and protein databases. Nucleic Acids Res. 2019; 47(21):10994–1006. https://doi.org/10.1093/nar/gkz841
Venables WN, Ripley BD. Modern applied statistics with S. Fourth edition. New York: Springer; 2002.
Viana D, Zawadzki CH, Oliveira EF, Vogel HF, Graca WJ. Estrutura da ictiofauna do rio Bonito, bacia hidrográfica do rio Ivaí, sistema alto rio Paraná, Brasil. Biota Neotrop. 2013; 13(2):218–26. https://doi.org/10.1590/S1676-06032013000200021
Vollmers J, Wiegand S, Kaster AK. Comparing and evaluating metagenome assembly tools from a microbiologist’s perspective – not only size matters! PLoS ONE. 2017a; 12:e0169662. https://doi.org/10.1371/journal.pone.0169662
Wajid B, Serpedin E. Review of general algorithmic features for genome assemblers for next generation sequencers. GBP. 2012; 10(2):58–73. https://doi.org/10.1016/j.gpb.2012.05.006
Ward RD, Zemlak TS, Innes BH, Last PR, Hebert PDN. DNA barcoding Australia’s fish species. Philos Trans R Soc B. 2005; 360:1847–57. https://doi.org/10.1098/rstb.2005.1716
Wicker T, Sabot F, Hua-Van A, Bennetzen JL, Capy P, Chalhoub B et al. A unified classification system for eukaryotic transposable elements. Nat Rev Genet. 2007; 8:973–82. https://doi.org/10.1038/nrg2165
Wickham H, François R, Henry L, Müller K. dplyr: a grammar of data manipulation. 2022. Available from: https://dplyr.tidyverse.org
Wickham H, Girlich M. tidyr: tidy messy data. 2022. Available from: https://tidyr.tidyverse.org
Zacardi DM, Sobrinho AF, Silva LMA. Composition and distribution of larval fishes of an urban tributary the mouth of Amazon River, Brazil. Acta Fish. 2014; 2(2):1–16. https://doi.org/10.2312/ActaFish.2014.2.2.1-16
Zacardi DM, Chaves CS. Variação espacial e temporal de larvas de Anostomidae (Pisces, Characiformes) na região do Baixo Amazonas, Pará, Brasil. Acta Fish. 2017; 5(1):91–100. https://doi.org/10.2312/Actafish.2017.5.1.91-100
Zhang J, Kobert K, Flouri T, Stamatakis A. PEAR: a fast and accurate Illumina Paired-End reAd mergeR. Bioinformatics. 2014; 30:614–20. https://doi.org/10.1093/bioinformatics/btt593
Zoccal Garcia DA, Costa ADA, Almeida FS, Bialetzki A, Orsi ML. Spatial distribution and habitat use by early fish stages in a dammed river basin, Southern Brazil. Rev Biol Trop. 2018; 66(2):605–21. http://dx.doi.org/10.15517/rbt.v66i2.33384
Authors

![]() Gabriela O. Costa1
Gabriela O. Costa1 ![]() ,
, ![]() André B. Nobile1,
André B. Nobile1, ![]() Bruno F. Morales2,
Bruno F. Morales2, ![]() Bruno C. Rossini3,
Bruno C. Rossini3, ![]() Diogo Freitas Souza1,
Diogo Freitas Souza1, ![]() Érica A. Serrano Freitas1 and
Érica A. Serrano Freitas1 and ![]() Claudio Oliveira1
Claudio Oliveira1
[1] Departamento de Biologia Estrutural e Funcional, Instituto de Biociências, Universidade Estadual Paulista Júlio de Mesquita Filho (UNESP), Rua Professor Doutor Antônio Celso Wagner Zanin, 250, 18618-689 Botucatu, SP, Brazil. (GOC) gabriela.omura@unesp.br (corresponding author), (ABN) andre.nobile@unesp.br, (DFS) souza.d.freitas@gmail.com, (EASF) ericaalsefre@gmail.com, (CO) claudio.oliveira@unesp.br.
[2] Faculdade de Ciências Biológicas e Ambientais, Universidade Federal da Grande Dourados (UFGD), Rodovia Dourados-Itahum, km 12, 79804-970 Dourados, MS, Brazil. (BFM) brunomorales@ufgd.edu.br.
[3] Departamento de Bioprocessos e Biotecnologia, Faculdade de Ciências Agronômicas, Universidade Estadual Paulista, Av. Universitária, 3780, 18610-034 Botucatu, SP, Brazil. (BCR) bruno.rossini@unesp.br.
Authors’ Contribution 

Gabriela O. Costa: Conceptualization, Data curation, Formal analysis, Investigation, Methodology, Writing-original draft.
André B. Nobile: Conceptualization, Investigation, Methodology, Supervision, Writing-review and editing.
Bruno F. Morales: Conceptualization, Formal analysis, Software, Visualization, Writing-review and editing.
Bruno C. Rossini: Conceptualization, Data curation, Formal analysis, Methodology, Validation, Writing-review and editing.
Diogo Freitas Souza: Data curation, Writing-review and editing.
Érica A. Serrano Freitas: Data curation, Writing-review and editing.
Claudio Oliveira: Conceptualization, Funding acquisition, Investigation, Methodology, Project administration, Resources, Supervision, Writing-review and editing.
Ethical Statement
All organisms were handled in accordance with animal care protocols approved by the Committee on the Ethics of Animal Experiments of the Institute of Biosciences/Botucatu (protocol Nº 1058-CEUA).
Competing Interests
The author declares no competing interests.
Data availability statement
All collection information and sequence data will be submitted to GenBank (Accession numbers “pending”).
Funding
Conselho Nacional de Desenvolvimento Científico e Tecnológico (CNPq) for scholarships to GOC (306054/2006–0), ABN (165830/2015–8) and DFS (141526/2015–7); Fundação de Amparo à Pesquisa do Estado do Amazonas (FAPEAM) for scholarships to BFM, through POSGFE scholarship number 012/2021; Fundação de Amparo à Pesquisa do Estado de São Paulo (FAPESP) for scholarships to GOC (2019/03597–4) and ABN (2015/19025–9 and 2017/12758–6). CO received financial support from FAPESP (grant 2020/13433–6) and CNPq (proc. 306054/2006–0).
How to cite this article
Costa GO, Nobile AB, Morales BF, Rossini BC, Souza DF, Freitas EAS, Oliveira C. Identification of fish eggs and larvae using a novel DNA metabarcoding approach. Neotrop Ichthyol. 2025; 23(3):e250005. https://doi.org/10.1590/1982-0224-2025-0005
Copyright
This is an open access article under the terms of the Creative Commons Attribution License, which permits use, distribution and reproduction in any medium, provided the original work is properly cited.
Distributed under
Creative Commons CC-BY 4.0

© 2025 The Authors.
Diversity and Distributions Published by SBI
![]() Accepted August 21, 2025
Accepted August 21, 2025
![]() Submitted January 15, 2025
Submitted January 15, 2025
![]() Epub November 11, 2025
Epub November 11, 2025