![]() Gabriel Nakamura1,2
Gabriel Nakamura1,2 ![]() ,
, ![]() Leonardo Carlos Jeronimo Corvalán3,4,
Leonardo Carlos Jeronimo Corvalán3,4, ![]() Laura Barreto de Paula-Souza2,5,
Laura Barreto de Paula-Souza2,5, ![]() Lívia Estéfane F. Frateles6,
Lívia Estéfane F. Frateles6, ![]() Guilherme Rogie Gonçalves Tavares6,
Guilherme Rogie Gonçalves Tavares6, ![]() Jullia Costa Pereira3,6,
Jullia Costa Pereira3,6, ![]() Diego Ortiz da Silva3,6,
Diego Ortiz da Silva3,6, ![]() Carmen Barragán-Ruiz2,3,
Carmen Barragán-Ruiz2,3, ![]() Flavia de Paiva Breseghello7,
Flavia de Paiva Breseghello7, ![]() Nina Machado Suzigan6,
Nina Machado Suzigan6, ![]() Cintia Pelegrineti Targueta3,8,
Cintia Pelegrineti Targueta3,8, ![]() Geiziane Tessarolo2,
Geiziane Tessarolo2, ![]() Fabrício Barreto Teresa9,
Fabrício Barreto Teresa9, ![]() Murilo Sversut Dias5,
Murilo Sversut Dias5, ![]() Lucas Jardim10,
Lucas Jardim10, ![]() Rafael Barbosa Pinto2,11,
Rafael Barbosa Pinto2,11, ![]() Rhewter Nunes3,4,
Rhewter Nunes3,4, ![]() Mariana Pires de Campos Telles3,12 and
Mariana Pires de Campos Telles3,12 and ![]() José A. Felizola Diniz-Filho13
José A. Felizola Diniz-Filho13
PDF: EN XML: EN | Cite this article
Abstract
Genetic information is crucial for species identification, population genetics structure, evolutionary relationships, and biodiversity monitoring. It helps address biodiversity gaps related to Linnean (taxonomic uncertainty) and Darwinian (phylogenetic knowledge) shortfalls. Understanding these gaps can guide data collection to reduce these shortfalls. This study focuses on compiling genetic data for 748 fish species in the Tocantins-Araguaia basin, examining the number of unique genomic regions and the individual regions sampled per species. We also investigated the factors that determine genetic data availability by linking it with macroecological predictors. Our findings reveal that fewer than one-third of endemic species have genetic resources available. The Darwinian shortfall – the lack of phylogenetic knowledge – is a key factor limiting genetic data, with species experiencing more of this shortfall having less genetic information. The study underscores the need for increased genetic sampling of endemic species and more sampling of individual regions to better assess biological information like population structure.
Keywords: Biodiversity gaps, Central Brazil, Freshwater fishes, Genomic Regions, Linnean shortfall.
Dados genéticos são cruciais para identificação de espécies, estrutura genética de populações, relações evolutivas e monitoramento da biodiversidade. Tais dados auxiliam avaliar lacunas de conhecimento relacionados a lacunas Lineana (incerteza taxonômica) e Darwiniana (conhecimento sobre relações evolutivas). Compreender estas lacunas podem guiar a coleta de dados biológicos com a finalidade de reduzi-las. Este estudo visou compilar dados genéticos para 748 espécies de peixes na bacia do rio Tocantins-Araguaia, examinando o número de regiões genômicas únicas, e o número total de regiões genômicas amostradas por espécie. Investigamos também os fatores que determinam a disponibilidade de dados genéticos relacionados com preditores macroecológicos. A lacuna Darwiniana – ausência de informação sobre as relações das espécies – é um fator chave que limita a disponibilidade de dados genéticos, sendo as espécies que apresentam maior lacuna darwiniana aquelas que também apresentam menos dados genéticos. Nosso estudo ressalta a necessidade de aumento de dados genéticos para espécies endêmicas e maior amostragem de regiões genômicas individuais para proporcionar maior acesso em informações biológicas como estrutura de populações.
Palavras-chave: Brasil central, Lacunas de biodiversidade, Lacuna Lineana, Peixes de água doce, Regiões Genômicas.
Introduction
Biodiversity data is often limited by sampling biases, gaps, and other problems that affect our ability to understand underlying ecological and evolutionary patterns (Hortal et al., 2015). These kinds of limitations can hinder effective data-driven conservation strategies (Whittaker et al., 2005; Bini et al., 2006; Moura, Jetz, 2021; Urbina-Cardona et al., 2023). Hortal et al. (2015) presented seven key biodiversity shortfalls – Darwinian, Eltonian, Hutchinsonian, Linnean, Prestonian, Raunkiæran, and Wallacean, pinpointing knowledge gaps for different aspects of biodiversity and stressing the consequences of these shortfalls for ecological and evolutionary research. Of these shortfalls, three are more associated with a systematic (taxonomy and evolutionary relationships) and biogeographic perspective: a lack of knowledge regarding how many species exist for a given group (Linnean), their geographic distribution (Wallacean), and their evolutionary and phylogenetic relationships (Darwinian). The other shortfalls involve gaps in knowledge about population and demographic processes (Prestonian), functional traits among species (Raunkiæran), and the different components of species’ ecological niches (Hutchinsonian and Eltonian). Yet other shortfalls have been proposed subsequently (e.g., Roque et al., 2019; Faria et al., 2021; García-Girón et al., 2023), and the overall framework is being continuously developed.
The Linnean shortfall has at least two components that would explain the increasing number of species in the future (Hortal et al., 2015). The first relates to the unknown species, referring to taxa that have not yet been collected in poorly known regions or unsuspected material available in museums and collections (alpha taxonomy). The second component refers to refining taxonomic criteria to delimit already known species and better organize the hierarchical structure among taxa (beta taxonomy). For instance, Freeman, Pennell (2021) revealed a geographical structure in the “quality” of species’ delimitation, leading to variation in biological patterns and, consequently, in the interpretations of macroecological and macroevolutionary patterns.
The second component of the Linnean shortfall (i.e., beta taxonomy) may lead to changes in subdivisions of previously known species, thus with minor impacts on the overall estimates of phylogenetic diversity (e.g., Mace et al., 2003; Diniz-Filho et al., 2013, 2023; Lum et al., 2022), but with pronounced impacts in other biodiversity estimates. For example, splitting of known species in two or more can lead to changes in short branch lengths, which in turn can bias the estimates of diversification rates, reduce the Darwinian shortfall, and change the interpretations, for instance, of the evolutionary dynamics underlying the latitudinal gradients of species richness or patterns of phylogenetic endemism (Diniz-Filho et al., 2023; Tavares et al., 2024). These issues reveal that biodiversity shortfalls cannot be considered independent and may act independently, depending on the geographical and phylogenetic scales of the patterns under investigation.
Thus, when challenging both Linnean and Darwinian (as well as Wallacean) shortfalls in a systematic context, it is essential to explain biodiversity patterns and define more efficient strategies for conservation. The strategies could involve, for example, the development of techniques or sampling methods that allow a better delimitation of species (see Urbina-Cardona et al., 2023, for a recent review and compilation). Species delimitation, i.e., correctly identifying an individual to the lowest taxonomic level (species), is of pivotal importance in biodiversity studies. Given the importance, there is an increasing interest in finding variables that could be proxies or indicate situations in which the species delimitation is dubious or uncertain. The poor delimitation of species, especially in tropical regions, can be associated with macroecological variables (e.g., more speciation in the tropics) and sociological variables (e.g., less infrastructure, historical exploration, to cite a few) that could be used as surrogates of the quality of species delimitation and could be used to evaluate the magnitude of the second component of the Linnean shortfall — beta taxonomy. For instance, Cerezer et al. (2023) postulated that small-bodied Neotropical freshwater fishes inhabiting high-elevation small rivers are more likely to experience rapid allopatric speciation, increasing overall species richness for the group.
Considering the above issues, increasing the number of population genetic structure and phylogeography studies across a wider range of species is essential to mitigate Linnean and Darwinian shortfalls. This would ensure better criteria for species delimitation and more accurate knowledge of phylogenetic structure, allowing better estimates of phylogenetic and biogeographical patterns. Furthermore, the use of DNA barcodes and similar molecular markers, assuming they are properly geo-referenced and available, are important sources of data that can increase the accuracy of phylogeny estimates. Therefore, a first step towards better understanding species delimitation is identifying species with poor coverage in genetic information to obtain more refined genetic and genomic data for multiple taxa, allowing the development of more refined molecular markers that could be used for further investigation.
Here, we aim to describe the current understanding of genetic and genomic data for fish species in the Tocantins-Araguaia River basin and discuss how Linnean and Darwinian shortfalls limit our ability to understand underlying ecological and evolutionary patterns. In doing so, we also suggest guidelines for filling conspicuous gaps in genetic information that challenge ongoing conservation efforts in the basin. We compiled species-level descriptors that considered the genetic information available for species from public databases we sampled. We also evaluated the relationship between the availability of the most commonly used genomic regions and potential molecular markers in phylogenetic studies with macroecological variables (e.g., number of occurrences for each fish species in occurrences database) and taxonomic patterns (e.g., description dates, number of synonyms for each valid species the Darwinian shortfall – the amount of phylogenetic information accounted by missing species in the most comprehensive phylogeny available).
The Tocantins-Araguaia River basin is a good model for exploring Darwinian and Linnean shortfalls. The basin has a highly diverse and endemic fish fauna, with about 700–750 species (e.g., Dagosta, de Pinna, 2019; Chamon et al., 2022; Reis et al., 2024), which challenges taxonomic inventories and stresses the importance of high-quality schemes of species delimitations and investments. Most of the basin is also located within the Cerrado domain, a global biodiversity hotspot with high plant endemism (Myers et al., 2000; Klink, Machado, 2005; Latrubesse et al., 2019; Colli et al., 2020). In the socioeconomic context, the Tocantins-Araguaia basin is important for supplying water to Brazil’s northern and central-west regions (Latrubesse et al., 2019). However, the basin is also threatened by several factors, including establishing dams, pollution, illegal hunting, and excessive water exploitation for intense agricultural expansion (Pelicice et al., 2021; Santana et al., 2021). Given these threats, the fish fauna of the Tocantins-Araguia basin is under threat of extinction and localized extirpations.
Material and methods
Species list. We used a list of species in the Tocantins-Araguaia basin based on Dagosta, de Pinna (2019), which we updated by including missing species, synonyms, and new occurrence records provided by Chamon et al. (2022) and references therein. From this list, we recognized only species considered valid by Fricke et al. (2024). This resulted in a final list with 748 species, out of 751 species listed by Chamon et al. (2022). In the context of Linnean shortfalls, taxonomic uncertainty metrics for each species were represented by counting the total number of synonyms, past valid names, and the date of first description of the species, once again based on Fricke et al. (2024).
Phylogenetic relationships and Darwinian shortfall. We used Cassemiro et al. (2023), a phylogenetic tree for South American freshwater fishes, as our framework for assessing Darwinian shortfalls. For the fish fauna of the Tocantins-Araguaia River basin, only 446 species out of the 748 in our initial list were contained in this phylogeny, so we performed a phylogenetic imputation procedure for missing species at genus (n = 213) or family (n = 88) levels, using the rtrees package (Li, 2023) implemented in R (R Development Core Team, 2023). To do so, we grafted missing species to Cassemiro et al. (2023) tree, via a sequential process. First, congeneric species were grafted into the tree. Then, if there were still missing species in the tree, those were grafted to the node corresponding to the most recent common ancestor (MRCA) of the species’ family (Li, 2023). In both cases, the missing species was grafted as a polytomy at the MRCA of the genus or the family. In the case of a genus or family consisting of only one species, the target species was grafted at half of the size of the branch length of the single genus/family representative of the species in the backbone tree (Nakamura et al., 2021; Li, 2023).
The imputed phylogeny was used to evaluate the availability and distribution of genetic data on the phylogenetic tree, estimate the phylogenetic signal in genomic information (i.e., how the genetic data is distributed among species in the tree), and account for inflated Type I errors when modeling the unique and individual genes as a function of macroecological variables and taxonomic uncertainty metrics for each species. Controlling the type I error in this analysis is relevant since the species are not phylogenetically independent entities (species are related to each other), which can influence statistical models by indicating an effect of macroecological variables even if it is not the underlying cause.
The magnitude of the overall Darwinian shortfall was evaluated following the proposition by Nakamura et al. (2022), which comprises a ratio between the length of the branches inserted into the phylogeny (PD inserted) and the total amount of phylogenetic diversity (PD total). Each species has a Darwinian shortfall value, with those species already present in the backbone tree having a value of zero (i.e., no branch length was added into the tree – no Darwinian deficit) and values close to one, indicating a high value of Darwinian shortfall (i.e., the species inserts a long branch accounting for a high amount of phylogenetic history missing in the tree – high phylogenetic deficit).
Molecular data. We obtained the available genomic data for each species from BOLD (Barcode of Life Data System) and the DNA sequence databases of NCBI (National Center for Biotechnology Information). The BOLD database is a workbench for acquiring, storing, and processing DNA barcode records (Ratnasingham, Hebert, 2007). The NCBI is a section of the National Institutes of Health that houses a series of genetic databases and the most significant genetic information, including data about genomes, transcriptomes, raw sequence reads, and short DNA sequences like DNA barcode records. We used BOLD and NCBI since they are complementary and the most commonly used databases for retrieving genetic information about species. We used the refdb R package (Keck, Alternmatt, 2023 – CRAN v. 0.1.1) to query genetic information for all 748 fish species in the Tocantins-Araguaia River basin, using their genus and epithet format for all valid, synonyms and past valid species names. We made two different searches, one in BOLD (using the function refdb_import_BOLD) and another in NCBI (using the function getNCBI). The searches were done to encompass genes and genomes, including both deposited genomic regions and complete genomes. The results were combined in one table (through the function refdb_merge) containing the unique register for all individuals/genome regions of all species and their synonyms. Finally, we merged the synonym names to their current accepted taxonomic name in the table with genetic information.
With this merged table, we calculated species-level descriptors, including the total number of genomic regions (the total number of individual regions in which that region was sequenced in each species), the number of different genomic regions (the total number of unique genomic regions sequenced by each species), and the number of individual regions sequenced for the six most common DNA regions in our database (Cytochrome c oxidase subunit I – COI, cytochrome B – cytB, recombination activating genes-1 – RAG1, recombination activating genes-2 RAG2, myosin heavy chain 6 – MYH6 and ATP synthase subunit 8 – atp8). Despite not ranking among the six most used genomic regions, we also included in the analysis information about 12S since it is widely known as one of the most important regions used in environmental DNA analysis in fishes (Polanco et al., 2021). The number of individual regions sequenced for the six most common DNA regions plus 12S for every species, and the number of unique genomic regions for each species are the response variables for statistical analyses and modeling.
Body size. Body size data for 698 species, expressed as maximum body length, were available from FISHMORPH (Brosse et al., 2021) and FISHBASE (Froese, Pauly, 2021; Humphries et al., 2023). We used a phylogenetic imputation approach for 50 species with missing body size information (Swenson, 2014). We fitted a multi-regime Ornstein-Uhlenbeck model using the l1ou package (Khabbazian et al., 2016) to identify evolutionary shifts in body size optima. Modeling trait distribution on large phylogenetic clades requires a realistic representation of the underlying evolutionary model (Beaulieu et al., 2013). Large clades are probably under different environmental pressures that could result in multiple adaptive landscapes for traits like body size. Two main models have been proposed to identify evolutionary shifts in trait’s mean expectation, Brownian motion (BM) models and Ornstein-Uhlenbeck (OU) models (Beaulieu et al., 2012; Uyeda, Harmon, 2014; Khabbazian et al., 2016; Bastide et al., 2018; Castiglione et al., 2018). By using l1ou, we were able to select models that best described the trait distribution on the tips, optimizing the number of shifts, their positions, evolutionary variance (σ²), and selective strength (ɑ) (Khabbazian et al., 2016). Therefore, we selected the model to impute missing traits based on their selective strength that could differentiate BM to OU model and identify the number and position of the evolutionary shifts.
We imputed missing data as the sum of species regime optima and their residual deviations from the root state (Garland, Ives, 2000):
Y = XB + ℇ
where XB is the regime optima and ∈(CiC-1 (X – µ))is the phylogenetic residual mean. C is the variance-covariance of all species in the phylogeny transformed by the fitted Ornestein-Uhlenbeck model. Ci is the species column in C, X is the observed species body sizes and µ the fitted root state.
Occurrence records. We downloaded occurrence records of the 748 species from three sources: 1) Global Biodiversity Information Facility (GBIF) (https://www.gbif.org/); 2) SpeciesLink (https://specieslink.net/search/), Sistema de Informação sobre a Biodiversidade Brasileira (SiBBR)(https://www.sibbr.gov.br/); 3) Portal da Biodiversidade (https://www.gov.br/icmbio/pt-br/assuntos/programas-e-projetos/portal-da-biodiversidade – currently deactivated) and Neotropical Freshwater Fishes (Tonella et al., 2022).
Once all records were compiled, we recorded the total number of occurrences of each species, the proportion of occurrences within the Tocantins-Araguaia basin, and endemism (i.e., a value indicating if the species have no records out of the basin, if species have occurrences found only within the basin it is considered endemic). For species with more than three occurrences in the occurrence databases searched, we calculated the area of occurrence (in square meters) by calculating a convex hull and transforming it into a spatial polygon using the sf package (Pebesma, 2018). Some of these variables were used in the statistical models (number of synonyms, total occurrence records, date of first description, Darwinian shortfall, and body length) and some were used only as general descriptor variables to support our interpretation of the patterns in genetic information distribution among species (endemic status and area of occurrence).
Statistical analyses and modelling. We initially described the frequency of individual genomic regions and unique genomic regions across the species list. We explored their phylogenetic patterns based on Moran’s Iphylogenetic correlograms (Legendre, Legendre, 2013) after log-transformation of the number of sequences for each species to reduce skewness in their distributions. Moran’s I is a metric that is used to determine whether the distribution of a characteristic is influenced by the phylogenetic relationships among species (phylogenetic signal). Significant positive values of Moran’s I statistic indicate that species that are phylogenetically similar also present similarities regarding their number of genomic regions and/or unique genomic regions sampled. To calculate Moran’s I patristic distances among species based on the phylogeny were scaled to vary between 0 and 1 and divided into five equal classes to obtain the correlograms.
We modeled the log-transformed number of individual genomic regions (for each one of the seven regions mentioned in subsection Molecular data) and the number of unique genomic regions for each species as a function of the date of first description, number of synonyms, number of occurrences in the Tocantins-Araguaia basin, relative PD (Darwinian shortfall), and log-transformed body length. The number of genomic region sequences can be viewed as a proxy for the genetic sampling effort of a given species for each region. However, it is worth noting that this quantity differs from the number of individuals with genetic information since it is hard to differentiate the individuals in the BOLD and NCBI databases. The number of synonyms can be viewed in two ways. First, as a proxy of taxonomic effort; species with more synonyms may be more taxonomically stable since they were submitted to greater taxonomic scrutiny. On the other hand, the number of synonyms indicates more taxonomic uncertainty, where there is discordance regarding the taxonomic status of a given species. In the context of a species’ relationship with genetic information, the second case is of greater interest since genetic data can help to clarify the taxonomic status of species.
Because of the phylogenetic signal detected using Moran’s I correlograms in the response variables and residuals of an Ordinary Least-Squares (OLS) multiple regression, a Phylogenetic Generalized Least Squares (PGLS) was applied, using a flexible λ, allowing the incorporation of different strengths of phylogenetic structure in data (with λ = 1 indicating strong phylogenetic structure assuming a Brownian motion, and λ = 0 indicating no phylogenetic structure in data, so PGLS converges to an OLS), avoiding potential inference problems (type I error). Nagelkerke’s pseudo-R2 was calculated based on likelihood ratios. Phylogenetic analyses were performed in the R packages ape (Paradis, Schliep, 2019), phyloglm (Ho, Ané, 2014), and phytools (Revell, 2024).
Results
Out of the 748 species in the reviewed Tocantins-Araguaia River basin ichthyofauna list, about 16% (N = 117) of species are endemic to the basin, with a median of 22% of occurrence of all records for each species found within the basin. Accounting for missing data (46 species) in our compiled list, we estimated that 21% of the species are endemic to the basin, a value close to the one reported by Chamon et al. (2022).
Information about molecular sequences is available for about 67% of the species studied here, with an average of 30% of the species with sequences available for the seven genomic regions. We obtained genetic information for 69% of non-endemic species, versus only 26% of species for endemic species. Across both endemic and non-endemic species, the COI region emerges as the primary repository of genetic data per species, encompassing approximately 59% (N = 444 species) (Fig. 1A). Conversely, the atp8 region yielded fewer sequences, providing no information for any endemic species. Among the five genetic regions with the highest number of species with available data, only 107 species offered information for all five regions (COI, cytB, rag1, rag3,and myhB) (Fig. 1B). Accordingly, the mean Darwinian shortfall estimated for the endemic species is three times higher than for non-endemic species (F = 71.2; P << 0.01). A general overview of the phylogenetic relationship of 748 fish species with their respective information on the six most common molecular markers is shown in Fig. 2.
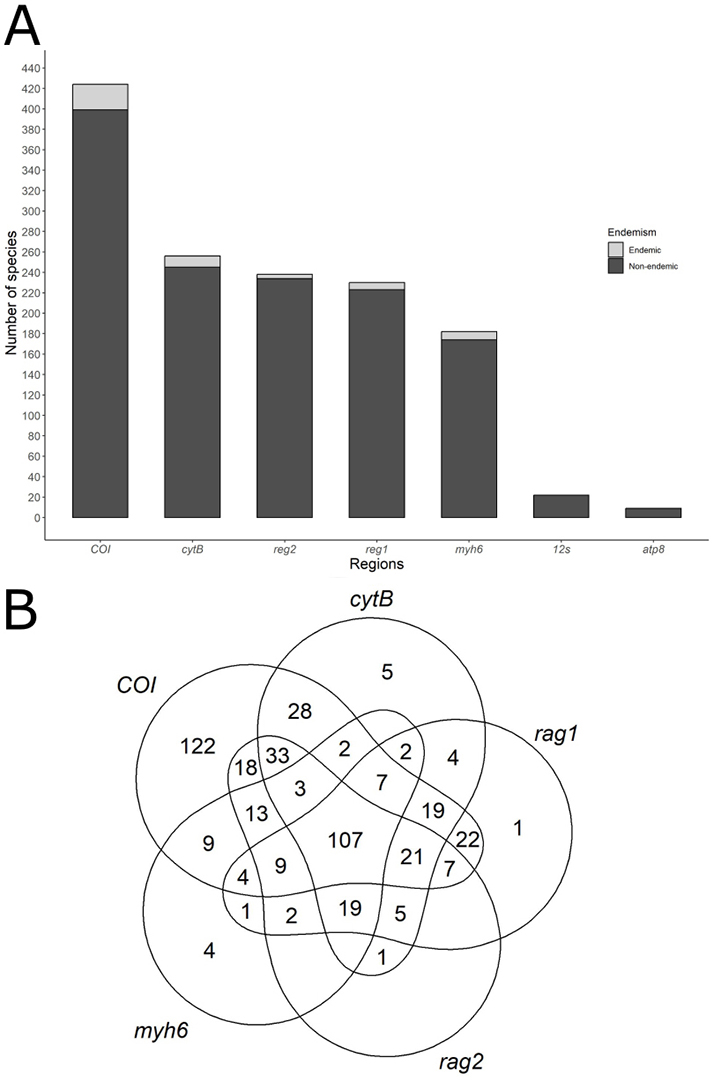
FIGURE 1| Fish species in the Tocantins-Araguaia River basin with genetic information for COI, cytB, rag2, rag1, myh6, 12S, atp8 regions. A. Number of species with genetic information per region; B. Venn Diagram illustrating the five regions with the highest number of species with genetic information. The numbers within each shape represent the species with genetic information for a combination of regions.
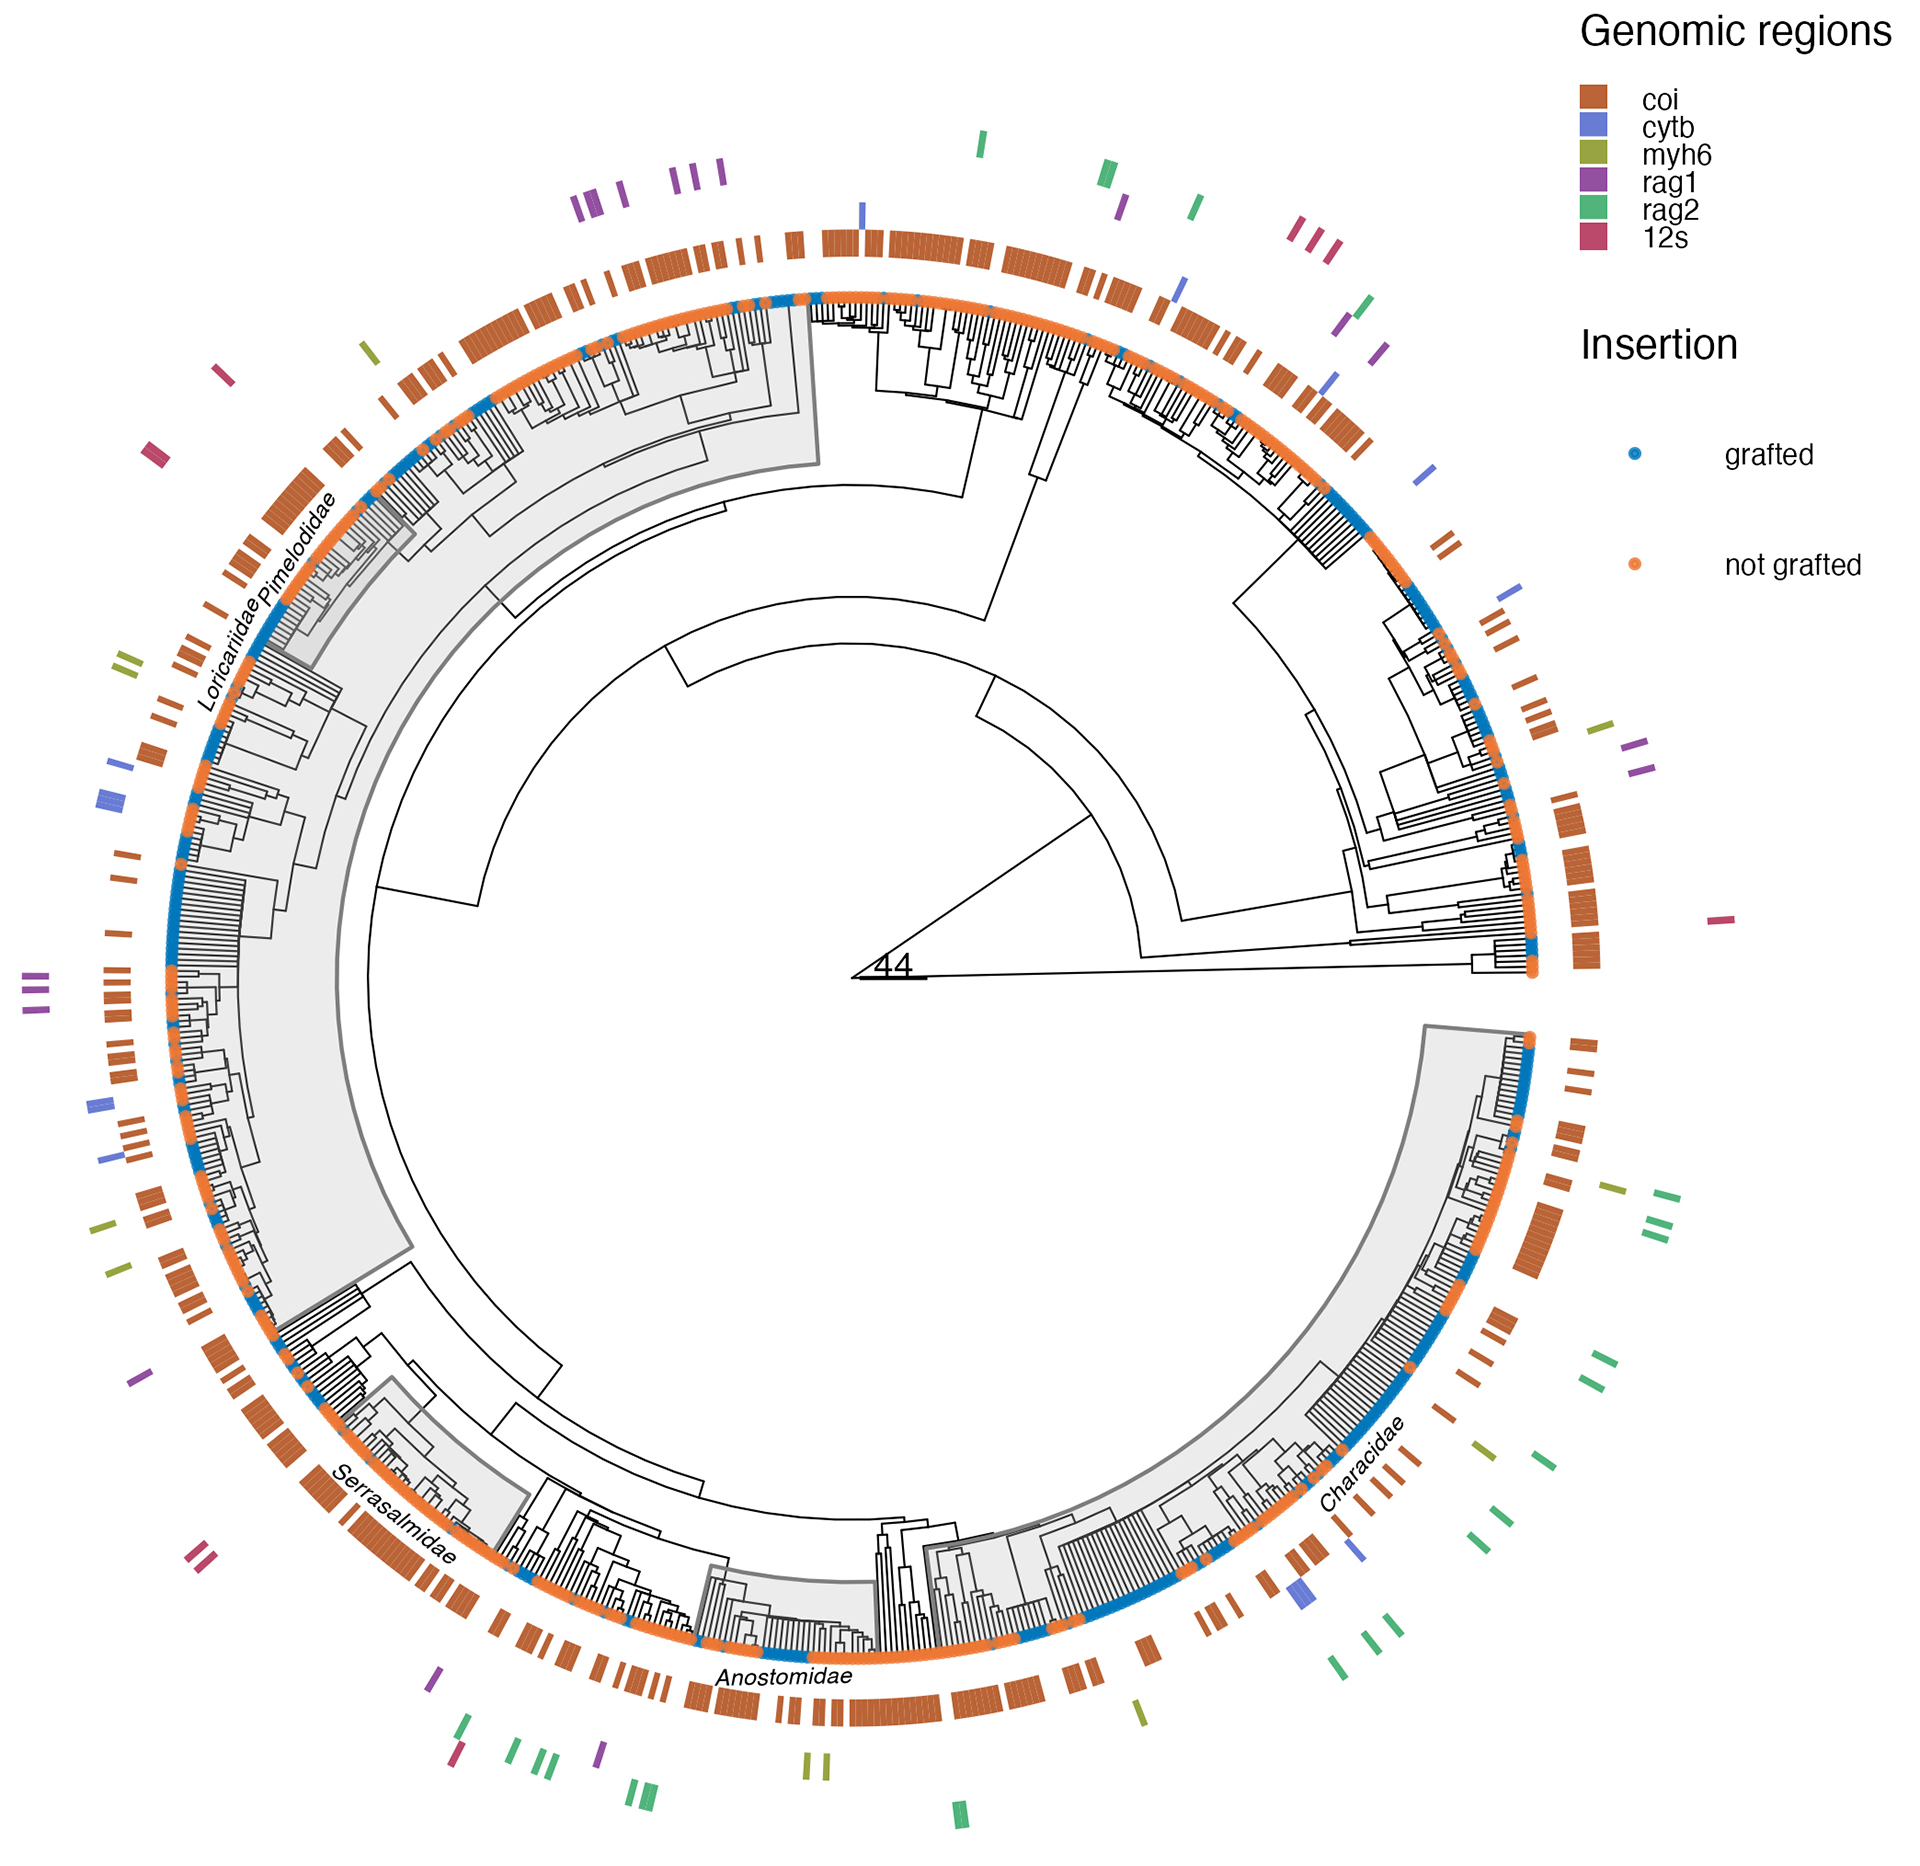
FIGURE 2| The phylogenetic tree and distribution of genetic information are represented by the five most common genetic regions and 12s gene (concentric tiles) for 748 fish species. The gray areas close to the tips highlighted in the phylogeny represent the five most common families regarding the amount of genetic information (Characidae, Loricariidae, Serrrasalmidae, Anostomidae, and Pimelodidae). The color in the tiles represents the presence of a given genetic region for each species in the phylogeny. The tip points in the phylogeny indicate if the species was grafted in the backbone phylogeny.
Moran’s I correlograms reveal a phylogenetic signal in coverage of genetic regions. The total number of unique genomic regions available for the species shows a low but significant autocorrelation in short phylogenetic distance classes (I = 0.146 for species related at 10% of maximum distance), followed by Moran’s I close to zero for all other distance classes (Fig. 3). The number of individuals sequenced for each of the most used genetic regions have higher values for Moran’s I at these short phylogenetic distances, ranging from 0.317 for RAG2 to 0.029 for 12S (Fig. 3; Tab 1). The correlogram for RAG2 shows a more clinal pattern in which there is a gradient in phylogenetic autocorrelation up to mean phylogenetic distances (Fig. 3). All regions follow the same patterns, with significant Moran’s I only in the first distance class (except for MYH6 and atp8, for which no significant autocorrelation is found for Moran’s I).
TABLE 1 | PGLS standardized regression coefficients for the effect of the number of synonyms (Synonyms), date of first description (Date), number of occurrences (Occurrence), Darwinian shortfall (PD), and Body Length (BL) on the number of unique genetic regions across species, and for the number of individual regions of each species sequenced for six genes more commonly used (COI, CytB, RAG2, RAG1, MYH6, atp8,and 12S). Coefficients in bold indicate significant (P < 0.05) effects. Also shown are the λ fitted in PGLS and the pseudo-R2 of the model. Moran’s I coefficients estimate the phylogenetic autocorrelation coefficient in the first distance class of the correlogram for each region (see Fig. 3).
| Unique | COI | CytB | RAG2 | RAG1 | Myh6 | atp8 | 12S |
Synonyms | 0.095 | 0.239 | 0.269 | 0.123 | 0.038 | 0.109 | 0.057 | 0.016 |
Date | -0.086 | -0.132 | 0.064 | -0.055 | -0.077 | -0.001 | 0.003 | -0.003 |
Occurrence | 0.358 | 0.597 | 0.197 | 0.123 | 0.106 | 0.079 | -0.002 | 0.001 |
PD | -0.337 | -0.269 | -0.206 | -0.148 | -0.146 | -0.154 | -0.011 | 0.000 |
BL | 0.060 | 0.179 | -0.008 | 0.009 | 0.016 | 0.009 | -0.012 | 0.032 |
ì | 0.495 | 0.408 | 0.910 | 0.891 | 0.797 | 0.919 | 0.999 | 0.416 |
pseudo-R2 | 0.495 | 0.579 | 0.271 | 0.256 | 0.182 | 0.187 | 0.071 | 0.087 |
Moran’s I | 0.145 | 0.189 | 0.271 | 0.317 | 0.222 | 0.225 | 0.057 | 0.029 |
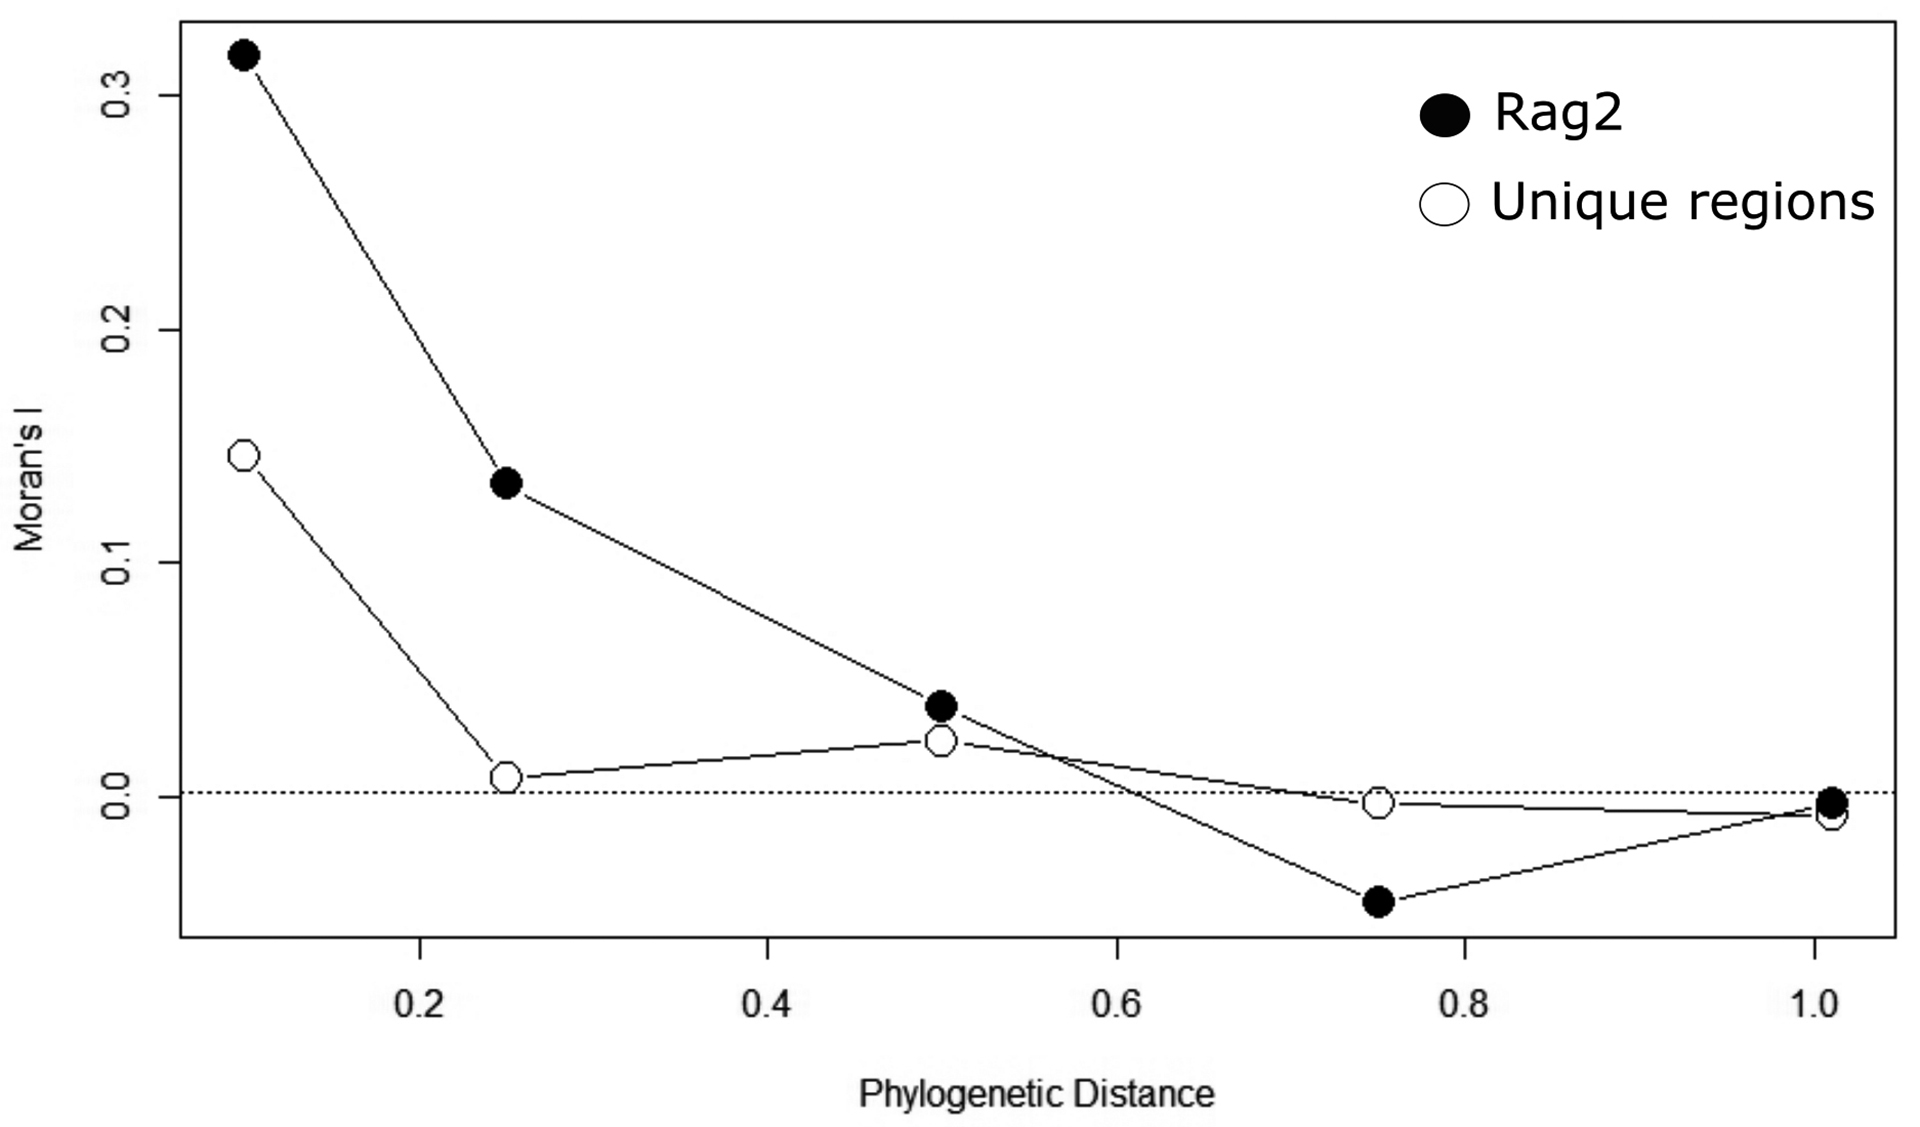
FIGURE 3| Phylogenetic correlograms were built using Moran’s I autocorrelation coefficient for five distance classes, the number of different genetic regions (open circles), and the number of individual genetic regions sequenced for RAG2 (closed circles).
Given the statistically significant Moran’s I phylogenetic autocorrelation equal to 0.102 (P < 0.019), we used a PGLS with a flexible λ to model the effects of predictors on genetic regions. The PGLS models with the high explanatory power (i.e., R2 > 0.5) were found for the number of unique regions and the number of individual regions sequenced for COI (Tab. 1), with regression coefficients with similar magnitudes and directions. The species best characterized for genetic regions are those with more occurrences and exhibit a lower Darwinian shortfall in phylogeny. Smaller effects were found for a higher number of synonyms (more genes for species with more synonyms) and species described earlier (i.e., more unique genes and more number of total genes for species described first than species described recently) (Tab. 1). Regarding body size, we found coefficients close to zero in all analyses but COI (with a small but positive coefficient).
Discussion
Our analyses reveal patterns of lack of knowledge on genetic and molecular data for Tocantins-Araguaia ichthyofauna. The knowledge gaps are associated mainly with the poor coverage of genetic information on endemic species. This is probably associated with the low coverage of genetic samples for tropical species, since most of genetic samples are mainly related to non-tropical species in the databases we used (BOLD and NCBI), as identified for other taxonomic groups and tropical megadiverse countries (Noreña et al., 2018; Arana et al., 2024). To our knowledge, this is the first assessment of genetic information available in one of the main tropical basins in South America. Also, the analyses here point out a series of methodological issues related to the analyses of Linnean, Wallacean, and Darwinian shortfalls. Since molecular data is currently the most reliable information to construct phylogenetic relationships among species (e.g., Hughes et al., 2018; Rabosky et al., 2018) and also permits the use of barcoding techniques for species identifications and delineations (e.g., Boza et al., 2022; Souza et al., 2023), or to evaluate overall biodiversity patterns (i.e., Sales et al., 2021; Lin et al., 2023; Diniz-Filho et al., 2024), the lack of genetic information in endemic species of Tocantins-Araguaia hampers the understanding of biodiversity patterns and processes in this important tropical basin.
It is worth noticing that this very low coverage of molecular information for endemic species in the Tocantins-Araguaia basin is coherent with the relatively high number of species that were imputed in Cassemiro et al. (2023) phylogeny for analyses, resulting in a much higher Darwinian shortfall for endemic species using Nakamura et al. (2021) approach. The PD deficits (amount of Darwinian shortfall by each species) are one of the most important predictors for both the number of unique genetic regions and the total number of individual regions by species, according to our PGLS model. This result indicates that the lack of knowledge regarding phylogenetic relationships among fish species in the Tocantins-Araguaia River basin is related to the lack of genetic information needed to build reliable phylogenies once molecular information is essential in producing megaphylogenies.
By considering the overall lack of knowledge and sampling in the Tocantins-Araguaia (Almeida et al., 2021), even species that have some information on molecular data available, it is more likely that the populations or individuals from which the genetic data were taken are not within the basin (although this is not straightforward to evaluate due to a generalized lack of coordinates of genetically evaluated individuals). Once the effects of environmental changes depend on the scale and local context, the lack of local samples and coordinates in genomic data impedes a better understanding of the genetic structure and historical processes acting in these local populations. Therefore, we also stress the need to increase efforts to obtain spatially explicit genetic information on populations within the Tocantins-Araguaia River basin, especially in the face of climate change, which can drive the loss of genetic diversity of natural populations, homogenizing genetic variability and hampering these natural populations by limiting its capacity to deal with environmental changes (Lima et al., 2017).
Also, there is a bias regarding the genetic information for fish species, as COI is the region most available in BOLD and NCBI. Part of this is because our search was based on BOLD, and COI was the first standardized DNA barcode region (i.e., Hebert et al., 2004). Additionally, using COI region to DNA barcode exhibits a high ability to distinguish between species (Zangl et al., 2022). However, it is also important to highlight that the use of other regions must refine the phylogenetic relationship and molecular identification. It is also worth noting that other important regions to construct phylogenetic hypotheses are scarce for fish species of Tocantins-Araguaia (e.g., 12s, 16s, rag1 and rag2 to cite a few, see Rabosky et al., 2018, for a list of markers used). Therefore, if we also aim to advance toward a better understanding of the phylogenetic relationships of Tocantins-Araguaia fishes, greater efforts should be made to increase the coverage of genetic regions beyond the COI.
We found some short-distance phylogenetic signal in this knowledge of molecular data, which can be likely related to life-history and ecological traits that make species more available for sampling or associated with the systematic practice of reviewing and analyzing entire genus or families using molecular approaches. The phylogenetic signal at shorter distances may be because systematists always make revisions and study genera or entire families (e.g., Lum et al., 2020; Freitas et al., 2021; Diniz-Filho et al., 2023), or also due to phylogeography studies involving species from the same genus of family. Reviewing genera and families will produce more molecular data to separate species and would explain the autocorrelation of genetic data in the first phylogenetic distance classes. Further analyses of phylogenetic endemism in the basin could also reinforce the link between Wallacean and Darwinian shortfalls in a biogeographic context, reinforcing the lack of knowledge of endemic species. This signal must be considered when modeling these molecular data with the PGLS, which provides several insights about coverage and biases in the knowledge of the Tocantins-Araguaia ichthyofauna.
The knowledge of genetic data is positively correlated with the number of occurrences for each species, with more information available for those species with more occurrences (a surrogate for large geographic ranges). This is expected and would indicate a passive sampling effect in which more information is available for wide-ranged species. Reinforcing this argument, PGLS coefficients also showed that more molecular information is available for species described earlier and those with more synonyms. The positive relationship between the availability of genetic information and the number of synonyms can be interpreted in different ways. First, this high number of synonyms may indicate more stability of species when they are related to more taxonomic revisions throughout species’ history. Second, it may reveal more complexity in population structure, generating genetic diversity and eventually hiding new species to be described after future taxonomic revisions (e.g., Parsons et al., 2022). In the last case, we reinforce the need to increase the genetic sampling efforts of local species populations in the Tocantins-Araguaia basin.
There are important consequences for Linnean shortfall in the region if we couple our results (mainly the relationship between the number of occurrences and genetic information) with the relatively poor knowledge of endemic species previously discussed by considering patterns of species discovery in Neotropical fishes, which can be associated with recent patterns of speciation (Freitas et al., 2021; Cerezer et al.,2023). Chamon et al. (2022) pointed out that at least 20 new species were in the process of description at the date of publication of their paper. Although it is impossible to define, solely from this information, how many of these new taxa came from revisions of previously described taxa. Our results based on the data available in NCBI and BOLD suggest that the revisionary process of current species (one of the components of the Linnean shortfall) can be important to achieve a better understanding of the number of species in the Tocantins-Araguaia basin. The main issue is that, as pointed out by Cerezer et al. (2023), widespread species in different hydrographical basins with particular ecological and life-history characteristics, such as small-bodied species with narrow dietary niches and living in specific habitats (lotic environments), are most likely isolated and would turn to be considered, shortly, as new species, or at least new independent evolutionary units for conservation purposes. Here, we obtained a positive relationship between the amount of genetic information available and the number of occurrences. Still, it is important to note that this information might not come from individuals or populations within the Tocantins-Araguaia basin since a considerable portion of the genetic data is from individuals of the same species with occurrence in Tocantins-Araguaia but lacks precise geographic information or, when present, it was sampled from other areas. Thus, evaluating in more detail the population structure and phylogeographical patterns in these species is important because it could lead to the description of new hidden species.
Perspectives and recommendations on the use and sampling of genetic information for freshwater fish species from public databases
From an applied perspective, our analyses point out some pathways for further studies to advance the knowledge of the genetic and molecular diversity of ichthyofauna in the basin. For instance, it would be possible to establish priorities for obtaining new genetic data for the species based on several possibilities. A higher priority should be given to endemic species of the Tocantins-Araguaia basin. By considering the correlation between endemism and the Darwinian shortfall among species, sequencing endemic species would be a goal to get more robust estimates of phylogenies, allowing a more accurate evaluation of ecological and biogeographical patterns in the region.
On a more elaborated level, the other alternative would be, following Cerezer et al. (2023), focusing on describing population structure and phylogeographical patterns of widespread, small-bodied species with particular ecological and life-history characteristics, which would potentialize the probability of finding new species by better delimiting the already described species (the second component of the Linnean shortfall) – even though the effect of body size in our analyses was negligible. Finally, the importance of expanding the genomic regions sampled and targeting regions adequate to assemble phylogenetic relationships among species is worth mentioning, as also highlighted by Janzen et al. (2022).
Our results based on describing and modeling the knowledge patterns of molecular data in the Tocantins-Araguaia ichthyofauna are important to define strategies for mitigating the lack of data and filling gaps, providing a better description of biodiversity patterns and, hopefully, a more accurate basis for further data-driven conservation actions (e.g., Monchamp et al., 2023). Moreover, it is important to consider, when trying to account for these gaps, to disentangle the important interactions between Linnean, Wallacean, and Darwinian shortfalls at a regional scale. Future studies should also focus on integrating the conservation status of fishes in the Tocantins-Araguaia River basin with the availability of genetic information.
Acknowledgments
This work is a contribution of the Institutos Nacionais de Ciência e Tecnologia (INCT) in Ecology, Evolution, and Biodiversity Conservation funded by Conselho Nacional de Desenvolvimento Científico e Tecnológico (CNPq grant 465610/2014–5) and Fundação de Amparo à Pesquisa do Estado de Goiás (FAPEG grant 201810267000023), and of the “Araguaia Vivo 2030” program developed under the agreement between the Tropical Alliance Water Research (TWRA) and FAPEG (proc. 202210267000536), with grants to MPCT, JAFDF, CPT, FBT, and RN. LCJC, LEFF, GRGT, JCP, DOS and NMS receive MsC or Doctoral fellowships (PROAP and PROEX) from Coordenação de Aperfeiçoamento de Pessoal de Nível Superior (CAPES), and FB a PIBIC fellowship from CNPq. This paper is also part of the “PPBio Araguaia” project supported by CNPq (proc. 441114/2023–7), and work by JAFDF, MPCT, MD, FBT is also supported by several CNPq productivity grants.
References
Almeida TC, Tessarolo G, Nabout JC, Teresa FB. Non-stationary drivers on fish sampling efforts in Brazilian freshwaters. Divers Distrib. 2021; 27(7):1224–34. https://doi.org/10.1111/ddi.13269
Arana A, Arana C, Watsa M, Tobler MW, Pacheco V, Esteves J et al. Lack of local genetic representation in one of the regions with the highest bird species richness, the Peruvian Amazonia. PLoS ONE. 2024; 19(1):e0296305. https://doi.org/10.1371/journal.pone.0296305
Bastide P, Solís-Lemus C, Kriebel R, Sparks KW, Ané C. Phylogenetic comparative methods on phylogenetic networks with reticulations. Syst Biol. 2018; 67(5):800–20. https://doi.org/10.1093/sysbio/syy033
Beaulieu JM, O’Meara BC, Donoghue MJ. Identifying hidden rate changes in the evolution of a binary morphological character: the evolution of plant habit in campanulid angiosperms. Syst Biol. 2013; 62(5):725–37. https://doi.org/10.1093/sysbio/syt034
Bini LM, Diniz-Filho JAF, Rangel TF, Bastos RP, Pinto MP. Challenging Wallacean and Linnean shortfalls: knowledge gradients and conservation planning in a biodiversity hotspot. Divers Distrib. 2006; 12(5):475–82. https://doi.org/10.1111/j.1366-9516.2006.00286.x
Boza BR, Cruz VP, Stabile G, Rotundo MM, Foresti F, Oliveira C. Mini DNA barcodes reveal the details of the foraging ecology of the largehead hairtail, Trichiurus lepturus (Scombriformes: Trichiuridae), from São Paulo, Brazil. Neotrop Ichthyol. 2022; 20(2):e210166. https://doi.org/10.1590/1982-0224-2021-0166
Brosse S, Charpin N, Su G, Toussaint A, Herrera‐r GA, Tedesco PA et al. FISHMORPH: a global database on morphological traits of freshwater fishes. Glob Ecol Biogeogr. 2021; 30(12):2330–36. https://doi.org/10.1111/geb.13395
Cassemiro FAS, Albert JS, Antonelli A, Menegotto A, Wüest RO, Cerezer F et al. Landscape dynamics and diversification of the megadiverse South American freshwater fish fauna. PNAS. 2023; 120(2):e2211974120. https://doi.org/10.1073/pnas.2211974120
Castiglione S, Tesone G, Piccolo M, Melchionna M, Mondanaro A, Serio C et al. A new method for testing evolutionary rate variation and shifts in phenotypic evolution. Methods Ecol Evol. 2018; 9(4):974–83. https://doi.org/10.1111/2041-210X.12954
Cerezer FO, Dambros CS, Coelho MTP, Cassemiro FA, Barreto E, Albert JS et al. Accelerated body size evolution in upland environments is correlated with recent speciation in South American freshwater fishes. Nature Comm. 2023; 14(1):6070. https://doi.org/10.1038/s41467-023-41812-7
Chamon CC, Serra JP, Camelier P, Zanata AM, Fichberg I, Marinho MMF. Building knowledge to save species: 20 years of ichthyological studies in the Tocantins-Araguaia River basin. Biota Neotrop. 2022; 22:e20211296. https://doi.org/10.1590/1676-0611-BN-2021-1296
Colli GR, Vieira CR, Dianese JC. Biodiversity and conservation of the Cerrado: recent advances and old challenges. Biodivers Conserv. 2020; 29:1465–75. https://doi.org/10.1007/s10531-020-01967-x
Dagosta FCP, de Pinna M. The fishes of the Amazon: distribution and biogeographical patterns, with a comprehensive list of species. Bull Am Mus Nat Hist. 2019; 2019(431):1–163. https://doi.org/10.1206/0003-0090.431.1.1
Diniz-Filho JAF, Bini LM, Targueta CP, Telles MPC, Jardim L, Machado KB et al. Environmental DNA and biodiversity patterns: a call for a community phylogenetics approach. Perspec Ecol Conserv. 2024; 22(1):15–23. https://doi.org/10.1016/j.pecon.2024.01.006
Diniz-Filho JAF, Jardim L, Guedes JJM, Meyer L, Stropp J, Frateles LEF et al. Macroecological links between the Linnean, Wallacean, and Darwinian shortfalls. Front Biogeogr. 2023; 15(2):e59566. https://doi.org/10.21425/F5FBG59566
Diniz-Filho JAF, Loyola RD, Raia P, Mooers A, Bini LM. Darwinian shortfalls in biodiversity conservation. Trends Ecol Evol. 2013; 28(12):689–95. https://doi.org/10.1016/j.tree.2013.09.003
Faria LRR, Pie MR, Salles FF, Soares EDG. The Haeckelian shortfall or the tale of the missing semaphoronts. J Zool Syst Evol Res. 2021; 59:359–69. https://doi.org/10.1111/jzs.12435
Freeman BG, Pennell MW. The latitudinal taxonomy gradient. Trends Ecol Evol. 2021; 36(9):778–86. https://doi.org/10.1016/j.tree.2021.05.003
Freitas TMS, Stropp J, Calegari BB, Calatayud J, Marco P, Montag LFA et al. Quantifying shortfalls in the knowledge on Neotropical Auchenipteridae fishes. Fish Fisheries. 2021; 22(1):87–104. https://doi.org/10.1111/faf.12507
Fricke R, Eschmeyer WN, Van der Laan R. Eschmeyer’s catalog of fishes: genera, species, references [Internet]. San Francisco: California Academy of Science; 2024. Available from: http://researcharchive.calacademy.org/research/ichthyology/catalog/fishcatmain.asp
Froese R, Pauly D. FishBase [Internet]. World Wide Web electronic publication. 2021. Available from: https://www.fishbase.se/search.php
García-Girón J, Bini LM, Heino J. Shortfalls in our understanding of the causes and consequences of functional and phylogenetic variation of freshwater communities across continents. Biol Conserv. 2023; 282:110082. https://doi.org/10.1016/j.biocon.2023.110082
Garland T Jr., Ives AR. Using the past to predict the present: confidence intervals for regression equations in phylogenetic comparative methods. Am Nat. 2000; 155(3):346–64. https://doi.org/10.1086/303327
Hebert PDN, Stoeckle MY, Zemlak TS, Francis CM. Identification of birds through DNA barcodes. PLoS Biol. 2004; 2(10):e312. https://doi.org/10.1371/journal.pbio.0020312
Ho T, Ané C. A linear-time algorithm for gaussian and non-gaussian trait evolution models. Syst Biol. 2014; 63(3):397–408. https://doi.org/10.1093/sysbio/syu005
Hortal J, de Bello F, Diniz-Filho JAF, Lewinsohn TM, Lobo JM, Ladle RJ. Seven shortfalls that beset large-scale knowledge of biodiversity. Ann Rev Ecol Evol Syst. 2015; 46:523–49. https://doi.org/10.1146/annurev-ecolsys-112414-054400
Hughes LC, Ortí G, Huang Y, Sun Y, Baldwin CC, Thompson AW et al. Comprehensive phylogeny of ray-finned fishes (Actinopterygii) based on transcriptomic and genomic data. PNAS. 2018; 115(24):6249–54. https://doi.org/10.1073/pnas.1719358115
Humphries AT, Dimarchopoulou D, Stergiou KI, Tsikliras AC, Palomares M-LD, Bailly N et al. Measuring the scientific impact of FishBase after three decades. Cybium. 2023; 47(3):213–24. https://doi.org/10.26028/CYBIUM/2023-002
Janzen FH, Crampton WGR, Lovejoy NR. A new taxonomist-curated reference library of DNA barcodes for Neotropical electric fish (Teleostei: Gymnotiformes). Zool J Linn Soc. 2022; 196(4):1718–42. https://doi.org/10.1093/zoolinnean/zlac039
Keck F, Altermatt F. Management of DNA reference libraries for barcoding and metabarcoding studies with the R package refdb. Mol Ecol Res. 2023; 23(2):511–18. https://doi.org/10.1111/1755-0998.13723
Khabbazian M, Kriebel R, Rohe K, Ané C. Fast and accurate detection of evolutionary shifts in Ornstein–Uhlenbeck models. Methods Ecol Evol. 2016; 7(7):811–24. https://doi.org/10.1111/2041-210X.12534
Klink C, Machado RB. Conservation of the Brazilian Cerrado. Conserv Biol. 2005; 19(3):707–13. https://doi.org/10.1111/j.1523-1739.2005.00702.x
Latrubesse EM, Arima E, Ferreira ME, Nogueira SH, Wittmann F, Dias MSP et al. Fostering water resource governance and conservation in the Brazilian Cerrado biome. Conserv Sci Pract. 2019; 1(9):e77. https://doi.org/10.1111/csp2.77
Legendre P, Legendre L. Numerical Ecology, 3rd ed. Amsterdan, Elsevier, 2013.
Li D. rtrees: an R package to assemble phylogenetic trees from megatrees. Ecography. 2023; 2023(7):e06643. https://doi.org/10.1111/ecog.06643
Lima JS, Ballestros-Mejia L, Lima-Ribeiro M, Collevatti RG. Climatic changes can drive the loss of genetic diversity in a Neotropical savanna tree species. Glob Chang Biol. 2017; 23(11):4639–50. https://doi.org/10.1111/gcb.13685
Lin Y, Feng T, Tang L, Zhang H, Zhang J, Chen Q et al. Identification of suitable tributaries to compensate fish habitat loss in dammed rivers using environmental DNA metabarcoding. Hydrobiologia. 2023; 850:3551–64. https://doi.org/10.1007/s10750-023-05253-z
Lum D, Rheindt FE, Chisholm RA. Tracking scientific discovery of avian phylogenetic diversity over 250 years. Proc R Soc London B. 2022; 289(1973):20220088. https://doi.org/10.1098/rspb.2022.0088
Mace GM, Gittleman JL, Purvis A. Preserving the tree of life. Science. 2003; 300(5626):1707–09. https://doi.org/10.1126/science.1085510
Monchamp M-E, Taranu ZE, Garner RE, Rehill T, Morissette O, Iversen LL et al. Prioritizing taxa for genetic reference database development to advance inland water conservation. Biol Conserv. 2023; 280:109963. https://doi.org/10.1016/j.biocon.2023.109963
Moura MR, Jetz W. Shortfalls and opportunities in terrestrial vertebrate species discovery. Nature Ecol Evol. 2021; 5:631–39. https://doi.org/10.1038/s41559-021-01411-5
Myers N, Mittermeier RA, Mittermeier CG, Fonseca GAB, Kent J. Biodiversity hotspots for conservation priorities. Nature. 2000; 403:853–58. https://doi.org/10.1038/35002501
Nakamura G, Richter A, Soares BE. FishPhyloMaker: an R package to generate phylogenies for ray-finned fishes. Ecol Inform. 2021; 66:101481. https://doi.org/10.1016/j.ecoinf.2021.101481
Noreña PA, González Muñoz A, Mosquera-Rendón J, Botero K, Cristancho MA. Colombia, an unknown genetic diversity in the era of Big Data. BMC Genomics. 2018; 19:859. https://doi.org/10.1186/s12864-018-5194-8
Paradis E, Schliep K. ape 5.0: an environment for modern phylogenetics and evolutionary analyses in R. Bioinformatics. 2019; 35(3):526–28. https://doi.org/10.1093/bioinformatics/bty633
Parsons DJ, Pelletier TA, Wieringa JG, Duckett DJ, Carstens BC. Analysis of biodiversity data suggests that mammal species are hidden in predictable places. PNAS. 2022; 119(14):e2103400119. https://doi.org/10.1073/pnas.2103400119
Pebesma EJ. Simple features for R: standardized support for spatial vector data. The R Journal. 2018; 10(1):439–46. https://journal.r-project.org/archive/2018/RJ-2018-009/index.html
Pelicice FM, Agostinho AA, Akama A, Andrade Filho JD, Azevedo-Santos VM, Barbosa MVM et al. Large scale degradation of the Tocantins-Araguaia River basin. Environ Sci. 2021; 68:445–52. https://doi.org/10.1007/s00267-021-01513-7
Polanco AF, Richards E, Flück B, Valentini A, Altermatt F, Brosse S et al. Comparing the performance of 12S mitochondrial primers for fish environmental DNA across ecosystems. Environ DNA. 2021; 3(6):1113–27. https://doi.org/10.1002/edn3.232
R Development Core Team. R: a language and environment for statistical computing. R Foundation for Statistical Computing, Vienna, Austria. 2023. Available from: https://www.R-project.org/
Rabosky DL, Chang J, Title PO, Cowman PF, Sallan L, Friedman M et al. An inverse latitudinal gradient in speciation rate for marine fishes. Nature. 2018; 559:392–95. https://doi.org/10.1038/s41586-018-0273-1
Ratnasingham S, Hebert PDN. BOLD: the barcode of life data system. Mol Ecol Notes. 2007; 7(3):355–64. https://doi.org/10.1111/j.1471-8286.2007.01678.x
Reis GS, Tejerina-Garro FL, Dagosta FCP, Teresa FB, Carvalho RA. Seeking for gaps in taxonomic descriptions of endemic fishes: a pathway to challenge the Linnean shortfall in a Neotropical basin. Neotrop Ichthyol. 2024; 22(2):e230128. https://doi.org/10.1590/1982-0224-2023-0128
Revell LJ. phytools 2.0: an updated R ecosystem for phylogenetic comparative methods (and other things). PeerJ. 2024; 12:e16505. https://doi.org/10.7717/peerj.16505
Roque FO, Valente-Neto F, Rodrigues ME, Souza FN, Nogueira DG, Piovezan-Borges AC et al. The tinbergen shortfall: developments on aquatic insect behavior that are critical for freshwater conservation. In: Del-Claro K, Guillermo R, editors. Aquatic Insects. Cham: Springer; 2019. p.365–80. https://doi.org/10.1007/978-3-030-16327-3_15
Sales NG, Wangensteen OS, Carvalho DC, Deiner K, Præbel K, Coscia I et al. Space-time dynamics in monitoring neotropical fish communities using eDNA metabarcoding. Sci Tot Environ. 2021; 754:142096. https://doi.org/10.1016/j.scitotenv.2020.142096
Santana MLC, Carvalho FR, Teresa FB. Broad and fine-scale threats on threatened Brazilian freshwater fish: variability across hydrographic regions and taxonomic groups. Biota Neotropica. 2021; 21(2):e20200980. https://doi.org/10.1590/1676-0611-BN-2020-0980
Souza TB, Ferreira DC, Silva HP, Netto-Ferreira AL, Venere PC. DNA Barcoding of Pyrrhulina australis (Characiformes: Lebiasinidae) reveals unexpected cryptic diversity in the group. Neotrop Ichthyol. 2023; 21(4):e230037. https://doi.org/10.1590/1982-0224-2023-0037
Tavares GRG, Frateles LEF, Diniz-Filho JAF. Effects of the interaction between Linnean and Darwinian shortfalls on diversification gradients. Front Biogeogr. 2024; 1:e131169. https://doi.org/10.21425/fob.17.131169
Tonela L, Ruaro R, Daga VS, Garcia DAZ, Vitorino Júnior OBV, Magalhães TLM et al. Neotropical freshwater fishes: a dataset of occurrence and abundance of freshwater fishes in the Neotropics. Ecology. 2022; 104(4):e3713. https://doi.org/10.1002/ecy.3713
Urbina-Cardona N, Cardona VO, Cuellar S. Uncovering thematic biases in ecosystem services mapping: knowledge shortfalls and challenges for use in conservation. Biol Conserv. 2023; 283:110086. https://doi.org/10.1016/j.biocon.2023.110086
Uyeda JC, Harmon LJ. A novel Bayesian method for inferring and interpreting the dynamics of adaptive landscapes from phylogenetic comparative data. Syst Biol. 2014; 63(6):902–18. https://doi.org/10.1093/sysbio/syu057
Whittaker RJ, Araújo MB, Jepson P, Ladle RJ, Watson JEM, Willis KJ. Conservation biogeography: assessment and prospect. Divers Distrib. 2005; 11(1):3–23. https://doi.org/10.1111/j.1366-9516.2005.00143.x
Zangl L, Schäffer S, Daill D, Friedrich T, Gessl W, Mladinic M et al. A comprehensive DNA barcode inventory of Austria’s fish species. PLoS ONE. 2022; 17(6):e0268694. https://doi.org/10.1371/journal.pone.0268694
Authors

![]() Gabriel Nakamura1,2
Gabriel Nakamura1,2 ![]() ,
, ![]() Leonardo Carlos Jeronimo Corvalán3,4,
Leonardo Carlos Jeronimo Corvalán3,4, ![]() Laura Barreto de Paula-Souza2,5,
Laura Barreto de Paula-Souza2,5, ![]() Lívia Estéfane F. Frateles6,
Lívia Estéfane F. Frateles6, ![]() Guilherme Rogie Gonçalves Tavares6,
Guilherme Rogie Gonçalves Tavares6, ![]() Jullia Costa Pereira3,6,
Jullia Costa Pereira3,6, ![]() Diego Ortiz da Silva3,6,
Diego Ortiz da Silva3,6, ![]() Carmen Barragán-Ruiz2,3,
Carmen Barragán-Ruiz2,3, ![]() Flavia de Paiva Breseghello7,
Flavia de Paiva Breseghello7, ![]() Nina Machado Suzigan6,
Nina Machado Suzigan6, ![]() Cintia Pelegrineti Targueta3,8,
Cintia Pelegrineti Targueta3,8, ![]() Geiziane Tessarolo2,
Geiziane Tessarolo2, ![]() Fabrício Barreto Teresa9,
Fabrício Barreto Teresa9, ![]() Murilo Sversut Dias5,
Murilo Sversut Dias5, ![]() Lucas Jardim10,
Lucas Jardim10, ![]() Rafael Barbosa Pinto2,11,
Rafael Barbosa Pinto2,11, ![]() Rhewter Nunes3,4,
Rhewter Nunes3,4, ![]() Mariana Pires de Campos Telles3,12 and
Mariana Pires de Campos Telles3,12 and ![]() José A. Felizola Diniz-Filho13
José A. Felizola Diniz-Filho13
[1] Departamento de Ecologia, Instituto de Biociências, Universidade de São Paulo (USP), Rua do Matão, 321, Cidade Universitária, 05508-090 São Paulo, SP, Brazil. (GN) gabriel.nakamura.souza@gmail.com (corresponding author).
[2] Instituto Nacional de Ciência & Tecnologia (INCT) em “Ecologia, Evolução e Conservação da Biodiversidade. ICB, UFG, 74690 900 Goiânia, GO, Brazil. (NMS) ninasuzigan@discente.ufg.br, (GT) geites@gmail.com, (RBP) rafaelbpinto@ueg.br.
[3] Laboratório de Genética & Biodiversidade (LGBio), Instituto de Ciências Biológicas I (ICB-I), Universidade Federal de Goiás (UFG), 74690-900 Goiânia, GO, Brazil. (LCJC) leonardocorvalan@discente.ufg.br, (JCP) julia_costa@discente.ufg.br, (DOS) ortiz.dsilva@gmail.com, (CBR) car.hele.ruiz@gmail.com, (CPT) cincintia@hotmail.com, (RN) rhewter@gmail.com, (MPCT) tellesmpc@gmail.com.
[4] Laboratório de Bioinformática e Biodiversidade (LBB), Instituto Acadêmico de Ciências da Saúde e Biológicas (IACSB), Universidade Estadual de Goiás (UEG) – Campus Oeste, UnU Iporá, 76200-000 Iporá, GO, Brazil.
[5] Departamento de Ecologia, Instituto de Ciências Biológicas, Universidade de Brasília (UnB), 70910-900 Brasília, DF, Brazil. (LBPS) laurabarretops@gmail.com, (MSD) msdias@unb.br.
6] Programa de Pós-Graduação em Ecologia & Evolução, ICB, UFG, 74690-900 Goiânia, GO, Brazil.
[7] PIBIC/UFG, Graduação em Ciências Biológicas, ICB, UFG, 74690-900 Goiânia, GO, Brazil. (FPB) flavia.breseghello@gmail.com.
[8] Hospital Veterinário, Escola de Veterinária e Zootecnia, UFG, 74690-900 Goiânia, GO, Brazil.
[9] Programa de Pós-Graduação em Recursos Naturais do Cerrado (RENAC), UEG, Câmpus Central, BR-153, km 99, Zona Rural, 75132-903 Anápolis, GO, Brazil. (FBT) fabricioteresa@yahoo.com.br.
[10] Laboratório de Macroecologia, Instituto de Biociências, Universidade Federal de Jataí (UFJ), Campus Jatobá, 75801-615 Jataí, Goiás, Brazil. (LJ) lucas.ljardim9@gmail.com.
[11] Universidade Estadual de Goiás, Unidade Universitária de Iporá, Iporá, GO, Brazil.
[12] Escola de Ciências Médicas e da Vida, Pontifícia Universidade Católica de Goiás, 74605-010 Goiânia, GO, Brazil.
[13] Departamento de Ecologia, ICB, Ecologia UFG, 74690-900 Goiânia, GO, Brazil. (JAFDF) jafdinizfilho@gmail.com.
Authors’ Contribution 

Gabriel Nakamura: Conceptualization, Data curation, Formal analysis, Investigation, Methodology, Writing-original draft.
Leonardo Carlos Jeronimo Corvalán: Conceptualization, Data curation, Methodology, Writing-review and editing.
Laura Barreto Paula-Souza: Data curation, Formal analysis, Writing-review and editing.
Lívia Estéfane F. Frateles: Conceptualization, Formal analysis, Methodology, Writing-review and editing.
Guilherme Rogie Gonçalves Tavares: Data curation, Formal analysis, Methodology, Writing-review and editing.
Jullia Costa Pereira: Data curation, Formal analysis, Writing-review and editing.
Diego Ortiz da Silva: Data curation, Formal analysis, Writing-review and editing.
Carmen Barragán-Ruiz: Conceptualization, Data curation, Methodology, Writing-review and editing.
Flavia Breseghello: Data curation, Writing-review and editing.
Nina Machado Suzigan: Data curation, Writing-review and editing.
Cintia Pelegrineti Targueta: Conceptualization, Data curation, Formal analysis, Writing-review and editing.
Geiziane Tessarolo: Data curation, Formal analysis, Writing-review and editing.
Fabrício Barreto Teresa: Conceptualization, Data curation, Supervision, Writing-review and editing.
Murilo Sversut Dias: Conceptualization, Data curation, Supervision, Writing-review and editing.
Lucas Jardim: Formal analysis, Methodology, Writing-review and editing.
Rafael Barbosa Pinto: Conceptualization, Formal analysis, Writing-review and editing.
Rhewter Nunes: Conceptualization, Formal analysis, Supervision, Writing-review and editing.
Mariana Pires de Campos Telles: Conceptualization, Formal analysis, Funding acquisition, Supervision, Writing-review and editing.
José Alexandre Felizola Diniz-Filho: Conceptualization, Formal analysis, Funding acquisition, Supervision, Writing-original draft, Writing-review and editing.
Ethical Statement
Analyses based on data available in BOLD Systems and NCBI plataforms, registered in SisGen (Sistema Nacional de Gestão do Patrimônio Genético e do Conhecimento Tradicional Associado), license number A104BAE.
Competing Interests
The author declares no competing interests.
How to cite this article
Nakamura G, Corvalán LCJ, Paula-Souza LB, Frateles LEF, Tavares GRG, Pereira JC, Silva DO, Barragán-Ruiz C, Breseghello FP, Suzigan NM, Targueta CP, Tessarolo G, Teresa FB, Dias MS, Jardim L, Barbosa Pinto R, Nunes R, Telles MPC, Diniz-Filho JAF. Darwinian shortfall and macroecological patterns in genetic data of Tocantins-Araguaia basin fishes. Neotrop Ichthyol. 2025; 23(1):e240047. https://doi.org/10.1590/1982-0224-2024-0047
Copyright
This is an open access article under the terms of the Creative Commons Attribution License, which permits use, distribution and reproduction in any medium, provided the original work is properly cited.
Distributed under
Creative Commons CC-BY 4.0

© 2025 The Authors.
Diversity and Distributions Published by SBI
![]() Accepted January 6, 2025 by William Crampton
Accepted January 6, 2025 by William Crampton
![]() Submitted May 28, 2024
Submitted May 28, 2024
![]() Epub March 31, 2025
Epub March 31, 2025