![]() Sandro Tonello1,
Sandro Tonello1, ![]() Daniel R. Blanco2
Daniel R. Blanco2 ![]() ,
, ![]() Fiorindo J. Cerqueira1,
Fiorindo J. Cerqueira1, ![]() Natália L. Lira2,
Natália L. Lira2, ![]() Josiane B. Traldi3,
Josiane B. Traldi3, ![]() Carla S. Pavanelli4,
Carla S. Pavanelli4, ![]() Vladimir P. Margarido1,
Vladimir P. Margarido1, ![]() Mariane Gavazzoni1,
Mariane Gavazzoni1, ![]() Marcos V. Pupo2 and
Marcos V. Pupo2 and ![]() Roberto L. Lui1
Roberto L. Lui1
PDF: EN XML: EN | Supplementary: S1 S2 | Cite this article
Abstract
This study aimed to identify species of Astyanax bimaculatus group from four Itaipu Reservoir tributaries (Paraná River Basin) by cytogenetics and molecular markers (COI) to investigate the possible occurrence of cryptic diversity in part of this basin. The four populations showed only one karyotype formula and simple AgNORs. FISH with 18S rDNA probe showed a high variation, and 5S rDNA probes evidenced simple sites in most of the specimens, although multiple sites are present in two specimens. The variations of 5S and 18S cistrons generated 13 cytotypes. The molecular data did not reveal cryptic diversity in the populations; however, its grouping with 82 sequences from other stretches of the Paraná River Basin originated three haplogroups (distances of 3.12% and 8.82%) and 33 haplotypes were identified. DNA Barcode suggests that cytogenetic variations represent a high polymorphism degree, and it identified the analyzed specimens as Astyanax lacustris, whichconfirms the morphological identification. Our data suggest that the cryptic diversity of this group in the tributaries of the Paraná River Basin is different than the proposed by the synonymizations of A. altiparanae and A. asuncionensis to A. lacustris. This study reinforces the importance of integrative cytogenetics and molecular methods for taxonomy.
Keywords: 5S rDNA, 18S rDNA, COI, DNA Barcode, FISH.
Este trabalho teve como objetivo identificar espécies do complexo Astyanax bimaculatus de quatro afluentes do reservatório de Itaipu (bacia do Rio Paraná) por métodos citogenéticos e moleculares (COI), investigando a possibilidade de ocorrência de diversidade críptica em parte desta bacia. As quatro populações apresentaram apenas uma fórmula cariotípica e AgNORs simples. A FISH com rDNA 18S apresentou alto grau de variação e as sondas de rDNA 5S evidenciaram sítios simples na maioria dos exemplares, embora sítios múltiplos tenham sido evidenciados em dois espécimes. As variações dos cistrons 5S e 18S geraram 13 citótipos. Os dados moleculares não revelaram diversidade críptica nas populações, entretanto, seu agrupamento com 82 sequências de outros trechos da mesma bacia formou três haplogrupos (distâncias de 3,12% e 8,82%) e gerou 33 haplótipos. O DNA Barcode sugere que as variações citogenéticas representam um alto grau de polimorfismo e identificou os espécimes analisados como Astyanax lacustris, confirmando a identificação por caracteres morfológicos. Nossos dados sugerem que a diversidade críptica do grupo nos afluentes da bacia do Rio Paraná é diferente do proposto pelas sinonimizações de A. altiparanae e A. asuncionensis para A. lacustris, reforçando a importância da integração de métodos citogenéticos e moleculares para a taxonomia.
Palavras-chave: 5S rDNA, 18S rDNA, COI, DNA Barcode, FISH.
Introduction
The morphological similarities of Astyanax Baird & Girard, 1854 species make the identification and establishment of phylogenetic relationships difficult (De Melo, 2001; Mirande, 2010; Oliveira et al., 2011; Rossini et al., 2016) and lead to misidentification (Rossini et al., 2016). Therefore, many authors have categorized Astyanax species into complexes of similar species. Some Astyanax species have a horizontal oval black humeral spot and a black spot on the caudal peduncle, that extends to the end of the median caudal rays (Garutti, Britski, 1997). Moreover, the specimens with two dark brown vertical bars in the humeral region have been included into Astyanax bimaculatus species group (Garutti, 1998). This trait was firstly defined by Garutti, Britski (1997) black humeral spot and a black spot on the supported by several authors (e.g., Garutti, 1998, 1999; Bertaco, Garutti, 2007; Garutti, Langeani, 2009; Lucena, Soares, 2016). Nowadays, A. bimaculatus Linnaeus, 1758 has its geographic distribution restricted to Panama and Amazon basins (Fricke et al., 2021).
Astyanax bimaculatus group comprises 17 valid species spread though most of South American drainages (Fricke et al., 2021), but a high number of these species need revisions and type-specimens are not always extant (Lucena, Soares, 2016). The Paraná River basin used to be a house for three species of Astyanax bimaculatus group: Astyanax asuncionensis Géry, 1972, Astyanax abramis Jenyns, 1842, and Astyanax populations from the Upper Paraná River basin known as “yellow-tailed lambari” were identified as A. bimaculatus until the description of Astyanax altiparanae Garutti & Britski, 2000. Nowadays, A. altiparanae and A. asuncionensis are considered as synonyms of Astyanax lacustris Lütken, 1875 due to external morphological traits (Lucena, Soares, 2016), being A. lacustris and A. abramis the only valid species of the A. bimaculatus group existent in the Paraná River basin (Fricke et al., 2021). Astyanax lacustris was previously restricted to La Plata River and São Francisco River drainages and its distribution was widened to the Paraná River basin after the synonymization (Lucena, Soares, 2016; Fricke et al., 2021).
All the species of A. bimaculatus group have 2n = 50 (Kavalco et al., 2011) and a large metacentric pair, both traits are considered symplesiomorphies of Characidae (Kavalco et al., 2011). However, wide variation in karyotype formulas can be seen in the species complex (Kavalco et al., 2009), and those cytogenetic variations leads to the potential distinction of A. bimaculatus group cryptic species by chromosome markers (Kavalco et al., 2011; Paiz et al., 2015; Da Silva et al., 2016; Gavazzoni et al., 2018). 5S rDNA citrons seems to have a great potential to distinguish species that belong to A. bimaculatus complex (Gavazzoni et al., 2018). Sometimes the association of karyotype formula with other cytogenetic markers, such as Ag-NORs and 18S rDNA, is successful to differentiate some A. lacustris populations (identified as A. altiparanae) (Ferreira-Neto et al., 2009). The usage of chromosome banding with various techniques including 5S and 18S rDNA probes allows to detect species-specific karyotypes (Tenório et al., 2013) or karyotype differences among populations, which suggests evolutionary divergences due to gene flow restriction (Ferreira-Neto et al., 2009).
The usage of cytochrome c oxidase I gene (COI – DNA Barcode) for animal species identification has shown great success (Hebert et al., 2003). It has high interspecific divergence, reduced intraspecific variation, low recombination and absence of introns, presence of well-established primers for amplification in most animals, better phylogenetic signal than other mitochondrial genes, and higher evolution rates compared to genes such as 12S, 16S rDNA and Cytb (Hebert et al., 2003). DNA Barcodeis effective for close species delimitation (Pereira et al., 2013; Rossini et al., 2016; Terán et al., 2020), genus (Melo et al., 2016), orders (Rodrigues, 2010), and relatively effective for A. bimaculatus species complex (Rossini et al., 2016).
Cunha et al. (2019) were the first to perform an integrated analysis between cytogenetics and molecular markers in A. bimaculatus group from coastal basins, in which there is no cryptic diversity revealed by cytogenetic markers, however the COI gene shows three haplogroups. In the Upper Paraná River basin, DNA Barcode was capable to discriminate 252 from 254 species with 99.2% efficacy, where seven Astyanax species were included, and most species were grouped into either only one haplotype or tight clusters (Pereira et al., 2013). Rossini et al. (2016) evidenced five Astyanax clades using 1675 sequences of 366 samples from a database and showed that most species of A. bimaculatus complex are closely related to one another in one clade (Astyanax Clade 3 OTUs). However, samples of A. bimaculatus species complex shows up in three of the five main clades (Clades 3, 4 and 5), and it reveals the high complexity and also clarifies some aspects of the group.
The purpose of this paper is to investigate the A. bimaculatus species complex focusing on the Paraná River basin by using an integrative approach of chromosomal markers and molecular data. The objectives were (1) to investigate whether chromosome variations are accompanied by molecular diversity (DNA Barcoding); (2) to investigate whether DNA Barcoding reveals cryptic diversity in samples from the Paraná River basin stretches above the confluence with Paraguay River. This study may help us to understand a part of one of the most complex groups in Characidae and show new insights about the real diversity of A.bimaculatus group from the Paraná River basin.
Material and methods
Specimens. Twenty-two specimens of Astyanax lacustris were collected from four different locals in the region of Itaipu Lake, municipality of Santa Helena, Paraná River basin and deposited in the Coleção Ictiológica do Núcleo de Pesquisas em Limnologia, Ictiologia e Aqüicultura, Universidade Estadual de Maringá, Maringá (NUP): (1) Vila Rica (VR; 24°51’53.65”S 54°19’47.56”W; NUP 23119), (2) São Gabriel (SG; 24°56’47.0”S 54°19’00.00”W; NUP 23118), (3) Sub-Sede (SS; 24°47’01.55”S 54°18’45.07”W; NUP 23121), and (4) Esquina Céu Azul (CA; 24°55’48.33”S 54°17’36.14”W; NUP 23120). The collection sites belong to four tributaries of Itaipu Lake, Santa Helena municipality, Paraná State, Brazil, where the tributaries do not have specific designations and are popularly known as “stream” or “sanga” by the residents, what led us to name each collection site. The specimens were transported alive to the Ichthyology Laboratory of Universidade Tecnológica Federal do Paraná, Paraná (UTFPR), Santa Helena campus, and kept in aquariums at room temperature. The deposit numbers on Databank are in the supplementary material (Tab. S1).
Cytogenetic analysis. Mitotic chromosomes were obtained from anterior kidney cells (Foresti et al., 1993) and silver nitrate impregnation was performed following the protocol by Howell, Black (1980). Chromosomal classification was carried out according to Levan et al. (1964). The location of 5S and 18S rDNA cistrons was revealed by double Fluorescent in situ Hybridization (Double-FISH) according to Pinkel et al. (1986) with modifications suggested by Margarido, Moreira-Filho (2008). Probe from Prochilodus argenteus Spix & Agassiz, 1829 obtained by Hatanaka, Galetti Jr. (2004) were used for the detection of 18S rDNA and probe from Megaleporinus elongatus Valenciennes, 1850 obtained by Martins, Galetti Jr. (1999) were used for the detection of 5S rDNA sites. 18S rDNA probe was labeled with biotin-16-dUTP by Nick Translation technique according to the manufacturer (Biotin Nick Translation Kit – Sigma-Aldrich®). 5S rDNA probe was labeled with digoxigenin-11-dUTP by Nick Translation according to the manufacturer (Dig Nick Translation Kit – Sigma-Aldrich®). Metaphase chromosomes received a treatment with RNAse at 37°C and denatured in 0.05N / 2xSSC NaOH. The hybridization solution consisted of 6 μL of the 18S rDNA probe, 6 μL of the 5S rDNA probe, 6 μL of 20xSSC, 30 μL 50% formamide, and 12 μL dextran sulfate (10%) per slide. Hybridization occurred overnight at 37°C under high stringency conditions (77%). Avidin-FITC was used to detect 18S rDNA signal, which was amplified with biotinylated anti-avidin (conjugated biotin), and antidigoxygenin-rhodamine was used for 5S rDNA detection. Chromosomes were counterstained with a mixture of 200 μL of antifading plus 1 μL of 4’,6-diamidino-2-phenylindol (0.2 mg / mL DAPI). The slides were covered with coverslips and stored in a place protected from light.
DNA Barcoding analysis. DNA extraction from liver tissue preserved in 100% ethanol was performed using GenElute™ Mammalian DNA Miniprep Kit (Sigma-Aldrich®), according to the manufacturer’s recommendation, and with Phenol-Chloroform (1:1), following the method described by Bardakci, Skibinski (1994), with adaptations by Povh et al. (2005). Quantification of genomic DNA with NanoK atomic absorption spectrometry (KASVI®) and agarose gel (1%) using the molecular weight marker Low DNA Mass Ladder (Invitrogen™ Life Technologies). For the DNA amplification of the mitochondrial COI gene section of all collected specimens (22), we used primers FISHF1 (5 ‘TCA ACC AAC CAC AAA GAC ATT GGC AC 3’) and FISHR1 (5 ‘TAG ACT TCT GGG TGG CCA AAG AAT CA 3’) (Ward et al., 2005). This segment was amplified by PCR reaction containing 1X reaction buffer, 5 mM MgCl2, 0.1 mM dNTP Mix, 0.1 mM of each primer, 100 ng of sample DNA, 0.25 U of Taq Polymerase and completed with H2O Mili-Q, total of 12.5 µL per reaction. PCR conditions were: 94°C (2 min), 35 cycles at 94°C (30 sec), 52°C (40 sec) and 72°C (1 min), followed by 72°C (10 min). The integrity of the PCR products and the approximate number of base pairs were analyzed on a 1.4% agarose gel using the Molecular Weight Marker 100bp (KASVI®). The sequencing was done using ABI 3730 DNA Analyzer (Applied Biosystems®), and the reactions with BigDye Terminator v3.1 Cycle Sequencing Kit.
The sequences were edited on Bioedit 5.0.9 (Hall, 1999) and aligned on ClustalW (Larkin et al., 2007). Genetic distances were estimated using Automatic Barcode Gap Discovery (ABGD; Puillandre et al., 2012) with the simple distance model. The evolutionary model was selected with MEGA-X v10.0.5 (Kumar et al., 2018). The divergence patterns, suggested by intra and intergroup distances, were graphically represented in bars using Maximum Parsimony dendrogram (Min-Mini Heuristic), Maximum-Likelihood dendrogram with Hasegawa Kishino-Yano with gamma distribution (HKY+G; Hasegawa et al., 1985), and UPGMA with p-distance model, all built with 1000 replicates on MEGA-X v10.0.5 (Kumar et al., 2018). To build the Bayesian Inference phylogenetic tree, sequences and commands were edited on PAUP* v4.0 (Swofford, 2002), the three was built on MrBayes v3.2.7(Ronquist et al., 2012) and edited on FigTree (Rambaut, 2018). We compared the species on Barcode of Life Data Systemv4 – BOLD SYSTEMS (Ratnasingham, Hebert, 2007) as a database. Haplotypes generated in DNAsp 5.10.01 were edited on Network 10.2.0.0.
Additional sequences used in the present study were obtained from the BOLD Systemv4. We used the genus and the Paraná River basin as delimitations for the sequences search and selecting only A. bimaculatus group representants. Eighty A. lacustris sequences and two A. bimaculatus sequences were obtained from the Databank. Outgroup was formed with two A. cf. fasciatus (Cuvier, 1819) and two A. scabripinnis (Jenyns, 1842) COI sequences (Tab. S2). The locations of all sequences were represented on a map (Fig. 1). The 82 sequences obtained with the delimitation represent the total publicly available data on the database so far.

FIGURE 1| Sampling sites of the specimens (in detail). Remaining points correspond to the sequences from BOLD System. Symbols represent the haplogroups recovered here. Haplogroup 1 represent specimens of Astyanax lacustris and one A. bimaculatus (highlighted with an asterisk*). Haplogroup 2 has only A. lacustris specimens. Haplogroup 3 indicates only one A. bimaculatus specimen. Outgroup is represented by A. scabripinnis and A. cf. fasciatus. VR = Vila Rica, SS = Sub-Sede, CA = Esquina Céu Azul, SG = São Gabriel.
For easier comprehension of the A. bimaculatus group, the species will be referred bellow as they were cited in the original papers, with quotation marks if the species was synonymized. Example: “A. altiparanae”, “A. jacuhiensis” Cope, 1894, and “A. asuncionensis” are currently valid as A. lacustris.
Results
Classic cytogenetic and fluorescence in situ hybridization. The diploid number (2n) found in the samples of the A. lacustris analyzed in this study was 2n = 50 chromosomes, without any differences in their karyotype formulas (10m+24sm+6st+10a, FN = 90) (Fig. 2). Silver nitrate impregnation revealed simple NORs located on the short arm of the subtelocentric pair 21 of all populations (Fig. 2 – in box).
FISH using 5S and 18S rDNA probes revealed polymorphism with more than one carrier chromosome pair per gene, which generated 13 cytotypes (labeled here as C1 to C13) and no correlation with the sampling sites. 5S rDNA probes marked the centromere region of metacentric pair 2 for all A. bimaculatus complexpopulations, and in two individuals, both from Sub-Sede population, an extra site was found in the centromere region on just one chromosome of the acrocentric pair 25 (C2 and C6). Eight pairs with 18S rDNA sites were found (pairs 1, 2, 6, 9, 10, 21, 22 and 23), with variation in the number of chromosomes that carry the gene per individual.
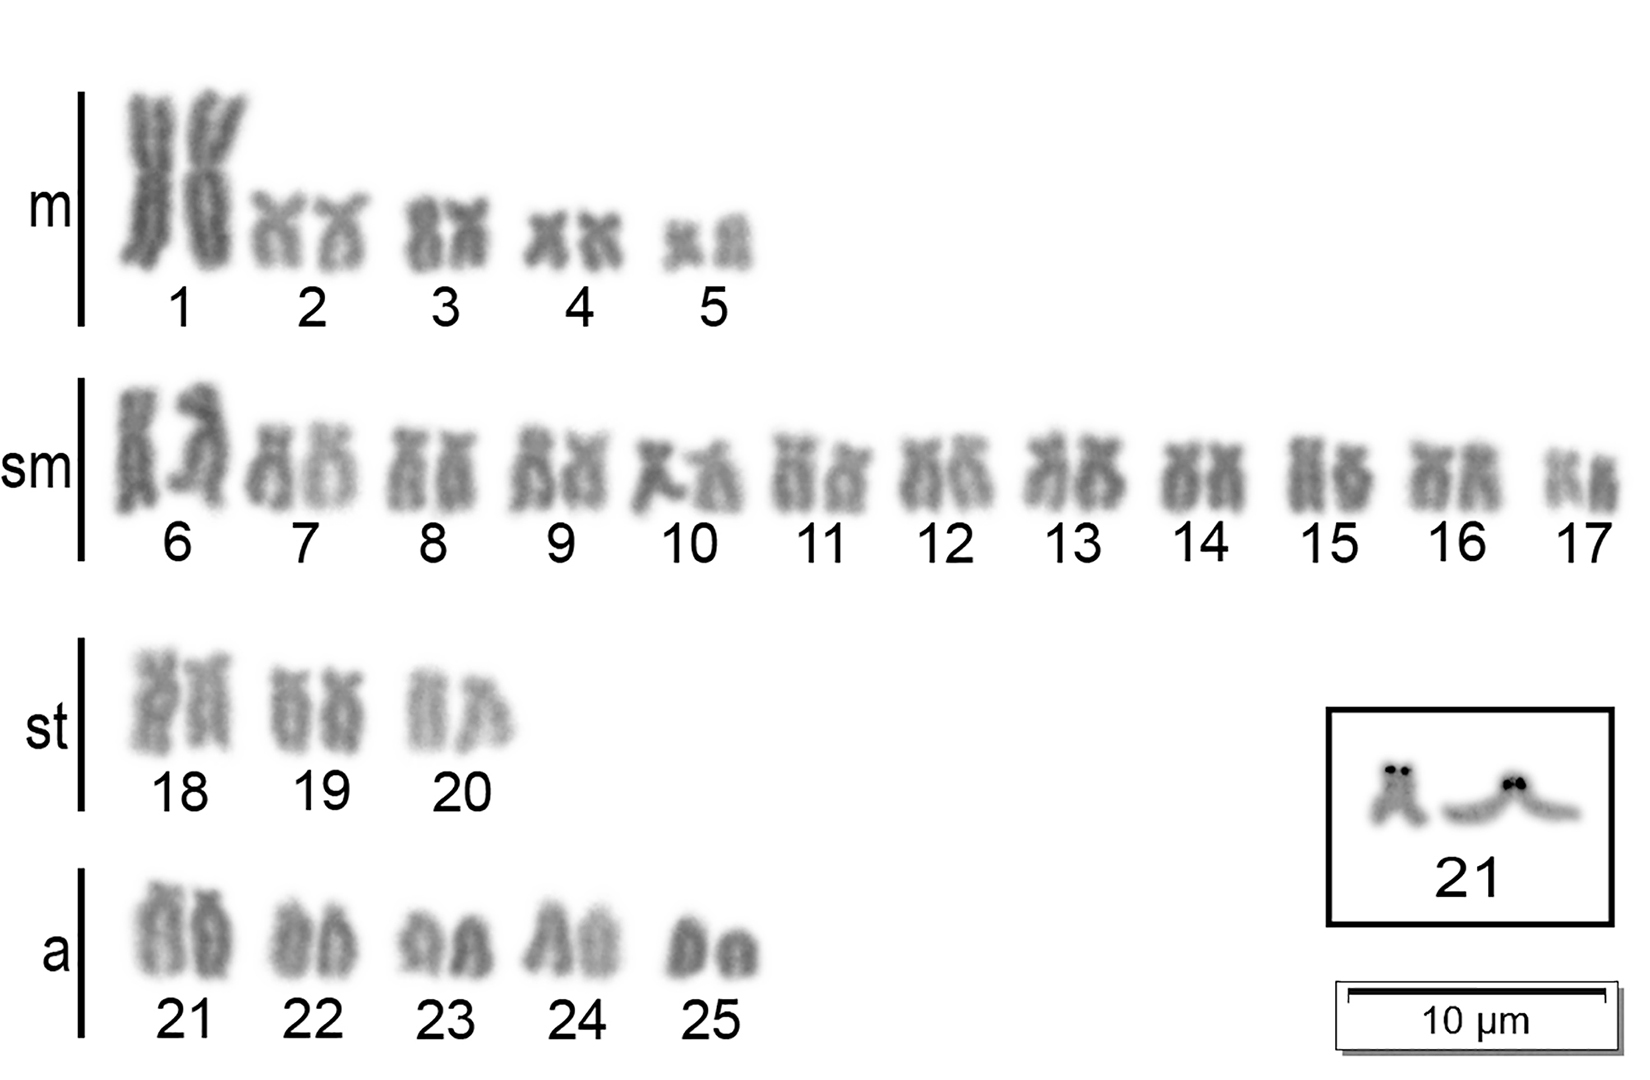
FIGURE 2| Karyotypes of Astyanax lacustris from the Sub-Sede population representing all populations analyzed in this paper. Metaphase in Giemsa with Ag-NORs in boxes.
Only the acrocentric pair 21 was equally marked among the 22 specimens analyzed from the four populations. Among the other seven pairs carrying the 18S rDNA, it was possible to detect signals on the two chromosomes of the pair only for the pairs 9 and 22. Therefore, for pairs 1, 6, 10, and 23, only one chromosome of the pair carried the 18S rDNA sequences (Fig. 3).
Additionally, synteny of 5S and 18S rDNA sites was found in only one individual (C1 cytotype, pair 2), in which the 18S rDNA sites was found on the long arm of the chromosome and the 5S in the centromeric region. Both C8 and C13 cytotypes have four specimens in each, making them the most frequent cytotypes in the sample. The other cytotypes have three (C5), two (C9) or one (C1-C4, C6, C7, C10-C12) specimens. The sampled individuals did not show any sex pattern for dispersion of 18S rDNAs sites.
DNA Barcoding data. In the present study, the DNA sequencing generated twenty-two COI fragments, of which four specimens were from the population “Vila Rica” and eighteen from “Sub-Sede”, “São Gabriel” and “Céu Azul”, six of each population. The BLAST of 22 sequences with about 650 bp revealed high similarity (about 99.8%) with A. lacustris and A. bimaculatus. All sequences of the specimens had good quality and were used to generate the alignment with 82 sequences from Barcode Database (BOLD System) belonging to the A. bimaculatus group, resulting in 104 sequences of 500bp (Nucleotide average diversity: 0.0161636; f(A) = 0.243; f(T) = 0.327; f(C) = 0.262; f(G) = 0.167). From these sequences, 33 haplotypes (Haplotypic diversity: Hd = 0.9050) were generated with 66 variable sites and 434 invariable ones (Fig. 4B).

FIGURE 3| Cytotypes found in Astyanax lacustris submitted to Fluorescence in situ Hybridization (FISH) with 5S (red) and 18S rDNA (green) probes. Columns represent the chromosome pair of the karyotype and lines represent the 13 cytotypes. The first column shows the first metacentric chromosome pair of the karyotype for proportion comparison.
Considering each population as different groups, the intragroup variation of each ranged from approximately 0.18% to 0.81%; and the intergroup divergence ranged from 0.23% to 0.74%. We also performed an intragroup calculation that joined all populations in one and revealed 0.47% (Tab. 1). Integrating the additional sequences from Barcode Database (BOLD System), the distances calculated in ABGD revealed the existence of three haplogroups: Haplogroup 1, composed by all individuals collected for this study, 1 exemplar of A. bimaculatus and 53 exemplars of A. lacustris from the database; Haplogroup 2, formed by 27 exemplars of A. lacustris from the database; and Haplogroup 3, which consists only of a single individual of A. bimaculatus from the database (Fig. 5).
The Maximum Parsimony dendrogram is congruent with the Bayesian Inference phylogeny (Fig. 4A – in bars). The haplotypes belong to three haplogroups with a higher number of evolution steps among the haplogroups and lower intragroup distance (Fig. 4B). It is important to note that the haplotype 24 (CAPV685_17Astyanax – A. lacustris) is between haplogroups 1 and 2, with 5 evolutionary steps away from the Haplogroup 2 and 12 from the rest of Haplogroup 1 haplotypes. The ABGD and UPGMA dispose CAPV685_17Astyanax as part of the Haplogroup 2, and in HKY+G it formed another haplogroup between haplogroup 1 and 2, while Bayesian Inference and Maximum Parsimony joined it in Haplogroup 1 (Fig. 4A).
TABLE 1 | Distances within (in boxes) and between populations Astyanax lacustris: and between Astyanax lacustris populations. Labels: VR = Vila Rica, SS = Sub-Sede, CA = Esquina Céu Azul, SG = São Gabriel.
[1] | [2] | [3] | [4] | [5] | [6] | [7] | [8] | [9] | [10] | [11] | |
[1] Outgroup | – | ||||||||||
[2] VR | 0.15200 | 0.00233 | |||||||||
[3] SS | 0.15050 | 0.00220 | 0.00186 | ||||||||
[4] CA | 0.15017 | 0.00375 | 0.00345 | 0.00393 | |||||||
[5] SG | 0.15067 | 0.00594 | 0.00560 | 0.00749 | 0.00817 | ||||||
[6] VR+SS+CA+SG | 0.15073 | – | – | – | – | 0.00478 | |||||
[7] Haplogroup 1 | 0.15031 | – | – | – | – | – | 0.00394 | ||||
[8] Haplogroup 2 | 0.14017 | – | – | – | – | – | 0.03125 | 0.00648 | |||
[9] Haplogroup 3 | 0.14350 | – | – | – | – | – | 0.08829 | 0.08207 | n/c | ||
[10] Haplogroup 1+2 | 0.14765 | – | – | – | – | – | – | – | 0.08666 | 0.01478 | |
[11] Haplogroup 1+2+3 | 0.14761 | – | – | – | – | – | – | – | – | – | 0.01616 |
The Haplogroup 1 showed intragroup variation of 0.39%, Haplogroup 2 of 0.64%, and it was impossible to calculate it for the Haplogroup 3 because it had only one individual. Additionally, we performed the intragroup variation of haplogroups 1 and 2 together (1.47%) and joining haplogroups 1, 2 and 3 (1.61%). Regarding the distances between the haplogroups: (1) Haplogroup 1 x Haplogroup 2 had a 3.13% distance; Haplogroup 3 presented values slightly above 8% for Haplogroup 2 and almost 9% for Haplogroup 1. All the distances are displayed in the Tab. 1.
Discussion
Chromosomal diversity in the A. bimaculatus species complex with emphasis on the Paraná River basin. Both valid Astyanax species that occur in the Paraná River basin, A. lacustris and A. abramis, have 2n = 50 (Pazza et al., 2007; Kavalco et al., 2011; Gavazzoni et al., 2018), like observed for all the individuals studied in this work. 2n = 50 is commonly found in Astyanax (e.g., Fernandes, Martins-Santos, 2006; Domingues et al., 2007; Oliveira et al., 2009; Hashimoto et al., 2011), probably the ancestral diploid number in the genus (Kavalco et al., 2009). The specimens analyzed here have no karyotype formula variation (10m+24sm+6st+10a, FN = 90), but karyotype analyses of “A. altiparanae” (6m+28sm+4st+12a, FN = 88 / 8m+28sm+8st+6a, FN = 94), A. lacustris (6m+10sm+18st+16a, NF = 84),“A. asuncionensis” (8m+24sm+6st+12a, FN = 88), and A. abramis (4m+30sm+8st+8a, FN = 92 / 8m+10sm+26st+6a, NF = 94) suggested such variation (Paiz et al., 2015; Piscor et al., 2015; Gavazzoni et al., 2018; Teixeira et al., 2018). The presented data show that variations in the karyotype formulas can distinguish populations. A simple comparison of karyotype formulas allows to verify differences among the species of the A. bimaculatus complex from the Paraná River basin. Such differences can generate two interpretations: either (1) these data indicate cryptic diversity in the group; or (2) incongruities generated by the assembly of karyotypes by different authors could not represent the real diversity of the group. Both explanations are valid, recurrent in the literature and are applied to studies in different groups of fish (e.g., Oliveira et al., 2009; Neto et al., 2011; De Carvalho, Dias, 2005; Santos et al., 2021).

FIGURE 4| A. Bayesian Inference Phylogeny; B. Haplotype data. A. Bars on the right hand side represent the Automatic Barcode Gap Discovery (ABGD), Unweighted Pair Group Method using Arithmetic averages (UPGMA), dendrogram using the Hasegawa Kishino-Yano model with gama distribution (HKY+G) and Maximum Parsimony, respectively. B. The haplotype data show the Astyanax haplogroups 1 (in green), 2 (in blue) and 3 (in orange). Haplotypes (H) 2, 3, 4, 5, 7 and 8 (in bold with an asterisk) indicate the position of one or more individuals of this study. The black slices on the haplotypes represent slightly different individuals that do not arrange another haplotype.
The cryptic diversity revealed by cytogenetics shows that the synonymization of “A. altiparanae” and “A. asuncionensis” to A. lacustris does not represent the real diversity of the complex, thus the diversity can be underestimated, or even overestimated, since the volume of populations studied is large, covering most of the hydrographic basins of the area, i.e., the Paraná River stretch above the confluence with the Paraguay River (Iguaçu, Ivaí, Piquiri, Paranapanema, Tibagi, Tietê, Grande, and Paranaíba rivers). It clearly demonstrates how valuable the database is for this group and, simultaneously, the enormous challenge that involves unraveling it.
Silver nitrate impregnation is sometimes considered as a possible species-specific marker in Astyanax (Da Silva et al., 2016), it commonly shows simple and multiple NORs in several species of the A. bimaculatus complex (Almeida-Toledo et al., 2002; Fernandes, Martins-Santos, 2004; Kavalco et al., 2011; Pacheco et al., 2011; Peres et al., 2012; Paiz et al., 2015; Gavazzoni et al., 2018). “Astyanax altiparanae” from the Paraná River basin also presents variations in the number and location of the Ag-NOR sites, presenting from 1 to 10 marks (Ferreira-Neto et al., 2009; Da Silva et al., 2016), almost all of them were confirmed by FISH with 18S rDNA probe.
The most common 18S rDNA configuration pattern in the A. bimaculatus species complex, as presented here in the Cytotype 13 (Fig. 3), seems to be sites in the terminal region of the short arm of a subtelocentric/acrocentric pair (Kavalco et al., 2011; Peres et al., 2012; Piscor et al., 2015; Cunha et al., 2018; Gavazzoni et al., 2018). Similar patterns to the other 12 cytotypes found here are mostly nonexistent in the literature. Some 18S rDNA sites detected here were previously found in the A. bimaculatus species complex, such as the first metacentric pair, on the long arm of submetacentric chromosomes found in “A. altiparanae”, and on the short arm of only one submetacentric chromosome as described in “A. altiparanae”and A. aff. bimaculatus (Ferreira-Neto et al., 2009; Kavalco et al., 2011).
Traditionally, the high variability of the 18S rDNA has enabled several authors to highlight this marker as promising for distinguishing some Astyanax species or populations (Fernandes, Martins-Santos, 2006; Pacheco et al., 2011; Piscor et al., 2015). The integrative utilization of Ag-NORs with rDNA 18S cistrons can sometimes show more sites than by silver impregnation alone, as in “A. altiparanae” (Fernandes, Martins-Santos, 2006). The high level of variations, commonly found for 18S rDNA (e.g.,Fernandes, Martins-Santos, 2006; Ferreira-Neto et al., 2009), reinforces the hypothesis that it was possibly originated by translocation or association with jumping genes (Martins et al., 2011) and shows that this marker should be interpreted carefully in the species complex analyzes. Furthermore, considering the high levels of the 18S rDNA variations found in the group, the identification of these ribosomal sites only with Ag-NORs, without an association with FISH, is not advisable. Also, as the 18S rDNA variations are probably due to the association of this gene with transposable elements (Vicari et al., 2008a) or even pseudogenes, this might not be a good marker to distinguish Astyanax species.
Simple 5S rDNA cistrons located in the pericentromeric region of metacentric/submetacentric chromosomes seem to be conserved and it is probably a synapomorphy of Astyanax (Vicari et al., 2008b). This trait has been verified in A. lacustris (Fernandes, Martins-Santos, 2006; Peres et al., 2008; Kavalco et al., 2011; Teixeira et al., 2018; Goes et al., 2020) and in this study. However, multiple cistrons are described for “A. altiparanae”, “A. asuncionensis”, “A. jacuhiensis”, A. aff. bimaculatus, and other species that belong to the A. bimaculatus species complex (Tenório et al., 2013; Paiz et al., 2015; Piscor et al., 2015; Gavazzoni et al., 2018; Teixeira et al., 2018). Astyanax lacustris and A. abramis are the only valid representatives of A. bimaculatus species complex for the area of this study and show variations in the number of 5S rDNA sites (Tenório et al., 2013; Teixeira et al., 2018). The conservation of 5S rDNA could be due to the interstitial distribution of this gene (Martins, Galetti Jr., 2001). Once it shows pericentromeric sites, the transference of these sequences to other regions becomes harder in comparison to the 45S rDNA sequences (Piscor et al., 2015). On the other hand, 18S rDNA is commonly found near to the telomeric chromosomal region, therefore its transference could be facilitated (Fernandes, Martins-Santos, 2006), which explains the large intraspecific and interspecific divergence of 18S rDNA locations in Astyanax (Piscor et al., 2015).
Many studies show that A. lacustris presents only one conserved pair bearing 5S sites (e.g., Almeida-Toledo et al., 2002; Kavalco et al., 2011; Gavazzoni et al., 2018). As we have found another chromosome bearing a 5S rDNA site in the terminal region of the short arm of a single acrocentric (C2 and C6; Fig. 3), its existence could be a polymorphism occurring in a lower frequency in the populations. This data shows that this might be a useful cytotaxonomic marker (as proposed by Gavazzoni et al., 2018), but apparently it seems to be insufficient in the studied area (Paraná River basin stretch above the confluence with the Paraguay River), which could be either related to (1) the confluence of different Astyanax lineages due the inundation of Sete Quedas, or (2) even due to the existence of fish farms near Itaipu Lake, making it difficult to differentiate the species by these chromosomal markers.
Another interesting point here is the synteny of 5S and 18S rDNA sites found in only one individual (C1, pair 2; Fig. 3) without previous records in the literature. The translocation events of 18S rDNA genes could explain the existence of a single site co-located with the 5S rDNA.
Molecular diversity by DNA Barcode. The intragroup variation of the populations does not indicate the existence of cryptic diversity in the sample collected in this study. This was strongly supported by the interspecific distances that did not show barcode-gaps, very similarly to the intra-group variation data (Tab. 1). The interspecific divergence between Haplogroup 1 (in which our samples grouped) and 2 was approximately 7x higher than the intragroup variation, these values were able to generate a barcoding gap (Fig. 5). Although the necessary gap to separate species proposed by Hebert et al. (2004) was about 10x the mean intraspecific variation, if one species diverges 2% or more from another, there is a 95% (probably more) chance to represent a different species (Ward, 2009). In “A. altiparanae” populations, cytogenetics literature data strongly suggests that it is indeed a species complex, a 2.6% divergence among the populations (lower than we have found between haplogroups 1 and 2) allowed the authors to infer about the possibility that the populations are candidates for new species based on the high interspecific distances (Pereira et al., 2013). Thus, it is likely that haplogroups 1 and 2 in this study comprise different MOTUs (Molecular Operational Taxonomic Units), which are currently sympatric populations along this stretch of the Paraná River basin.

FIGURE 5| Barcoding Gap. Histogram generated in the ABGD showing the intraspecific variation and interspecific divergence of haplogroups 1 (green), 2 (blue) and 3 (orange).
Cunha et al. (2019) were the first to integrate cytogenetics (conventional staining, C-Banding, Ag-NOR, 5S and 18S rDNA probes) and molecular markers (S72, RAG2, and COI) to study the A. bimaculatus species complex populations from the coastal basins. They found results similar to ours: no variations presented by cytogenetic methods, while three haplogroups were revealed by COI. The distance calculations done by Cunha et al. (2019) were sufficient to infer the existence of cryptic diversity in the coastal basins. The distances were similar to what was found between our haplogroups 1 and 2, it reinforces the possibility that they are two distinct species.
Most haplotypes of the Haplogroup 2 presented a distance from one to four evolutionary steps from the other haplotypes of the group. Differently, the haplotype 24, located between the haplogroups 1 and 2, has five evolutionary steps from the Haplogroup 2 and twelve from the Haplogroup 1 (Fig. 4B). The ABGD and UPGMA tests grouped the haplotype 24 into Haplogroup 2, the Maximum Likelihood analysis (HKY+G) revealed this individual as a distinct haplogroup, and the Maximum Parsimony and Bayesian Inference tests grouped it into Haplogroup 1 (Fig. 4A). The sequence of haplotype 24 might have a low-quality, but we could not find its electropherogram to test this hypothesis. This type of incongruence generates different interpretations due to these methods, demonstrates the complexity of the group and the difficulty of working with them.
It is important to note that the haplotype 1 (Haplogroup 3) was thirty-eight evolutionary steps distant from the nearest haplotype (haplotype 21 – Haplogroup 2) in the haplotype network (Fig. 4B) and presented distance data of about 9% and 8% from the haplogroups 1 and 2, respectively (Tab. 1). Two hypotheses arise from this situation: either (a) the specimen of the Haplogroup 3 is a misidentification in the databank, or (b) the cryptic diversity of A. lacustris from the Paraná River basin is greater than that represented in Haplogroups 1 and 2. Nevertheless, due to the sampling deficit (only one specimen) and the distance values of the Haplogroup 3 from the others (more than eight percent), it is parsimonious to conclude that the first hypothesis is more viable. Despite the possibility of a low-quality sequence and a possible misidentification present in our analysis, we used all sequences available in the databank for the Paraná River basin, so we do not rule any of them out.
There are a few cases of misidentification by DNA Barcode compared to the high efficiency of this gene, and it is usually assigned due to the similar morphological traits in closely related species, as cryptic species. This fact makes it difficult to correct identify samples and they reach the database with an imprecise diagnosis. The usage of phylogenetic analyses is extremely relevant in cases where there is a considerable overlap of the morphological characters used to distinguish the species of the A. bimaculatus group, and some of them were identified mostly based on its collection site rather than the morphological data (Cunha et al., 2018).
Tool integration and a possible explanation for the A. lacustris diversity in the Paraná River basin related to spatial distribution. Nowadays, the delimitation between the Upper and Lower Paraná River basins is debatable due to their historic barriers of the Sete Quedas Falls and the Itaipu Dam. Some authors consider the natural barrier for the fish dispersion, where the Paraná Basin was divided into five different ecoregions: the Lower Paraná and Iguassu ecoregions was considered the area below the flooded Sete Quedas, and the High Paraná, divided into Floodplain, Piquiri, Ivaí and Paranapanema sub-ecoregions located above it (Abell et al., 2008; Reis et al., 2020). After the submersion of the Sete Quedas Falls by the construction of the Itaipu Dam and thus formation of the reservoir, some other authors started to consider the Hydroelectric Power Plant as the border between the sub-basins. Therefore, the Upper Paraná River contemplates the area above the Itaipu Dam, 150 km downstream from the flooded Sete Quedas (e.g., Ota et al., 2018).
In this study, considering Sete Quedas as the geographical division, DNA Barcoding shows the possible existence of two A. lacustris groups: Haplogroup 2 from the Upper Paraná region, and Haplogroup 1 from the Lower Paraná region (Fig. 1). When these two Haplogroups are plotted onto the map, their distributions revealed that: (a) downstream from Sete Quedas there are only Haplogroup 1 specimens; (b) specimens of Haplogroup 1 are only downstream from Sete Quedas (note that there are samples from Iguaçu River basin); (c) specimens from haplogroups 1 (15 localities, 51 specimens) and 2 (13 localities, 27 specimens) are upstream from Sete Quedas. The entire upstream region from the Sete Quedas Falls has a large set of hydroelectric power plants (HPP), many of them have closed before Itaipu, others after, and some even have some system of species transposition from downstream to upstream of the HPP (Júlio Jr. et al., 2009). These dams can limit the free dispersal of fish. However, this species is very commonly farmed to be used as live bait by professional and amateur fishermen, and it is also very commonly transported from one place to another for several kilometers. There are no specimens of the Haplogroup 2 downstream from the Sete Quedas, and both Haplogroups are present upstream.
Considering the aforementioned, we can assume that the two haplogroups currently assigned as A. lacustris in the Paraná River basin were distributed upstream from the falls, but the Haplogroup 1 was also downstream from them. The Iguaçu River flows into the Lower Paraná River and has the Iguaçu Falls, another large barrier located near its mouth, which confers a high degree of endemism to its ichthyofauna. The presence of the Haplogroup 1 in the Iguaçu River indicates that the origin of that haplogroup must predate the rise of this barrier. After the construction of the Itaipu Dam there was probably a greater colonization by the Haplogroup 1 towards the upper Paraná basin, either by dispersal after the geographic barrier has been submerged, or by transposition by fishermen.
Despite the chromosomal diversity, the genetic distances between the collected populations for this research reveal no cryptic diversity. Allying our data with samples from other stretches of the Paraná River basin, DNA barcode pointed towards the possible existence of two distinct lineages currently assigned as A. lacustris, which also diverge from the proposed synonymizations and from the diversity revealed by chromosomal analysis. The cryptic diversity, often revealed only by cytogenetic markers (karyotype formula, NORs, 5S and 18S rDNA) to define the A. bimaculatus species complex may not represent the real taxonomic situation of the group.
We have tried to track the cytotypes diversity through the haplotypes, but different cytotypes were grouped into the same haplotype, also since identical cytotypes were found in different haplotypes, it is impossible to create such correlation. DNA barcoding suggests that the high variation in the rDNA sites presented here could represent a high polymorphism degree in A. lacustris, since all individuals analyzed chromosomally were grouped together in Haplogroup 1. Additionally, speciation could be too fast to be detected by this mitochondrial gene, raising doubts about its precise distinction in species complexes.
This is the first study to integrate chromosomal and molecular markers with all the genetic samples of the A. bimaculatus species complex available in Barcode of Life Data Systems in the area of the Paraná River basin. Whereas DNA Barcode has shown to be promising, even in a small area of study, a suitable way to elucidate the taxonomic problems involving species complexes would be to use cytogenetics and molecular markers in an integrative manner. Apparently, the use of chromosomal or molecular (Barcode DNA) markers in isolation does not seem to be enough to unravel this cryptic diversity because one or another alone point to different directions, making it difficult to understand the species complexes.
Considering that the attempt to relate the geographic location of the populations studied through cytogenetics and DNA barcode from a database could not bring news about the diversity of the group, a final question remains, could COI sequences be obtained from specimens that have been previously analyzed by cytogenetics? This would help expand the COI database without requiring new collections, making it possible to test the Haplogroups detected by this study in this stretch of the Paraná River basin correlating to previous chromosomal data. As mentioned earlier, we understand that the integration of these genetic tools has a high resolute potential, therefore, we suggest that further studies should be conducted with this integrative approach. Furthermore, only the analysis of the external morphology of individuals integrated with cytogenetic and molecular markers can elucidate the diversity in the A. bimaculatus species complex and clarify the synonymization of this group in the basin. Moreover, Lucena, Soares (2016) proposed that the synonymization of “A. altiparanae”and “A. asuncionensis” to A. lacustris does not configure the best arrangement on the real diversity of this complex in the Paraná River basin. It is likely that from new data arrangements, as we propose, further revisions based on the integration of morphological, cytogenetics and molecular data can revalidate taxa or even allow to describe new taxa for this species complex in the basin.
Acknowledgments
We are grateful to Instituto Chico Mendes de Conservação da Biodiversidade (ICMBio – Permit number 38532) for authorizing the collection of the specimens. This study was funded by Conselho Nacional de Desenvolvimento Científico e Tecnológico (CNPq – Process number 402343/2016–6), Coordenação de Aperfeiçoamento de Pessoal de Nível Superior (CAPES), Fundação Araucária de Apoio ao Desenvolvimento Científico e Tecnológico do Estado do Paraná (FA), and Universidade Tecnológica Federal do Paraná (UTFPR).
References
Abell R, Thieme ML, Revenga C, Bryer M, Kottelat M, Bogutskaya N, Coad B, Mandrak N, Balderas SL, Bussing W, Stiassny MLJ, Skelton P, Allen GR, Unmack P, Naseka A, Ng R, Sindorf N, Robertson J, Armijo E, Higgins JY, Heibel TJ, Wikramanayake E, Olson D, López HL, Reis RE, Lundberg JG, Pérez MHS, Petry R. Freshwater ecoregions of the world: a new map of biogeographic units for freshwater biodiversity conservation. Bioscience. 2008; 58(5):403–14. https://doi.org/10.1641/B580507
Almeida-Toledo LF, Ozouf-Costaz C, Foresti F, Bonillo C, Porto-Foresti F, Daniel-Silva MFZ. Conservation of the 5S-bearing chromosome pair and co-localization with major rDNA clusters in five species of Astyanax (Pisces, Characidae). Cytogenet Genome Res. 2002; 97(3–4):229–33. https://doi.org/10.1159/000066609
Bardakci F, Skibinski DOF. Genetical Society of Great Britain Application of the RAPD technique in tilapia fish: species and subspecies identification. Heredity. 1994; 73:117–23. https://doi.org/10.1038/hdy.1994.110
Bertaco VA, Garutti V. A new species of Astyanax (Characiformes: Characidae) from the upper rio Tapajós drainage, Central Brazil. Neotrop Ichthyol. 2007; 5(1):25–30. https://doi.org/10.1590/S1679-62252007000100003
De Carvalho RA, Dias AL. Cytogenetic characterization of B chromosomes in two populations of Iheringichthys labrosus (Pisces, Pimelodidae) from the Capivara Reservoir (Paraná, Brazil). Caryologia. 2005; 58(3):269–73. https://doi.org/10.1080/00087114.2005.10589462
Cunha MS, Fregonezi AR, Fava L, Hilsdorf AWS, Campos LAO, Dergam JA. Phylogeography and historical biogeography of the Astyanax bimaculatus Species Complex (Teleostei: Characidae) in Coastal Southeastern South America. Zebrafish. 2019; 16(1):115–27. https://doi.org/10.1089/zeb.2018.1668
Domingues MDS, Vicari MR, Abilhoa V, Wamser JP, Cestari MM, Bertollo LAC, De Almeida MC, Artoni RF. Cytogenetic and comparative morphology of two allopatric populations of Astyanax altiparanae Garutti & Britski, 2000 (Teleostei: Characidae) from upper rio Paraná basin. Neotrop Ichthyol. 2007; 5(1):37–44. https://doi.org/10.1590/s1679-62252007000100005
Fernandes CA, Martins-Santos IC. Cytogenetic studies in two populations of Astyanax altiparanae (Pisces, Characiformes). Hereditas. 2004;141(3):328–32. https://doi.org/10.1111/j.1601-5223.2004.01832.x
Fernandes CA, Martins-Santos IC. Mapping of the 18S and 5S ribosomal RNA genes in Astyanax altiparanae Garutti & Britski, 2000 (Teleostei, Characidae) from the upper Paraná river basin, Brazil. Genet Mol Biol. 2006; 29(3):464–68. https://doi.org/10.1590/S1415-47572006000300011
Ferreira-Neto M, Vicari MR, De Camargo EF, Artoni RF, Moreira-Filho O. Comparative cytogenetics among populations of Astyanax altiparanae (Characiformes, Characidae, Incertae sedis). Genet Mol Biol. 2009; 32(4):792–96. https://doi.org/10.1590/S1415-47572009005000078
Foresti F, Oliveira C, Almeida-Toledo LF. A method for chromosome preparations from large fish specimens using in vitro short-term treatment with colchicine. Experientia. 1993; 49(9):810–13. https://doi.org/10.1007/BF01923555
Fricke R, Eschmeyer WN, Van der Laan R. Eschmeyer’s catalog of fishes: genera, species, references [Internet]. San Francisco: California Academy of Science. 2021. http://researcharchive.calacademy.org/research/ichthyology/catalog/fishcatmain.asp
Gavazzoni M, Paiz LM, Oliveira CAM, Pavanelli CS, Graça WJ, Margarido VP. Morphologically cryptic species of the Astyanax bimaculatus “caudal peduncle spot” subgroup diagnosed through cytogenetic characters. Zebrafish. 2018; 15(4):382–88. https://doi.org/10.1089/zeb.2018.1574
Garutti V, Britski H. Descrição de uma nova espécie de Astyanax (Teleostei, Characidae) com mancha umeral horizontalmente ovalada, da bacia do Rio Guaporé, Amazônia. Pap Avulsos Zool. 1997; 40(14):217–29.
Garutti V. Descrição de uma nova espécie de Astyanax (Teleostei, Characidae) da bacia do Tocantins, Brasil. Iheringia, Sér Zool. 1998; 85:115–22. Available from: https://ia800208.us.archive.org/1/items/biostor-80093/biostor-80093.pdf
Garutti, V. Descrição de Astyanax argyrimarginatus sp.n. (Characiformes, Characidae) procedente da bacia do rio Araguaia, Brasil. Rev Bras Biol. 1999; 59(4):585–91. https://doi.org/10.1590/S0034-71081999000400008
Garutti V, Langeani F. Redescription of Astyanax goyacensis Eigenmann, 1908 (Ostariophysi: Characiformes: Characidae). Neotrop Ichthyol. 2009; 7(3):371–76. https://doi.org/10.1590/S1679-62252009000300003
Goes CAG, Daniel SN, Piva LH, Yasui GS, Artoni RF, Hashimoto DT, Foresti F, Porto-Foresti F. Cytogenetic markers as a tool for characterization of hybrids of Astyanax Baird & Girard, 1854 and Hyphessobrycon Eigenmann, 1907. Comp Cytogenet. 2020; 14(2):231–42. https://doi.org/10.3897/compcytogen.v14i2.49513
Hall TA. BioEdit: a user-friendly biological sequence alignment editor and analysis program for Windows 95/98/NT. Nucleic acids Symp Ser. 1999; 41:95–98
Hasegawa M, Kishino H, Yano T. Dating of the human-ape splitting by a molecular clock of mitochondrial DNA. J Mol Evol. 1985; 22:160–74. https://doi.org/10.1007/BF02101694
Hashimoto DT, Ferguson-Smith MA, Rens W, Foresti F, Porto-Foresti F. Chromosome mapping of H1 histone and 5S rRNA gene clusters in three species of Astyanax (Teleostei, Characiformes). Cytogenet Genome Res. 2011; 134(1):64–71. https://doi.org/10.1159/000323512
Hatanaka T, Galetti Jr. PM. Mapping of the 18S and 5S ribosomal RNA genes in the fish Prochilodus. Genetica. 2004; 122:239–44. https://doi.org/doi: 10.1007/s10709-004-2039-y
Hebert PDN, Cywinska A, Ball SL, DeWaard JR. Biological identifications through DNA barcodes. Proc R Soc B Biol Sci. 2003; 270)1512):313–21. https://doi.org/10.1098/rspb.2002.2218
Hebert PDN, Stoeckle MY, Zemlak TS, Francis CM. Identification of birds through DNA barcodes. PLoS ONE. 2004; 2(10):e312. https://doi.org/10.1371/journal.pbio.0020312
Howell WM, Black DA. Controlled silver-staining of nucleolus organizer regions with a protective colloidal developer: a 1-step method. Experientia. 1980; 36(8):1014–15. https://doi.org/10.1007/BF01953855
Júlio Jr. HF, Dei Tós C, Agostinho AA, Pavanelli CS. A massive invasion of fish species after eliminating a natural barrier in the upper rio Paraná basin. Neotrop Ichthyol. 2009; 7(4):709-18. https://doi.org/10.1590/S1679-62252009000400021
Kavalco KF, Brandão KO, Pazza R, Almeida-Toledo LF. Astyanax hastatus Myers, 1928 (Teleostei, Characidae): A new species complex within the genus Astyanax? Genet Mol Biol. 2009; 32(3):477–83. https://doi.org/10.1590/S1415-47572009005000055
Kavalco KF, Pazza R, Brandão KDO, Garcia C, Almeida-Toledo LF. Comparative cytogenetics and molecular phylogeography in the group Astyanax altiparanae – Astyanax aff . bimaculatus (Teleostei , Characidae). Cytogenet Genome Res. 2011; 134:108–19. https://doi.org/10.1159/000325539
Kumar S, Stecher G, Li M, Knyaz C, Tamura K. MEGA X: Molecular Evolutionary Genetics Analysis across computing platforms. Mol Biol Evol. 2018; 35(6):1547–49. https://doi.org/10.1093/molbev/msy096
Larkin MA, Blackshields G, Brown NP, Chenna R, Mcgettigan PA, Mcwilliam H, Valentin F, Wallace IM, Wilm A, Lopez R, Thompson JD, Gibson TJ, Higgins DG. Clustal W and Clustal X version 2.0. Bioinformatics. 2007; 23(21):2947–48. https://doi.org/10.1093/bioinformatics/btm404
Levan A, Fredga K, Sandberg AA. Nomenclature for centromeric position on chromosomes. Institute of Genetics. Hereditas.1964; 52(2):201–20. Available from: https://onlinelibrary.wiley.com/doi/pdf/10.1111/j.1601-5223.1964.tb01953.x
Lucena CAS, Soares HG. Review of species of the Astyanax bimaculatus “caudal peduncle spot” subgroup sensu Garutti & Langeani (Characiformes, Characidae) from the rio la Plata and rio São Francisco drainages and coastal systems of southern Brazil and Uruguay. Zootaxa. 2016; 4072(1):101–25. https://doi.org/10.11646/zootaxa.4072.1.5
Margarido VP, Moreira-Filho O. Karyotypic differentiation through chromosome fusion and number reduction in Imparfinis hollandi (Ostariophysi, Heptapteridae). Genet Mol Biol. 2008; 31(1):235–38. https://doi.org/https://doi.org/10.1590/S1415-47572008000200012
Martins C, Galetti JM. Two 5S rDNA arrays in Neotropical fish species: is it a general rule for fishes? Genetica. 2001; 111(1–3):439–46. https://doi.org/10.1023/A:1013799516717
Martins C, Cabral-de-Mello DC, Valente GT, Mazzuchelli J, Oliveira SG, Pinhal D. Animal genomes under the focus of cytogenetics. (Issue October 2017). 2011. Available from: https://repositorio.unesp.br/handle/11449/232201
Martins C, Galetti Jr., PM. Chromosomal localization of 5S rDNA genes in Leporinus fish (Anostomidae, Characiformes). Chromosome Res. 1999; 7:363–67. https://doi.org/10.1023/A:1009216030316
Melo BF, Benine RC, Silva GSC, Avelino GS, Oliveira C. Molecular phylogeny of the Neotropical fish genus Tetragonopterus (Teleostei: Characiformes: Characidae). Mol Phylogenet Evol. 2016; 94:709–17. https://doi.org/10.1016/j.ympev.2015.10.022
De Melo FAG. Revisão taxonômica das espécies do gênero Astyanax Baird & Girardi, 1854 (Teleostei: Characiformes: Characidae) da região da Serra dos Órgãos. Arq Mus Nac. 2001; 59:1–46. Available from: https://revistas.ufrj.br/index.php/amn/article/download/47811/25810
Mirande JM. Phylogeny of the family Characidae (Teleostei: Characiformes): From characters to taxonomy. Neotrop Ichthyol. 2010; 8(3):385–568. https://doi.org/10.1590/S1679-62252010000300001
Neto AM, Silva M, Matoso DA, Vicari MR, Almeida MC, Collares-Pereira MJ, Artoni RF. Karyotype variability in neotropical catfishes of the family Pimelodidae (Teleostei: Siluriformes). Neotrop Ichthyol. 2011; 9(1):97–105. https://doi.org/10.1590/S1679-62252011005000002
Oliveira C, Avelino GS, Abe KT, Mariguela TC, Benine RC, Ortí G, Vari RP, Corrêa e Castro RM. Phylogenetic relationships within the speciose family Characidae (Teleostei: Ostariophysi: Characiformes) based on multilocus analysis and extensive ingroup sampling. BMC Evol Biol. 2011; 11(275):1–25. https://doi.org/10.1186/1471-2148-11-275
Oliveira C, Foresti F, Hilsdorf AWS. Genetics of neotropical fish: From chromosomes to populations. Fish Physiol Biochem. 2009; 35(1):81–100. https://doi.org/10.1007/s10695-008-9250-1
Ota RR, Deprá GC, Graça WJ, Pavanelli CS. Peixes da planície de inundação do alto rio Paraná e áreas adjacentes: revised, annotated and updated. Neotrop Ichthyol. 2018; 16(2):1–111. https://doi.org/10.1590/1982-0224-20170094
Pacheco RB, Rosa R, Giuliano-Caetano L, Júlio HF, Dias AL. Cytogenetic comparison between two allopatric populations of Astyanax altiparanae Garutti et Britski, 2000 (Teleostei, Characidae), with emphasis on the localization of 18S and 5S rDNA. Comp. Cytogenet. 2011; 5(3):237–46. https://doi.org/10.3897/compcytogen.v5i3.1235
Paiz LM, Baumgärtner L, Graça WJ, Margarido VP. Basic cytogenetics and physical mapping of ribosomal genes in four Astyanax species (Characiformes, Characidae) collected in middle Paraná River, Iguassu National Park: Considerations on taxonomy and systematics of the genus. Comp Cytogenet. 2015; 9(1):51–65. https://doi.org/10.3897/CompCytogen.v9i1.9002
Pazza R, Kavalco KF, Prioli SMAP, Prioli AJ, Bertollo LAC. Chromosome polymorphism in Astyanax fasciatus (Teleostei, Characidae), Part 3: Analysis of the RAPD and ISSR molecular markers. Biochem Syst Ecol. 2007; 35(12):843–51. https://doi.org/10.1016/j.bse.2007.03.018
Pereira LHG, Hanner R, Foresti F, Oliveira C. Can DNA barcoding accurately discriminate megadiverse Neotropical freshwater fish fauna? BMC Genet. 2013; 14(20):1–14. https://doi.org/10.1186/1471-2156-14-20
Peres WAM, Bertollo LAC, Buckup PA, Blanco DR, Kantek DLZ, Moreira-Filho O. Invasion, dispersion and hybridization of fish associated to river transposition: Karyotypic evidence in Astyanax “bimaculatus group” (Characiformes: Characidae). Rev Fish Biol Fish. 2012; 22(2):519–26. https://doi.org/10.1007/s11160-011-9246-2
Peres WAM, Bertollo LAC, Moreira Filho O. Physical mapping of the 18S and 5S ribosomal genes in nine Characidae species (Teleostei, Characiformes). Genet Mol Biol. 2008; 31(1):222–26. https://doi.org/10.1590/s1415-47572008000200009
Pinkel D, Straume T, Gray JW. Cytogenetic analysis using quantitative, high-sensitivity, fluorescence hybridization. Proc Natl Acad Sci USA. 1986; 83(9):2934–38. Available from: https://www.pnas.org/doi/pdf/10.1073/pnas.83.9.2934
Piscor D, Alves AL, Parise-Maltempi PP. Chromosomal microstructure diversity in three Astyanax (Characiformes, Characidae) species: Comparative analysis of the chromosomal locations of the 18S and 5S rDNAs. Zebrafish. 2015; 12(1):81–90. https://doi.org/10.1089/zeb.2014.1036
Povh JA, Moreira HLM, Ribeiro RP, Prioli AJ, Vargas L, Blanck DV, Gasparino E, Streit Jr., DP. Estimativa da variabilidade genética em linhagens de tilápia do Nilo (Oreochromis niloticus) com a técnica de RAPD. Acta Sci. 2005; 27(1):1–10. https://doi.org/10.4025/actascianimsci.v27i1.1236
Puillandre N, Lambert A, Brouillet S, Achaz G. ABGD, Automatic Barcode Gap Discovery for primary species delimitation. Mol Ecol. 2012; 21(8):1864–77. https://doi.org/10.1111/j.1365-294X.2011.05239.x
Rambaut A. Tree Figure Drawing Tool Version 1.4.4 [Software]. Institute of Evolutionary Biology, University of Edinburgh. 2018. http://tree.bio.ed.ac.uk/software/figtree
Ratnasingham S, Hebert PDN. Barcoding BOLD: The Barcode of Life Data System (www.barcodinglife.org). Mol Ecol Notes. 2007; 7(3):355–64. https://doi.org/10.1111/j.1471-8286.2007.01678.x
Reis RB, Frota A, Deprá GC, Ota RR, Graça WJ. Freshwater fishes from Paraná State, Brazil: An annotated list, with comments on biogeographic patterns, threats, and future perspectives. vol. 4868. 2020. https://doi.org/10.11646/zootaxa.4868.4.1
Rodrigues RM. Estudos cromossômicos e moleculares em Loricariinae com ênfase em espécies de Rineloricaria (Siluriformes, Loricariidae): uma perspectiva evolutiva. [Master’s Thesis], São Paulo: Universidade de São Paulo; 2010. https://doi.org/10.11606/D.41.2010.tde-17122010-104716
Ronquist F, Mark P Van Der, Ayres DL, Hohna S. MrBayes 3.2: Efficient Bayesian phylogenetic inference and model choice across a large model space. Syst Biol. 2012; 61(3):539–42. https://doi.org/10.1093/sysbio/sys029
Rossini BC, Oliveira CAM, Melo FAG, Bertaco VA, Díaz de Astarloa JM, Rosso JJ, Foresti F, Oliveira C. Highlighting Astyanax species diversity through DNA barcoding. PLoS ONE. 2016; 11(12):e0167203. https://doi.org/10.1371/journal.pone.0167203
Santos DP, Felicetti D, Baumgärtner L, Margarido VP, Blanco DR, Moreira-Filho O, Lui RL. Contributions to the taxonomy of Trachelyopterus (Siluriformes): comparative cytogenetic analysis in three species of Auchenipteridae. Neotrop Ichthyol. 2021; 19(1):1–12. https://doi.org/10.1590/1982-0224-2020-0115
Da Silva LLL, Dos Santos AR, Giuliano-Caetano L, Dias AL. Chromosomal characterization in two species of an Astyanax bimaculatus complex (Characidae, Characiformes) using different techniques of chromosome banding. Cytotechnology. 2016; 68(4):1277–86. https://doi.org/10.1007/s10616-015-9888-3
Swofford, D. PAUP*. Phylogenetic Analysis Using Parsimony (*and Other Methods). Version 4.0. Sunderland, MA, USA: Sinauer Associates; 2002.
Teixeira TKSS, Venere PC, Ferreira DC, Mariotto S, Castro JP, Artoni RF, Centofante L. Comparative cytogenetics of Astyanax (Teleostei: Characidae) from the upper Paraguay basin. Neotrop Ichthyol. 2018; 16(1):1–08. https://doi.org/10.1590/1982-0224-20170092
Tenório RCCO, Vitorino CA, Souza IL, Oliveira C, Venere PC. Comparative cytogenetics in Astyanax (Characiformes: Characidae) with focus on the cytotaxonomy of the group. Neotrop Ichthyol. 2013; 11(3):553–64. https://doi.org/10.1590/S1679-62252013000300008
Terán GE, Benitez MF, Mirande JM. Opening the Trojan horse: phylogeny of Astyanax, two new genera and resurrection of Psalidodon (Teleostei: Characidae). Zool J Linn Soc. 2020; 190(4):1217–34. https://doi.org/10.1093/zoolinnean/zlaa019
Vicari MR, Artoni RF, Moreira-Filho O, Bertollo LAC. Colocalization of repetitive DNAs and silencing of major rRNA genes. A case report of the fish Astyanax janeiroensis. Cytogenet Genome Res. 2008a; 122(1):67–72. https://doi.org/10.1159/000151318
Vicari MR, Noleto RB, Artoni RF, Moreira-Filho O, Bertollo LAC. Comparative cytogenetics among species of the Astyanax scabripinnis complex. Evolutionary and biogeographical inferences. Genet Mol Biol. 2008b; 31(1):173–79. https://doi.org/10.1590/s1415-47572008000200002
Ward RD. DNA barcode divergence among species and genera of birds and fishes. Mol Ecol Resour. 2009; 9(4):1077–85. https://doi.org/10.1111/j.1755-0998.2009.02541.x
Ward RD, Zemlak TS, Innes BH, Last PR, Hebert PDN. DNA barcoding Australia’s fish species. Philos Trans R Soc Lond B Biol Sci. 2005; 360(1462):1847–57. https://doi.org/10.1098/rstb.2005.1716
Authors

![]() Sandro Tonello1,
Sandro Tonello1, ![]() Daniel R. Blanco2
Daniel R. Blanco2 ![]() ,
, ![]() Fiorindo J. Cerqueira1,
Fiorindo J. Cerqueira1, ![]() Natália L. Lira2,
Natália L. Lira2, ![]() Josiane B. Traldi3,
Josiane B. Traldi3, ![]() Carla S. Pavanelli4,
Carla S. Pavanelli4, ![]() Vladimir P. Margarido1,
Vladimir P. Margarido1, ![]() Mariane Gavazzoni1,
Mariane Gavazzoni1, ![]() Marcos V. Pupo2 and
Marcos V. Pupo2 and ![]() Roberto L. Lui1
Roberto L. Lui1
[1] Universidade Estadual do Oeste do Paraná, Centro de Ciências Biológicas e da Saúde, R. Universitária, 1619,Universitário, 85819-170 Cascavel, PR, Brazil. (ST) sandrotonello@gmail.com, (FJC) ffiorindocerqueira@gmail.com, (VPM)vladimir.margarido@unioeste.br, (MG) marianebio05@hotmail.com, (RLL) roberto.lui@unioeste.br.
[2] Universidade Tecnológica Federal do Paraná, Prolongamento da Rua Cerejeira, s/n, 85892-000 Santa Helena, PR, Brazil. (DRB) danielrblanco@utfpr.edu.br (corresponding author), (NLL) natalia.limalira@hotmail.com, (MVP) marcosviniciuspupo@gmail.com.
[3] Universidade Federal do Amazonas, Instituto de Ciências Biológicas, Departamento de Genética, Av. General Rodrigo Octavio,6200, 69080-900 Manaus, AM, Brazil. jositraldi@hotmail.com.
[4] Universidade Estadual de Maringá, Zona 7, Nupélia, Coleção Ictiológica. Av. Colombo, 5790, 87020-900 Maringá, PR, Brazil. carlasp@nupelia.uem.br,
Authors’ Contribution 

Sandro Tonello: Conceptualization, Data curation, Formal analysis, Investigation, Methodology, Project administration, Resources, Visualization, Writing-original draft, Writing-review and editing.
Daniel R. Blanco: Conceptualization, Data curation, Formal analysis, Funding acquisition, Investigation, Methodology, Project administration, Resources, Supervision, Validation, Visualization, Writing-original draft, Writing-review and editing.
Fiorindo J. Cerqueira: Methodology, Writing-original draft.
Natália L. Lira: Formal analysis, Methodology, Writing-original draft, Writing-review and editing.
Josiane B. Traldi: Conceptualization, Formal analysis, Investigation, Methodology, Writing-original draft.
Carla S. Pavanelli: Investigation, Resources, Validation, Writing-review and editing.
Vladimir P. Margarido: Conceptualization, Investigation, Validation, Writing-original draft, Writing-review and editing.
Mariane Gavazzoni: Investigation, Writing-original draft, Writing-review and editing.
Marcos V. Pupo: Methodology, Writing-original draft, Writing-review and editing.
Roberto L. Lui: Conceptualization, Formal analysis, Funding acquisition, Investigation, Methodology, Project administration, Resources, Validation, Visualization, Writing-original draft, Writing-review and editing.
Ethical Statement
UTFPR Animal Use Ethics Committee, Protocol CEUA: 2018–5; License permanent SISBIO 38532; SisGen A11E5F8.
Competing Interests
The authors declare no competing interests.
How to cite this article
Tonello S, Blanco DR, Cerqueira FJ, Lira NL, Traldi JB, Pavanelli CS, Margarido VP, Gavazzoni M, Pupo MV, Lui RL. High rDNA polymorphisms in Astyanax lacustris (Characiformes: Characidae): new insights about the cryptic diversity in A. bimaculatus species complex with emphasis on the Paraná River basin. Neotrop Ichthyol. 2022; 20(2):e210147. https://doi.org/10.1590/1982-0224-2021-0147
Copyright
This is an open access article under the terms of the Creative Commons Attribution License, which permits use, distribution and reproduction in any medium, provided the original work is properly cited.
Distributed under
Creative Commons CC-BY 4.0

© 2022 The Authors.
Diversity and Distributions Published by SBI
![]() Accepted May 18, 2022 by Alexandre Hilsdorf
Accepted May 18, 2022 by Alexandre Hilsdorf
![]() Submitted October 3, 2021
Submitted October 3, 2021
![]() Epub June 24, 2022
Epub June 24, 2022